Results breakdown of the 1991 Spanish local elections (Community of Madrid)
This is the results breakdown of the local elections held in the Community of Madrid on 26 May 1991. The following tables show detailed results in the autonomous community's most populous municipalities, sorted alphabetically.[1][2][3]
Overall
| Parties and coalitions | Popular vote | Councillors | ||||
|---|---|---|---|---|---|---|
| Votes | % | ±pp | Total | +/− | ||
| People's Party (PP)1 | 913,614 | 40.63 | +11.19 | 594 | +127 | |
| Spanish Socialist Workers' Party (PSOE) | 816,952 | 36.34 | –4.98 | 710 | +17 | |
| United Left (IU) | 268,564 | 11.94 | +3.96 | 159 | +46 | |
| Democratic and Social Centre (CDS) | 78,196 | 3.48 | –11.86 | 63 | –169 | |
| The Greens (LV) | 27,123 | 1.21 | +0.71 | 1 | +1 | |
| Ruiz-Mateos Group (ARM) | 23,404 | 1.04 | New | 0 | ±0 | |
| The Ecologists (LE) | 8,404 | 0.37 | New | 0 | ±0 | |
| Madrilenian Independent Regional Party (PRIM) | 7,990 | 0.36 | New | 9 | +9 | |
| Green Union (UVE)2 | 6,514 | 0.29 | +0.07 | 0 | ±0 | |
| Party of Madrid (PAM) | 4,920 | 0.22 | New | 1 | +1 | |
| Workers' Socialist Party (PST) | 3,946 | 0.18 | New | 0 | ±0 | |
| Spanish Phalanx of the CNSO (FE–JONS) | 3,128 | 0.14 | –0.08 | 0 | ±0 | |
| Independent Group of Torrejón (GIT) | 3,062 | 0.14 | New | 3 | +3 | |
| Left Platform (PCE (m–l)–CRPE)3 | 2,702 | 0.12 | +0.05 | 0 | ±0 | |
| Convergence of Independent Candidacies (CCI) | 1,955 | 0.09 | New | 3 | +3 | |
| Citizen Independent Group Gray Panthers (ACI) | 1,745 | 0.08 | New | 0 | ±0 | |
| United Tres Cantos (TCU) | 1,492 | 0.07 | New | 6 | +6 | |
| Alcalá Independent Renovators (RIA) | 1,187 | 0.05 | New | 0 | ±0 | |
| Alliance for the Republic (AxR)4 | 1,071 | 0.05 | –0.01 | 0 | ±0 | |
| Independent Group of Cercedilla (GIC) | 899 | 0.04 | –0.01 | 4 | –2 | |
| Revolutionary Workers' Party of Spain (PORE) | 859 | 0.04 | –0.01 | 0 | ±0 | |
| Independent Spanish Phalanx (FEI) | 605 | 0.03 | New | 0 | ±0 | |
| Sierra Norte Independent Candidacy (CISN) | 431 | 0.02 | New | 13 | +13 | |
| Others | 40,753 | 1.81 | — | 283 | +11 | |
| Blank ballots | 28,836 | 1.28 | +0.17 | |||
| Total | 2,248,352 | 1,849 | +66 | |||
| Valid votes | 2,248,352 | 99.54 | +0.73 | |||
| Invalid votes | 10,429 | 0.46 | –0.73 | |||
| Votes cast / turnout | 2,258,781 | 58.74 | –10.99 | |||
| Abstentions | 1,586,665 | 41.26 | +10.99 | |||
| Registered voters | 3,845,446 | |||||
| Sources[1][4] | ||||||
City control
The following table lists party control in the most populous municipalities, including provincial capitals (shown in bold).[1] Gains for a party are displayed with the cell's background shaded in that party's colour.
| Municipality | Population | Previous control | New control | ||
|---|---|---|---|---|---|
| Alcalá de Henares | 155,548 | Spanish Socialist Workers' Party (PSOE) | Spanish Socialist Workers' Party (PSOE) | ||
| Alcobendas | 78,295 | Spanish Socialist Workers' Party (PSOE) | Spanish Socialist Workers' Party (PSOE) | ||
| Alcorcón | 141,080 | Spanish Socialist Workers' Party (PSOE) | Spanish Socialist Workers' Party (PSOE) | ||
| Coslada | 73,252 | United Left (IU) | United Left (IU) | ||
| Fuenlabrada | 141,496 | Spanish Socialist Workers' Party (PSOE) | Spanish Socialist Workers' Party (PSOE) | ||
| Getafe | 139,068 | Spanish Socialist Workers' Party (PSOE) | Spanish Socialist Workers' Party (PSOE) | ||
| Leganés | 172,729 | Spanish Socialist Workers' Party (PSOE) | Spanish Socialist Workers' Party (PSOE) | ||
| Madrid | 3,120,732 | Democratic and Social Centre (CDS) | People's Party (PP) | ||
| Móstoles | 189,707 | Spanish Socialist Workers' Party (PSOE) | Spanish Socialist Workers' Party (PSOE) | ||
| Parla | 69,017 | Spanish Socialist Workers' Party (PSOE) | Spanish Socialist Workers' Party (PSOE) | ||
| Torrejón de Ardoz | 86,678 | Spanish Socialist Workers' Party (PSOE) | Spanish Socialist Workers' Party (PSOE) | ||
Municipalities
Alcalá de Henares
- Population: 155,548
 | ||||||
| Parties and coalitions | Popular vote | Seats | ||||
|---|---|---|---|---|---|---|
| Votes | % | ±pp | Total | +/− | ||
| Spanish Socialist Workers' Party (PSOE) | 23,344 | 40.29 | –3.57 | 13 | ±0 | |
| People's Party (PP)1 | 14,801 | 25.55 | +8.01 | 8 | +3 | |
| United Left (IU) | 10,689 | 18.45 | +5.64 | 6 | +2 | |
| Democratic and Social Centre (CDS) | 2,766 | 4.77 | –13.80 | 0 | –5 | |
| Green Union (UVE) | 1,470 | 2.54 | New | 0 | ±0 | |
| Alcalá Independent Renovators (RIA) | 1,187 | 2.05 | New | 0 | ±0 | |
| Left Platform (PCE (m–l)–CRPE)2 | 1,180 | 2.04 | +1.84 | 0 | ±0 | |
| Democratic Ecologist Cooperation (CED) | 594 | 1.03 | New | 0 | ±0 | |
| Madrilenian Independent Regional Party (PRIM) | 589 | 1.02 | New | 0 | ±0 | |
| Spanish Phalanx of the CNSO (FE–JONS) | 329 | 0.57 | New | 0 | ±0 | |
| Blank ballots | 986 | 1.70 | +0.41 | |||
| Total | 57,935 | 27 | ±0 | |||
| Valid votes | 57,935 | 99.44 | +0.83 | |||
| Invalid votes | 325 | 0.56 | –0.83 | |||
| Votes cast / turnout | 58,260 | 52.65 | –12.52 | |||
| Abstentions | 52,400 | 47.35 | +12.52 | |||
| Registered voters | 110,660 | |||||
| Sources[1][5][6] | ||||||
Alcobendas
- Population: 78,295
 | ||||||
| Parties and coalitions | Popular vote | Seats | ||||
|---|---|---|---|---|---|---|
| Votes | % | ±pp | Total | +/− | ||
| Spanish Socialist Workers' Party (PSOE) | 16,698 | 54.03 | +4.22 | 15 | +1 | |
| People's Party (PP)1 | 9,563 | 30.94 | +6.69 | 8 | +1 | |
| United Left (IU) | 2,378 | 7.69 | +3.76 | 2 | +2 | |
| Democratic and Social Centre (CDS) | 876 | 2.83 | –12.77 | 0 | –4 | |
| The Greens (LV) | 658 | 2.13 | New | 0 | ±0 | |
| Convergence of Independent Candidacies (CCI) | 230 | 0.74 | New | 0 | ±0 | |
| Madrilenian Independent Regional Party (PRIM) | 98 | 0.32 | New | 0 | ±0 | |
| Party of Madrid (PAM) | 71 | 0.23 | New | 0 | ±0 | |
| Blank ballots | 334 | 1.08 | +0.02 | |||
| Total | 30,906 | 25 | ±0 | |||
| Valid votes | 30,906 | 99.54 | +0.58 | |||
| Invalid votes | 142 | 0.46 | –0.58 | |||
| Votes cast / turnout | 31,048 | 58.83 | –10.98 | |||
| Abstentions | 21,729 | 41.17 | +10.98 | |||
| Registered voters | 52,777 | |||||
| Sources[1][5][7] | ||||||
Alcorcón
- Population: 141,080
 | ||||||
| Parties and coalitions | Popular vote | Seats | ||||
|---|---|---|---|---|---|---|
| Votes | % | ±pp | Total | +/− | ||
| Spanish Socialist Workers' Party (PSOE) | 24,077 | 42.32 | –4.58 | 13 | –1 | |
| People's Party (PP)1 | 17,468 | 30.70 | +12.68 | 9 | +4 | |
| United Left (IU) | 7,504 | 13.19 | +5.04 | 4 | +2 | |
| Democratic and Social Centre (CDS) | 3,196 | 5.62 | –15.05 | 1 | –5 | |
| The Ecologists (LE) | 1,230 | 2.16 | New | 0 | ±0 | |
| Party of Madrid (PAM) | 883 | 1.55 | New | 0 | ±0 | |
| Left Democratic Platform (PDI) | 698 | 1.23 | New | 0 | ±0 | |
| Spanish Phalanx of the CNSO (FE–JONS) | 367 | 0.65 | New | 0 | ±0 | |
| Workers' Socialist Party (PST) | 240 | 0.42 | New | 0 | ±0 | |
| Madrilenian Independent Regional Party (PRIM) | 191 | 0.34 | New | 0 | ±0 | |
| Left Platform (PCE (m–l)–CRPE) | 149 | 0.26 | New | 0 | ±0 | |
| Convergence of Independent Candidacies (CCI) | 86 | 0.15 | New | 0 | ±0 | |
| Blank ballots | 801 | 1.41 | +0.22 | |||
| Total | 56,890 | 27 | ±0 | |||
| Valid votes | 56,890 | 99.50 | +0.72 | |||
| Invalid votes | 287 | 0.50 | –0.72 | |||
| Votes cast / turnout | 57,177 | 55.11 | –13.95 | |||
| Abstentions | 46,580 | 44.89 | +13.95 | |||
| Registered voters | 103,757 | |||||
| Sources[1][5][8] | ||||||
Coslada
- Population: 73,252
 | ||||||
| Parties and coalitions | Popular vote | Seats | ||||
|---|---|---|---|---|---|---|
| Votes | % | ±pp | Total | +/− | ||
| United Left (IU) | 13,298 | 51.64 | +15.53 | 14 | +4 | |
| Spanish Socialist Workers' Party (PSOE) | 7,684 | 29.84 | –4.59 | 8 | –2 | |
| People's Party (PP)1 | 3,224 | 12.52 | +3.17 | 3 | +1 | |
| Democratic and Social Centre (CDS) | 1,015 | 3.94 | –9.49 | 0 | –3 | |
| Madrilenian Independent Regional Party (PRIM) | 212 | 0.82 | New | 0 | ±0 | |
| Blank ballots | 320 | 1.24 | +0.02 | |||
| Total | 25,753 | 25 | ±0 | |||
| Valid votes | 25,753 | 99.46 | +0.61 | |||
| Invalid votes | 141 | 0.54 | –0.61 | |||
| Votes cast / turnout | 25,894 | 54.14 | –13.95 | |||
| Abstentions | 21,937 | 45.86 | +13.95 | |||
| Registered voters | 47,831 | |||||
| Sources[1][5][9] | ||||||
Fuenlabrada
- Population: 141,496
 | ||||||
| Parties and coalitions | Popular vote | Seats | ||||
|---|---|---|---|---|---|---|
| Votes | % | ±pp | Total | +/− | ||
| Spanish Socialist Workers' Party (PSOE) | 24,883 | 58.21 | +1.41 | 18 | +1 | |
| People's Party (PP)1 | 7,514 | 17.58 | +5.48 | 5 | +2 | |
| United Left (IU) | 6,624 | 15.50 | +7.17 | 4 | +2 | |
| Democratic and Social Centre (CDS) | 1,539 | 3.60 | –12.52 | 0 | –5 | |
| The Ecologists (LE) | 950 | 2.22 | New | 0 | ±0 | |
| Madrilenian Independent Regional Party (PRIM) | 291 | 0.68 | New | 0 | ±0 | |
| Convergence of Independent Candidacies (CCI) | 240 | 0.56 | New | 0 | ±0 | |
| Spanish Phalanx of the CNSO (FE–JONS) | 144 | 0.34 | –0.14 | 0 | ±0 | |
| Left Platform (PCE (m–l)–CRPE)2 | 118 | 0.28 | +0.06 | 0 | ±0 | |
| Alliance for the Republic (AxR) | 115 | 0.27 | New | 0 | ±0 | |
| Blank ballots | 326 | 0.76 | –0.32 | |||
| Total | 42,744 | 27 | ±0 | |||
| Valid votes | 42,744 | 99.66 | +0.96 | |||
| Invalid votes | 147 | 0.34 | –0.96 | |||
| Votes cast / turnout | 42,891 | 49.15 | –14.34 | |||
| Abstentions | 44,367 | 50.85 | +14.34 | |||
| Registered voters | 87,258 | |||||
| Sources[1][5][10] | ||||||
Getafe
- Population: 139,068
 | ||||||
| Parties and coalitions | Popular vote | Seats | ||||
|---|---|---|---|---|---|---|
| Votes | % | ±pp | Total | +/− | ||
| Spanish Socialist Workers' Party (PSOE) | 29,479 | 50.05 | +2.76 | 15 | +1 | |
| People's Party (PP)1 | 11,854 | 20.13 | +4.99 | 6 | +2 | |
| United Left (IU) | 11,682 | 19.83 | +3.21 | 6 | +1 | |
| Democratic and Social Centre (CDS) | 2,642 | 4.49 | –10.77 | 0 | –4 | |
| The Greens (LV) | 840 | 1.43 | New | 0 | ±0 | |
| Independent Candidacy Getafe (GCI) | 588 | 1.00 | New | 0 | ±0 | |
| Workers' Socialist Party (PST) | 355 | 0.60 | –0.06 | 0 | ±0 | |
| The Ecologists (LE) | 333 | 0.57 | New | 0 | ±0 | |
| Alliance for the Republic (AxR)2 | 228 | 0.39 | +0.02 | 0 | ±0 | |
| Spanish Phalanx of the CNSO (FE–JONS) | 196 | 0.33 | New | 0 | ±0 | |
| Madrilenian Independent Regional Party (PRIM) | 115 | 0.20 | New | 0 | ±0 | |
| Blank ballots | 586 | 0.99 | –0.93 | |||
| Total | 58,898 | 27 | ±0 | |||
| Valid votes | 58,898 | 99.37 | +0.89 | |||
| Invalid votes | 374 | 0.63 | –0.89 | |||
| Votes cast / turnout | 59,272 | 58.31 | –13.63 | |||
| Abstentions | 42,385 | 41.69 | +13.63 | |||
| Registered voters | 101,657 | |||||
| Sources[1][5][11] | ||||||
Leganés
- Population: 172,729
 | ||||||
| Parties and coalitions | Popular vote | Seats | ||||
|---|---|---|---|---|---|---|
| Votes | % | ±pp | Total | +/− | ||
| Spanish Socialist Workers' Party (PSOE) | 31,967 | 47.70 | –5.57 | 14 | –2 | |
| United Left (IU) | 13,631 | 20.34 | +9.43 | 6 | +3 | |
| People's Party (PP)1 | 13,438 | 20.05 | +7.44 | 6 | +3 | |
| Democratic and Social Centre (CDS) | 3,377 | 5.04 | –11.39 | 1 | –4 | |
| The Greens (LV) | 1,328 | 1.98 | New | 0 | ±0 | |
| The Ecologists (LE) | 608 | 0.91 | New | 0 | ±0 | |
| Convergence of Independent Candidacies (CCI) | 531 | 0.79 | New | 0 | ±0 | |
| Madrilenian Independent Regional Party (PRIM) | 485 | 0.72 | New | 0 | ±0 | |
| Workers' Socialist Party (PST) | 402 | 0.60 | New | 0 | ±0 | |
| Left Platform (PCE (m–l)–CRPE)2 | 174 | 0.26 | +0.04 | 0 | ±0 | |
| Party of Madrid (PAM) | 160 | 0.24 | New | 0 | ±0 | |
| Blank ballots | 921 | 1.37 | +0.34 | |||
| Total | 67,022 | 27 | ±0 | |||
| Valid votes | 67,022 | 99.47 | +0.97 | |||
| Invalid votes | 356 | 0.53 | –0.97 | |||
| Votes cast / turnout | 67,378 | 54.24 | –14.91 | |||
| Abstentions | 56,854 | 45.76 | +14.91 | |||
| Registered voters | 124,232 | |||||
| Sources[1][5][12] | ||||||
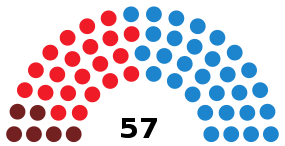
Madrid
- Population: 3,120,732
 | ||||||
| Parties and coalitions | Popular vote | Seats | ||||
|---|---|---|---|---|---|---|
| Votes | % | ±pp | Total | +/− | ||
| People's Party (PP)1 | 702,834 | 47.23 | +13.24 | 30 | +10 | |
| Spanish Socialist Workers' Party (PSOE) | 510,556 | 34.31 | –6.16 | 21 | –3 | |
| United Left (IU) | 144,640 | 9.72 | +3.61 | 6 | +3 | |
| Democratic and Social Centre (CDS) | 43,112 | 2.90 | –12.15 | 0 | –8 | |
| Ruiz-Mateos Group (ARM) | 23,404 | 1.57 | New | 0 | ±0 | |
| The Greens (LV) | 18,947 | 1.27 | +0.59 | 0 | ±0 | |
| The Ecologists (LE) | 5,051 | 0.34 | New | 0 | ±0 | |
| Green Union (UVE)2 | 4,335 | 0.29 | –0.01 | 0 | ±0 | |
| Workers' Socialist Party (PST) | 2,949 | 0.20 | New | 0 | ±0 | |
| Madrilenian Independent Regional Party (PRIM) | 2,610 | 0.18 | New | 0 | ±0 | |
| Party of Madrid (PAM) | 2,393 | 0.16 | New | 0 | ±0 | |
| Spanish Phalanx of the CNSO (FE–JONS) | 1,962 | 0.13 | –0.15 | 0 | ±0 | |
| Citizen Independent Group Gray Panthers (ACI) | 1,745 | 0.12 | New | 0 | ±0 | |
| Revolutionary Workers' Party of Spain (PORE) | 859 | 0.06 | –0.01 | 0 | ±0 | |
| Left Platform (PCE (m–l)–CRPE)3 | 740 | 0.05 | –0.03 | 0 | ±0 | |
| Alliance for the Republic (AxR)4 | 728 | 0.05 | –0.02 | 0 | ±0 | |
| Independent Spanish Phalanx (FEI) | 605 | 0.04 | New | 0 | ±0 | |
| Spanish Catholic Movement (MCE) | 581 | 0.04 | New | 0 | ±0 | |
| Commoners' Land (TC) | 563 | 0.04 | New | 0 | ±0 | |
| United Republican Action (ARU) | 534 | 0.04 | New | 0 | ±0 | |
| Carlist Party (PC) | 341 | 0.02 | New | 0 | ±0 | |
| Generational Integration (IG) | 295 | 0.02 | New | 0 | ±0 | |
| Political Natural Power Party (PPNP) | 258 | 0.02 | New | 0 | ±0 | |
| Blank ballots | 18,055 | 1.21 | +0.18 | |||
| Total | 1,488,097 | 57 | +2 | |||
| Valid votes | 1,488,097 | 99.63 | +0.75 | |||
| Invalid votes | 5,520 | 0.37 | –0.75 | |||
| Votes cast / turnout | 1,493,617 | 59.15 | –10.91 | |||
| Abstentions | 1,031,330 | 40.85 | +10.91 | |||
| Registered voters | 2,524,947 | |||||
| Sources[1][5][13][14] | ||||||
Móstoles
- Population: 189,707
 | ||||||
| Parties and coalitions | Popular vote | Seats | ||||
|---|---|---|---|---|---|---|
| Votes | % | ±pp | Total | +/− | ||
| Spanish Socialist Workers' Party (PSOE) | 22,803 | 36.59 | –8.74 | 11 | –2 | |
| People's Party (PP)1 | 19,890 | 31.92 | +14.65 | 10 | +5 | |
| United Left (IU) | 10,896 | 17.48 | +7.68 | 5 | +2 | |
| Democratic and Social Centre (CDS) | 3,313 | 5.32 | –16.35 | 1 | –5 | |
| The Greens (LV) | 2,702 | 4.34 | New | 0 | ±0 | |
| Green Union (UVE) | 709 | 1.14 | New | 0 | ±0 | |
| Democratic Platform for Móstoles (PDxM) | 479 | 0.77 | New | 0 | ±0 | |
| Revolutionary Communist League (LCR) | 254 | 0.41 | –0.06 | 0 | ±0 | |
| Party of Madrid (PAM) | 236 | 0.38 | New | 0 | ±0 | |
| Madrilenian Independent Regional Party (PRIM) | 223 | 0.36 | New | 0 | ±0 | |
| Blank ballots | 813 | 1.30 | +0.21 | |||
| Total | 62,318 | 27 | ±0 | |||
| Valid votes | 62,318 | 99.52 | +0.72 | |||
| Invalid votes | 300 | 0.48 | –0.72 | |||
| Votes cast / turnout | 62,618 | 50.39 | –13.02 | |||
| Abstentions | 61,658 | 49.61 | +13.02 | |||
| Registered voters | 124,276 | |||||
| Sources[1][5][15] | ||||||
Parla
- Population: 69,017
 | ||||||
| Parties and coalitions | Popular vote | Seats | ||||
|---|---|---|---|---|---|---|
| Votes | % | ±pp | Total | +/− | ||
| Spanish Socialist Workers' Party (PSOE) | 9,475 | 42.90 | –8.44 | 12 | –3 | |
| United Left (IU) | 6,733 | 30.48 | +13.42 | 8 | +4 | |
| People's Party (PP)1 | 3,925 | 17.77 | +5.39 | 5 | +1 | |
| Democratic and Social Centre (CDS) | 1,090 | 4.93 | –7.98 | 0 | –3 | |
| Left Platform (PCE (m–l)–CRPE) | 341 | 1.54 | New | 0 | ±0 | |
| Madrilenian Independent Regional Party (PRIM) | 293 | 1.33 | New | 0 | ±0 | |
| Blank ballots | 231 | 1.05 | +0.05 | |||
| Total | 22,088 | 25 | ±0 | |||
| Valid votes | 22,088 | 99.52 | +0.65 | |||
| Invalid votes | 106 | 0.48 | –0.65 | |||
| Votes cast / turnout | 22,194 | 49.52 | –17.06 | |||
| Abstentions | 22,628 | 50.48 | +17.06 | |||
| Registered voters | 44,822 | |||||
| Sources[1][5][16] | ||||||
Torrejón de Ardoz
- Population: 86,678
 | ||||||
| Parties and coalitions | Popular vote | Seats | ||||
|---|---|---|---|---|---|---|
| Votes | % | ±pp | Total | +/− | ||
| Spanish Socialist Workers' Party (PSOE) | 9,074 | 31.98 | –8.83 | 9 | –2 | |
| People's Party (PP)1 | 7,598 | 26.78 | +9.12 | 8 | +4 | |
| United Left (IU) | 5,346 | 18.84 | +3.71 | 5 | +1 | |
| Independent Group of Torrejón (GIT) | 3,062 | 10.79 | New | 3 | +3 | |
| Democratic and Social Centre (CDS) | 1,358 | 4.79 | –13.52 | 0 | –5 | |
| The Greens (LV) | 1,029 | 3.63 | New | 0 | ±0 | |
| Madrilenian Independent Regional Party (PRIM) | 226 | 0.80 | New | 0 | ±0 | |
| Party of Madrid (PAM) | 149 | 0.53 | New | 0 | ±0 | |
| Spanish Phalanx of the CNSO (FE–JONS) | 130 | 0.46 | New | 0 | ±0 | |
| Workers' Party of Spain–Communist Unity (PTE–UC) | n/a | n/a | –5.71 | 0 | –1 | |
| Blank ballots | 398 | 1.40 | –0.09 | |||
| Total | 28,370 | 25 | ±0 | |||
| Valid votes | 28,370 | 99.39 | +0.35 | |||
| Invalid votes | 173 | 0.61 | –0.35 | |||
| Votes cast / turnout | 28,543 | 51.14 | –15.99 | |||
| Abstentions | 27,274 | 48.86 | +15.99 | |||
| Registered voters | 55,817 | |||||
| Sources[1][5][17] | ||||||
See also
References
- "Municipal elections in the Community of Madrid since 1979". historiaelectoral.com (in Spanish). Electoral History. Retrieved 13 December 2018.
- "Elecciones Municipales. 26 de mayo de 1991. Madrid". elecciones.eldiario.es (in Spanish). eldiario.es. Retrieved 7 June 2019.
- "26M/Elecciones Municipales 1991. Comunidad de Madrid". especiales.publico.es (in Spanish). Público. Retrieved 29 December 2018.
- "Electoral Results Consultation. Municipal. May 1991. Community of Madrid". www.infoelectoral.mir.es (in Spanish). Ministry of the Interior. Retrieved 22 December 2018.
- "Local election results, 26 May 1991" (PDF). www.juntaelectoralcentral.es (in Spanish). Central Electoral Commission. Retrieved 16 February 2018.
- "Electoral Results Consultation. Municipal. May 1991. Alcalá de Henares Municipality". www.infoelectoral.mir.es (in Spanish). Ministry of the Interior. Retrieved 13 December 2018.
- "Electoral Results Consultation. Municipal. May 1991. Alcobendas Municipality". www.infoelectoral.mir.es (in Spanish). Ministry of the Interior. Retrieved 13 December 2018.
- "Electoral Results Consultation. Municipal. May 1991. Alcorcón Municipality". www.infoelectoral.mir.es (in Spanish). Ministry of the Interior. Retrieved 13 December 2018.
- "Electoral Results Consultation. Municipal. May 1991. Coslada Municipality". www.infoelectoral.mir.es (in Spanish). Ministry of the Interior. Retrieved 13 December 2018.
- "Electoral Results Consultation. Municipal. May 1991. Fuenlabrada Municipality". www.infoelectoral.mir.es (in Spanish). Ministry of the Interior. Retrieved 13 December 2018.
- "Electoral Results Consultation. Municipal. May 1991. Getafe Municipality". www.infoelectoral.mir.es (in Spanish). Ministry of the Interior. Retrieved 13 December 2018.
- "Electoral Results Consultation. Municipal. May 1991. Leganés Municipality". www.infoelectoral.mir.es (in Spanish). Ministry of the Interior. Retrieved 13 December 2018.
- "Electoral Results Consultation. Municipal. May 1991. Madrid Municipality". www.infoelectoral.mir.es (in Spanish). Ministry of the Interior. Retrieved 12 November 2017.
- "Municipal elections in Madrid since 1979". historiaelectoral.com (in Spanish). Electoral History. Retrieved 30 September 2017.
- "Electoral Results Consultation. Municipal. May 1991. Móstoles Municipality". www.infoelectoral.mir.es (in Spanish). Ministry of the Interior. Retrieved 13 December 2018.
- "Electoral Results Consultation. Municipal. May 1991. Parla Municipality". www.infoelectoral.mir.es (in Spanish). Ministry of the Interior. Retrieved 13 December 2018.
- "Electoral Results Consultation. Municipal. May 1991. Torrejón de Ardoz Municipality". www.infoelectoral.mir.es (in Spanish). Ministry of the Interior. Retrieved 13 December 2018.
| Regional elections | |
|---|---|
| General elections | |
| European Parliament elections | |
| Local elections | |
This article is issued from Wikipedia. The text is licensed under Creative Commons - Attribution - Sharealike. Additional terms may apply for the media files.