Results breakdown of the 1989 European Parliament election in Spain
This is the results breakdown of the European Parliament election held in Spain on 15 June 1989. The following tables show detailed results in each of the country's 17 autonomous communities and in the autonomous cities of Ceuta and Melilla.[1]
| Main: 1989 European Parliament election in Spain | ||||
|---|---|---|---|---|
| 15 June 1989 1994 → | ||||
 | ||||
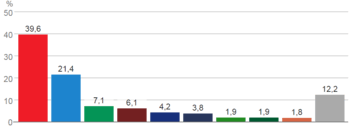 | ||||
Party | Votes | % | Seats | |
| PSOE | 6,275,552 | 39.6% | 27 | |
| PP | 3,395,015 | 21.4% | 15 | |
| CDS | 1,133,429 | 7.1% | 5 | |
| IU | 961,742 | 6.1% | 4 | |
| CiU | 666,602 | 4.2% | 2 | |
| Ruiz-Mateos | 608,560 | 3.8% | 2 | |
| CN | 303,038 | 1.9% | 1 | |
| PA | 295,047 | 1.9% | 1 | |
| IP | 290,286 | 1.4% | 1 | |
| Others | 1,929,199 | 12.2% | 2 | |
Total | 15,858,470 | 100.0% | 60 | |
Electoral system
The 60 members of the European Parliament allocated to Spain as per the 1985 Treaty of Accession were elected using the D'Hondt method and a closed list proportional representation, with no threshold being applied in order to be entitled to enter seat distribution. Seats were allocated to a single multi-member constituency comprising the entire national territory. Voting was on the basis of universal suffrage, which comprised all nationals over eighteen and in full enjoyment of their political rights.[2][3] The use of the D'Hondt method might result in an effective threshold depending on the district magnitude.[4]
The electoral law allowed for parties and federations registered in the interior ministry, coalitions and groupings of electors to present lists of candidates. Parties and federations intending to form a coalition ahead of an election were required to inform the relevant Electoral Commission within ten days of the election call. In order to be entitled to run, parties, federations, coalitions and groupings of electors needed to secure the signature of at least 15,000 registered electors; this requirement could be lifted and replaced through the signature of at least 50 elected officials—deputies, senators, MEPs or members from the legislative assemblies of autonomous communities or from local city councils. Electors and elected officials were disallowed from signing for more than one list of candidates.[2]
Nationwide
| Parties and coalitions | Popular vote | Seats | ||||
|---|---|---|---|---|---|---|
| Votes | % | ±pp | Total | +/− | ||
| Spanish Socialist Workers' Party (PSOE) | 6,275,552 | 39.57 | +0.51 | 27 | –1 | |
| People's Party (PP)1 | 3,395,015 | 21.41 | –4.13 | 15 | –2 | |
| Democratic and Social Centre (CDS) | 1,133,429 | 7.15 | –3.11 | 5 | –2 | |
| United Left (IU) | 961,742 | 6.06 | +0.81 | 4 | +1 | |
| Convergence and Union (CiU) | 666,602 | 4.20 | –0.23 | 2 | –1 | |
| Ruiz-Mateos Group (Ruiz-Mateos)2 | 608,560 | 3.84 | +3.23 | 2 | +2 | |
| Nationalist Coalition (CN)3 | 303,038 | 1.91 | +0.16 | 1 | +1 | |
| Andalusian Party (PA) | 295,047 | 1.86 | +0.90 | 1 | +1 | |
| Left of the Peoples (IP)4 | 290,286 | 1.83 | +0.47 | 1 | +1 | |
| Popular Unity (HB) | 269,094 | 1.70 | –0.17 | 1 | ±0 | |
| For the Europe of the Peoples (PEP)5 | 238,909 | 1.51 | –0.19 | 1 | ±0 | |
| Workers' Party of Spain–Communist Unity (PTE–UC) | 197,095 | 1.24 | +0.08 | 0 | ±0 | |
| Green List (Adhered to the European Greens) (LV)6 | 164,524 | 1.04 | +0.14 | 0 | ±0 | |
| The Ecologist Greens (LVE) | 161,903 | 1.02 | New | 0 | ±0 | |
| Federation of Regional Parties (FPR)7 | 151,835 | 0.96 | –0.16 | 0 | ±0 | |
| Communist Party of the Peoples of Spain–PCC (PCPE–PCC) | 79,970 | 0.50 | New | 0 | ±0 | |
| National Front (FN) | 60,672 | 0.38 | –0.26 | 0 | ±0 | |
| Spanish Vertex Ecological Development Revindication (VERDE) | 58,686 | 0.37 | New | 0 | ±0 | |
| Social Democratic Coalition (CSD) | 52,577 | 0.33 | +0.20 | 0 | ±0 | |
| Green Alternative–Ecologist Movement of Catalonia (AV–MEC) | 47,250 | 0.30 | New | 0 | ±0 | |
| Galician Nationalist Bloc (BNG) | 46,052 | 0.29 | +0.01 | 0 | ±0 | |
| Workers' Socialist Party–Revolutionary Workers' Party (PST–PORE)8 | 38,683 | 0.24 | –0.32 | 0 | ±0 | |
| Europe for Life (EPV) | 30,252 | 0.19 | New | 0 | ±0 | |
| Spanish Phalanx of the CNSO (FE–JONS) | 24,340 | 0.15 | +0.03 | 0 | ±0 | |
| Free Catalonia (CLL) | 19,774 | 0.12 | New | 0 | ±0 | |
| Humanist Party (PH) | 19,356 | 0.12 | ±0.00 | 0 | ±0 | |
| Alliance for the Republic (AxR)9 | 17,189 | 0.11 | –0.02 | 0 | ±0 | |
| Asturian Nationalist Unity (UNA) | 13,165 | 0.08 | New | 0 | ±0 | |
| Centrist Unity–Democratic Spanish Party (PED) | 10,392 | 0.07 | +0.02 | 0 | ±0 | |
| Andalusian Liberation (LA) | 9,421 | 0.06 | +0.01 | 0 | ±0 | |
| Initiative for a European Democracy (IDE) | 8,789 | 0.06 | New | 0 | ±0 | |
| Carlist Party (PC) | 8,477 | 0.05 | New | 0 | ±0 | |
| BACTERIA Electors' Group (BACTERIA) | 0 | 0.00 | New | 0 | ±0 | |
| Blank ballots | 200,794 | 1.27 | +0.28 | |||
| Total | 15,858,470 | 60 | ±0 | |||
| Valid votes | 15,858,470 | 98.98 | +0.17 | |||
| Invalid votes | 163,806 | 1.02 | –0.17 | |||
| Votes cast / turnout | 16,022,276 | 54.71 | –13.81 | |||
| Abstentions | 13,261,706 | 45.29 | +13.81 | |||
| Registered voters | 29,283,982 | |||||
| Sources[5][6] | ||||||
Autonomous communities
Andalusia
| Parties and coalitions | Popular vote | |||
|---|---|---|---|---|
| Votes | % | ±pp | ||
| Spanish Socialist Workers' Party (PSOE) | 1,288,676 | 50.26 | +1.99 | |
| People's Party (PP)1 | 412,621 | 16.09 | –5.67 | |
| Andalusian Party (PA) | 267,790 | 10.44 | +4.84 | |
| United Left–Assembly for Andalusia (IU–CA) | 232,023 | 9.05 | –1.76 | |
| Ruiz-Mateos Group (Ruiz-Mateos)2 | 105,060 | 4.10 | +3.04 | |
| Democratic and Social Centre (CDS) | 103,982 | 4.06 | –3.16 | |
| Workers' Party of Spain–Communist Unity (PTE–UC) | 33,548 | 1.31 | –0.06 | |
| Green List (Adhered to the European Greens) (LV)3 | 19,607 | 0.76 | +0.27 | |
| The Ecologist Greens (LVE) | 14,106 | 0.55 | New | |
| Communist Party of the Peoples of Spain–PCC (PCPE–PCC) | 10,196 | 0.40 | New | |
| National Front (FN) | 7,764 | 0.30 | –0.24 | |
| Spanish Vertex Ecological Development Revindication (VERDE) | 5,950 | 0.23 | New | |
| Left of the Peoples (IP)4 | 5,632 | 0.22 | –0.03 | |
| Workers' Socialist Party–Revolutionary Workers' Party (PST–PORE)5 | 4,997 | 0.19 | –0.34 | |
| Social Democratic Coalition (CSD) | 4,864 | 0.19 | +0.09 | |
| Popular Unity (HB) | 4,655 | 0.18 | –0.14 | |
| Europe for Life (EPV) | 4,536 | 0.19 | New | |
| Spanish Phalanx of the CNSO (FE–JONS) | 2,956 | 0.12 | +0.02 | |
| Andalusian Liberation (LA) | 2,315 | 0.09 | –0.02 | |
| Alliance for the Republic (AxR)6 | 1,937 | 0.08 | –0.03 | |
| Humanist Party (PH) | 1,803 | 0.07 | ±0.00 | |
| Nationalist Coalition (CN)7 | 1,687 | 0.07 | –0.03 | |
| Federation of Regional Parties (FPR)8 | 1,472 | 0.06 | –0.05 | |
| Green Alternative–Ecologist Movement of Catalonia (AV–MEC) | 1,469 | 0.06 | New | |
| Convergence and Union (CiU) | 1,247 | 0.05 | +0.01 | |
| Centrist Unity–Democratic Spanish Party (PED) | 1,084 | 0.04 | +0.01 | |
| Initiative for a European Democracy (IDE) | 1,075 | 0.04 | New | |
| For the Europe of the Peoples (PEP)9 | 1,020 | 0.04 | –0.01 | |
| Asturian Nationalist Unity (UNA) | 996 | 0.04 | New | |
| Galician Nationalist Bloc (BNG) | 898 | 0.04 | +0.01 | |
| Carlist Party (PC) | 762 | 0.03 | New | |
| BACTERIA Electors' Group (BACTERIA) | 0 | 0.00 | New | |
| Blank ballots | 17,157 | 0.67 | +0.02 | |
| Total | 2,563,885 | |||
| Valid votes | 2,563,885 | 99.20 | +0.40 | |
| Invalid votes | 20,680 | 0.80 | –0.40 | |
| Votes cast / turnout | 2,584,565 | 52.75 | –13.05 | |
| Abstentions | 2,315,072 | 47.25 | +13.05 | |
| Registered voters | 4,899,637 | |||
| Sources[6][7] | ||||
Aragon
| Parties and coalitions | Popular vote | |||
|---|---|---|---|---|
| Votes | % | ±pp | ||
| Spanish Socialist Workers' Party (PSOE) | 209,358 | 41.64 | +3.24 | |
| People's Party (PP)1 | 133,858 | 26.62 | +1.28 | |
| Democratic and Social Centre (CDS) | 39,269 | 7.81 | –3.56 | |
| United Left (IU) | 31,716 | 6.31 | +2.90 | |
| Ruiz-Mateos Group (Ruiz-Mateos)2 | 27,763 | 5.52 | +5.09 | |
| Workers' Party of Spain–Communist Unity (PTE–UC) | 9,901 | 1.97 | +0.63 | |
| Aragonese Union (Left of the Peoples) (UA–CHA) | 8,563 | 1.70 | New | |
| Green List (Adhered to the European Greens) (LV)3 | 5,219 | 1.04 | +0.41 | |
| The Ecologist Greens (LVE) | 5,135 | 1.02 | New | |
| Spanish Vertex Ecological Development Revindication (VERDE) | 2,423 | 0.48 | New | |
| National Front (FN) | 2,415 | 0.48 | –0.19 | |
| Social Democratic Coalition (CSD) | 2,107 | 0.42 | +0.29 | |
| Federation of Regional Parties (FPR)4 | 1,915 | 0.38 | +0.31 | |
| Popular Unity (HB) | 1,880 | 0.37 | –0.19 | |
| Workers' Socialist Party–Revolutionary Workers' Party (PST–PORE)5 | 1,547 | 0.31 | –0.18 | |
| Communist Party of the Peoples of Spain–PCC (PCPE–PCC) | 1,202 | 0.24 | New | |
| Europe for Life (EPV) | 1,045 | 0.21 | New | |
| Humanist Party (PH) | 835 | 0.17 | +0.01 | |
| Spanish Phalanx of the CNSO (FE–JONS) | 830 | 0.17 | +0.07 | |
| Convergence and Union (CiU) | 716 | 0.14 | +0.04 | |
| Alliance for the Republic (AxR)6 | 635 | 0.13 | ±0.00 | |
| Andalusian Party (PA) | 561 | 0.11 | +0.07 | |
| For the Europe of the Peoples (PEP)7 | 494 | 0.10 | ±0.00 | |
| Green Alternative–Ecologist Movement of Catalonia (AV–MEC) | 405 | 0.08 | New | |
| Centrist Unity–Democratic Spanish Party (PED) | 393 | 0.08 | +0.04 | |
| Carlist Party (PC) | 391 | 0.08 | New | |
| Nationalist Coalition (CN)8 | 334 | 0.07 | –0.04 | |
| Initiative for a European Democracy (IDE) | 303 | 0.06 | New | |
| Asturian Nationalist Unity (UNA) | 252 | 0.05 | New | |
| Andalusian Liberation (LA) | 223 | 0.04 | +0.02 | |
| Galician Nationalist Bloc (BNG) | 192 | 0.04 | +0.01 | |
| BACTERIA Electors' Group (BACTERIA) | 0 | 0.00 | New | |
| Blank ballots | 10,931 | 2.17 | +0.85 | |
| Total | 502,811 | |||
| Valid votes | 502,811 | 98.67 | –0.05 | |
| Invalid votes | 6,761 | 1.33 | +0.05 | |
| Votes cast / turnout | 509,572 | 54.26 | –15.42 | |
| Abstentions | 429,548 | 45.74 | +15.42 | |
| Registered voters | 939,120 | |||
| Sources[6][8] | ||||
Asturias
| Parties and coalitions | Popular vote | |||
|---|---|---|---|---|
| Votes | % | ±pp | ||
| Spanish Socialist Workers' Party (PSOE) | 197,650 | 41.48 | –0.95 | |
| People's Party (PP)1 | 107,443 | 22.55 | –3.89 | |
| United Left (IU) | 55,779 | 11.71 | +1.90 | |
| Democratic and Social Centre (CDS) | 53,890 | 11.31 | –3.18 | |
| Ruiz-Mateos Group (Ruiz-Mateos)2 | 14,992 | 3.15 | +2.72 | |
| Workers' Party of Spain–Communist Unity (PTE–UC) | 6,545 | 1.37 | +0.25 | |
| Asturianist Party (Left of the Peoples) (PAS) | 5,430 | 1.14 | New | |
| Asturian Nationalist Unity (UNA) | 4,645 | 0.97 | New | |
| Green List (Adhered to the European Greens) (LV)3 | 4,389 | 0.92 | +0.33 | |
| The Ecologist Greens (LVE) | 3,831 | 0.80 | New | |
| Popular Unity (HB) | 2,631 | 0.55 | –0.43 | |
| Communist Party of the Peoples of Spain–PCC (PCPE–PCC) | 2,426 | 0.51 | New | |
| Social Democratic Coalition (CSD) | 1,990 | 0.42 | +0.27 | |
| Spanish Vertex Ecological Development Revindication (VERDE) | 1,562 | 0.33 | New | |
| National Front (FN) | 1,333 | 0.28 | –0.22 | |
| Workers' Socialist Party–Revolutionary Workers' Party (PST–PORE)4 | 1,224 | 0.26 | –0.23 | |
| Spanish Phalanx of the CNSO (FE–JONS) | 674 | 0.14 | +0.02 | |
| Europe for Life (EPV) | 561 | 0.12 | New | |
| Humanist Party (PH) | 486 | 0.10 | –0.01 | |
| Alliance for the Republic (AxR)6 | 371 | 0.08 | ±0.00 | |
| Federation of Regional Parties (FPR)5 | 322 | 0.07 | +0.01 | |
| Green Alternative–Ecologist Movement of Catalonia (AV–MEC) | 280 | 0.06 | New | |
| Centrist Unity–Democratic Spanish Party (PED) | 254 | 0.05 | +0.02 | |
| For the Europe of the Peoples (PEP)7 | 239 | 0.05 | –0.05 | |
| Nationalist Coalition (CN)8 | 225 | 0.05 | –0.06 | |
| Convergence and Union (CiU) | 224 | 0.05 | +0.01 | |
| Galician Nationalist Bloc (BNG) | 204 | 0.04 | +0.01 | |
| Andalusian Party (PA) | 202 | 0.04 | +0.01 | |
| Initiative for a European Democracy (IDE) | 199 | 0.04 | New | |
| Carlist Party (PC) | 176 | 0.04 | New | |
| Andalusian Liberation (LA) | 99 | 0.02 | –0.02 | |
| BACTERIA Electors' Group (BACTERIA) | 0 | 0.00 | New | |
| Blank ballots | 6,083 | 1.28 | +0.32 | |
| Total | 476,470 | |||
| Valid votes | 476,470 | 98.67 | +0.01 | |
| Invalid votes | 6,404 | 1.33 | –0.01 | |
| Votes cast / turnout | 482,874 | 54.36 | –12.40 | |
| Abstentions | 405,469 | 45.64 | +12.40 | |
| Registered voters | 888,343 | |||
| Sources[6][9] | ||||
Balearics
| Parties and coalitions | Popular vote | |||
|---|---|---|---|---|
| Votes | % | ±pp | ||
| Spanish Socialist Workers' Party (PSOE) | 84,465 | 35.58 | +1.38 | |
| People's Party (PP)1 | 78,052 | 32.88 | –4.64 | |
| Democratic and Social Centre (CDS) | 19,384 | 8.17 | –3.72 | |
| Ruiz-Mateos Group (Ruiz-Mateos)2 | 13,620 | 5.74 | +4.97 | |
| Socialist Party of Majorca (Left of the Peoples) (PSM) | 9,923 | 4.18 | +1.23 | |
| United Left (IU) | 8,205 | 3.46 | +1.25 | |
| The Ecologist Greens (LVE) | 2,766 | 1.17 | New | |
| Green List (Adhered to the European Greens) (LV)3 | 2,764 | 1.16 | +0.48 | |
| Workers' Party of Spain–Communist Unity (PTE–UC) | 1,602 | 0.67 | +0.34 | |
| Communist Party of the Peoples of Spain–PCC (PCPE–PCC) | 1,519 | 0.51 | New | |
| Social Democratic Coalition (CSD) | 1,245 | 0.52 | +0.39 | |
| Spanish Vertex Ecological Development Revindication (VERDE) | 1,245 | 0.52 | New | |
| Convergence and Union (CiU) | 1,174 | 0.49 | +0.17 | |
| Andalusian Party (PA) | 922 | 0.39 | +0.30 | |
| Popular Unity (HB) | 869 | 0.37 | –0.07 | |
| Green Alternative–Ecologist Movement of Catalonia (AV–MEC) | 851 | 0.36 | New | |
| Free Catalonia (CLL) | 666 | 0.28 | New | |
| Workers' Socialist Party–Revolutionary Workers' Party (PST–PORE)4 | 583 | 0.25 | –0.11 | |
| National Front (FN) | 536 | 0.23 | ±0.00 | |
| Spanish Phalanx of the CNSO (FE–JONS) | 477 | 0.20 | +0.11 | |
| For the Europe of the Peoples (PEP) | 458 | 0.19 | New | |
| Europe for Life (EPV) | 375 | 0.16 | New | |
| Alliance for the Republic (AxR)5 | 343 | 0.14 | +0.03 | |
| Humanist Party (PH) | 274 | 0.12 | +0.07 | |
| Federation of Regional Parties (FPR)6 | 215 | 0.09 | –0.02 | |
| Centrist Unity–Democratic Spanish Party (PED) | 205 | 0.09 | +0.04 | |
| Nationalist Coalition (CN)7 | 199 | 0.08 | –0.05 | |
| Andalusian Liberation (LA) | 187 | 0.08 | +0.04 | |
| Initiative for a European Democracy (IDE) | 170 | 0.07 | New | |
| Asturian Nationalist Unity (UNA) | 169 | 0.07 | New | |
| Carlist Party (PC) | 164 | 0.07 | New | |
| Galician Nationalist Bloc (BNG) | 147 | 0.06 | +0.02 | |
| BACTERIA Electors' Group (BACTERIA) | 0 | 0.00 | New | |
| Blank ballots | 3,594 | 1.51 | +0.38 | |
| Total | 237,368 | |||
| Valid votes | 237,368 | 98.81 | +0.16 | |
| Invalid votes | 2,858 | 1.19 | –0.16 | |
| Votes cast / turnout | 240,226 | 44.74 | –22.02 | |
| Abstentions | 296,711 | 55.26 | +22.02 | |
| Registered voters | 536,937 | |||
| Sources[6][10] | ||||
Basque Country
| Parties and coalitions | Popular vote | |||
|---|---|---|---|---|
| Votes | % | ±pp | ||
| Basque Nationalist Party (Nationalist Coalition) (EAJ/PNV) | 201,809 | 20.95 | +1.56 | |
| Popular Unity (HB) | 184,362 | 19.14 | –0.46 | |
| Socialist Party of the Basque Country (PSE–PSOE) | 175,776 | 18.25 | –0.80 | |
| Basque Solidarity (Europe of the Peoples) (EA) | 125,227 | 13.00 | –3.06 | |
| Basque Country Left (Left of the Peoples) (EE) | 94,733 | 9.84 | +0.12 | |
| People's Party (PP)1 | 73,254 | 7.61 | +0.25 | |
| Democratic and Social Centre (CDS) | 26,241 | 2.72 | –1.16 | |
| United Left (IU–EB) | 17,017 | 1.77 | +0.79 | |
| Ruiz-Mateos Group (Ruiz-Mateos)2 | 13,798 | 1.43 | +1.31 | |
| Workers' Party of Spain–Communist Unity (PTE–UC) | 9,114 | 0.95 | +0.17 | |
| The Ecologist Greens (LVE) | 8,011 | 0.83 | New | |
| Green List (Adhered to the European Greens) (LB)3 | 5,262 | 0.55 | +0.11 | |
| Social Democratic Coalition (CSD) | 2,702 | 0.28 | +0.19 | |
| Europe for Life (EPV) | 2,478 | 0.26 | New | |
| Communist Party of the Peoples of Spain–PCC (PCPE–PCC) | 1,914 | 0.20 | New | |
| Workers' Socialist Party–Revolutionary Workers' Party (PST–PORE)4 | 1,727 | 0.18 | –0.21 | |
| National Front (FN) | 1,368 | 0.14 | –0.07 | |
| Green Alternative–Ecologist Movement of Catalonia (AV–MEC) | 1,276 | 0.13 | New | |
| Humanist Party (PH) | 1,032 | 0.11 | +0.04 | |
| Carlist Party (PC) | 684 | 0.07 | New | |
| Alliance for the Republic (AxR)5 | 645 | 0.07 | –0.02 | |
| Spanish Phalanx of the CNSO (FE–JONS) | 618 | 0.06 | +0.01 | |
| Andalusian Party (PA) | 588 | 0.06 | +0.01 | |
| Federation of Regional Parties (FPR)6 | 544 | 0.06 | –0.07 | |
| Galician Nationalist Bloc (BNG) | 539 | 0.06 | +0.01 | |
| Convergence and Union (CiU) | 444 | 0.05 | +0.02 | |
| Centrist Unity–Democratic Spanish Party (PED) | 444 | 0.05 | +0.02 | |
| Andalusian Liberation (LA) | 364 | 0.04 | +0.02 | |
| Asturian Nationalist Unity (UNA) | 361 | 0.04 | New | |
| Initiative for a European Democracy (IDE) | 353 | 0.04 | New | |
| BACTERIA Electors' Group (BACTERIA) | 0 | 0.00 | New | |
| Blank ballots | 10,494 | 1.09 | +0.14 | |
| Total | 963,179 | |||
| Valid votes | 963,179 | 99.14 | +0.14 | |
| Invalid votes | 8,376 | 0.86 | –0.14 | |
| Votes cast / turnout | 971,555 | 58.49 | –8.80 | |
| Abstentions | 689,518 | 41.51 | +8.80 | |
| Registered voters | 1,661,073 | |||
| Sources[6][11] | ||||
Canary Islands
| Parties and coalitions | Popular vote | |||
|---|---|---|---|---|
| Votes | % | ±pp | ||
| Spanish Socialist Workers' Party (PSOE) | 181,332 | 34.89 | +2.19 | |
| People's Party (PP)1 | 86,480 | 16.64 | –3.26 | |
| Democratic and Social Centre (CDS) | 83,942 | 16.15 | –4.35 | |
| Canarian Independent Groups (Nationalist Coalition) (AIC) | 57,932 | 11.15 | –3.39 | |
| United Left–United Canarian Left (IU–ICU) | 27,490 | 5.29 | +0.83 | |
| Ruiz-Mateos Group (Ruiz-Mateos)2 | 23,476 | 4.52 | +3.74 | |
| Nationalist Canarian Assembly (Left of the Peoples) (ACN) | 16,553 | 3.19 | New | |
| The Ecologist Greens (LVE) | 4,959 | 0.95 | New | |
| Green List (Adhered to the European Greens) (LV)3 | 4,643 | 0.89 | –0.25 | |
| Social Democratic Coalition (CSD) | 3,410 | 0.66 | +0.44 | |
| Workers' Party of Spain–Communist Unity (PTE–UC) | 3,153 | 0.61 | +0.12 | |
| Popular Unity (HB) | 2,715 | 0.52 | –0.18 | |
| Communist Party of the Peoples of Spain–PCC (PCPE–PCC) | 2,361 | 0.45 | New | |
| Spanish Vertex Ecological Development Revindication (VERDE) | 2,146 | 0.41 | New | |
| Workers' Socialist Party–Revolutionary Workers' Party (PST–PORE)4 | 2,108 | 0.41 | –0.14 | |
| Europe for Life (EPV) | 1,096 | 0.21 | New | |
| National Front (FN) | 1,004 | 0.19 | –0.04 | |
| Humanist Party (PH) | 966 | 0.19 | +0.07 | |
| Alliance for the Republic (AxR)5 | 898 | 0.17 | +0.04 | |
| Green Alternative–Ecologist Movement of Catalonia (AV–MEC) | 804 | 0.15 | New | |
| Centrist Unity–Democratic Spanish Party (PED) | 788 | 0.15 | +0.08 | |
| Spanish Phalanx of the CNSO (FE–JONS) | 787 | 0.15 | +0.07 | |
| Andalusian Party (PA) | 743 | 0.14 | +0.01 | |
| Convergence and Union (CiU) | 706 | 0.14 | +0.06 | |
| Federation of Regional Parties (FPR)6 | 662 | 0.13 | ±0.00 | |
| For the Europe of the Peoples (PEP) | 644 | 0.12 | New | |
| Asturian Nationalist Unity (UNA) | 627 | 0.12 | New | |
| Initiative for a European Democracy (IDE) | 579 | 0.11 | New | |
| Galician Nationalist Bloc (BNG) | 554 | 0.11 | +0.05 | |
| Andalusian Liberation (LA) | 456 | 0.09 | +0.05 | |
| Carlist Party (PC) | 435 | 0.08 | New | |
| BACTERIA Electors' Group (BACTERIA) | 0 | 0.00 | New | |
| Blank ballots | 5,226 | 1.01 | –0.11 | |
| Total | 519,675 | |||
| Valid votes | 519,675 | 98.99 | +0.26 | |
| Invalid votes | 5,312 | 1.01 | –0.26 | |
| Votes cast / turnout | 524,987 | 49.49 | –12.33 | |
| Abstentions | 535,813 | 50.51 | +12.33 | |
| Registered voters | 1,060,800 | |||
| Sources[6][12] | ||||
Cantabria
| Parties and coalitions | Popular vote | |||
|---|---|---|---|---|
| Votes | % | ±pp | ||
| Spanish Socialist Workers' Party (PSOE) | 97,044 | 40.29 | +4.01 | |
| People's Party (PP)1 | 77,056 | 31.99 | –5.76 | |
| Democratic and Social Centre (CDS) | 16,847 | 6.99 | –2.95 | |
| Ruiz-Mateos Group (Ruiz-Mateos)2 | 10,465 | 4.34 | +3.64 | |
| United Left (IU) | 10,074 | 4.18 | +0.83 | |
| Regionalist Party of Cantabria (Federation of Regional Parties) (FPR) | 6,141 | 2.55 | –2.36 | |
| Workers' Party of Spain–Communist Unity (PTE–UC) | 3,157 | 1.31 | +0.27 | |
| Green List (Adhered to the European Greens) (LV)3 | 2,198 | 0.91 | +0.40 | |
| The Ecologist Greens (LVE) | 1,949 | 0.81 | New | |
| Left of the Peoples (IP)4 | 1,864 | 0.77 | –0.28 | |
| National Front (FN) | 1,631 | 0.68 | –0.51 | |
| Popular Unity (HB) | 1,324 | 0.55 | –0.14 | |
| Communist Party of the Peoples of Spain–PCC (PCPE–PCC) | 1,092 | 0.45 | New | |
| Social Democratic Coalition (CSD) | 947 | 0.39 | +0.27 | |
| Spanish Phalanx of the CNSO (FE–JONS) | 844 | 0.35 | +0.10 | |
| Spanish Vertex Ecological Development Revindication (VERDE) | 729 | 0.30 | New | |
| Workers' Socialist Party–Revolutionary Workers' Party (PST–PORE)5 | 682 | 0.28 | –0.23 | |
| Humanist Party (PH) | 397 | 0.16 | +0.02 | |
| Alliance for the Republic (AxR)6 | 323 | 0.13 | –0.05 | |
| Europe for Life (EPV) | 302 | 0.13 | New | |
| Centrist Unity–Democratic Spanish Party (PED) | 249 | 0.10 | +0.06 | |
| Nationalist Coalition (CN)7 | 211 | 0.09 | –0.07 | |
| For the Europe of the Peoples (PEP)8 | 184 | 0.08 | –0.01 | |
| Andalusian Party (PA) | 181 | 0.08 | +0.05 | |
| Initiative for a European Democracy (IDE) | 177 | 0.07 | New | |
| Green Alternative–Ecologist Movement of Catalonia (AV–MEC) | 170 | 0.07 | New | |
| Convergence and Union (CiU) | 151 | 0.06 | +0.02 | |
| Asturian Nationalist Unity (UNA) | 121 | 0.05 | New | |
| Galician Nationalist Bloc (BNG) | 111 | 0.05 | +0.02 | |
| Andalusian Liberation (LA) | 110 | 0.05 | +0.04 | |
| Carlist Party (PC) | 97 | 0.04 | New | |
| BACTERIA Electors' Group (BACTERIA) | 0 | 0.00 | New | |
| Blank ballots | 4,040 | 1.68 | +0.51 | |
| Total | 240,868 | |||
| Valid votes | 240,868 | 98.77 | +0.02 | |
| Invalid votes | 2,995 | 1.23 | –0.02 | |
| Votes cast / turnout | 243,863 | 60.53 | –15.47 | |
| Abstentions | 159,028 | 39.47 | +15.47 | |
| Registered voters | 402,891 | |||
| Sources[6][13] | ||||
Castile and León
| Parties and coalitions | Popular vote | |||
|---|---|---|---|---|
| Votes | % | ±pp | ||
| Spanish Socialist Workers' Party (PSOE) | 419,922 | 36.45 | +1.34 | |
| People's Party (PP)1 | 372,451 | 32.33 | –5.54 | |
| Democratic and Social Centre (CDS) | 151,902 | 13.18 | –4.17 | |
| Ruiz-Mateos Group (Ruiz-Mateos)2 | 46,298 | 4.02 | +3.57 | |
| United Left (IU) | 46,258 | 4.01 | +1.49 | |
| Workers' Party of Spain–Communist Unity (PTE–UC) | 14,860 | 1.29 | +0.29 | |
| Green List (Adhered to the European Greens) (LV)3 | 11,841 | 1.03 | +0.19 | |
| The Ecologist Greens (LVE) | 11,462 | 0.99 | New | |
| Left of the Peoples (IP)4 | 7,431 | 0.64 | +0.34 | |
| Social Democratic Coalition (CSD) | 6,036 | 0.52 | +0.36 | |
| National Front (FN) | 5,471 | 0.47 | –0.19 | |
| Nationalist Party of Castile and León (Nationalist Coalition) (PANCAL) | 5,081 | 0.44 | +0.13 | |
| Spanish Vertex Ecological Development Revindication (VERDE) | 4,459 | 0.39 | New | |
| Workers' Socialist Party–Revolutionary Workers' Party (PST–PORE)5 | 3,203 | 0.28 | –0.13 | |
| Popular Unity (HB) | 3,201 | 0.28 | –0.05 | |
| Communist Party of the Peoples of Spain–PCC (PCPE–PCC) | 3,176 | 0.28 | New | |
| Spanish Phalanx of the CNSO (FE–JONS) | 2,334 | 0.20 | +0.06 | |
| Europe for Life (EPV) | 2,325 | 0.20 | New | |
| Alliance for the Republic (AxR)6 | 1,867 | 0.16 | +0.05 | |
| Federation of Regional Parties (FPR)7 | 1,600 | 0.14 | ±0.00 | |
| Humanist Party (PH) | 1,557 | 0.14 | +0.03 | |
| Centrist Unity–Democratic Spanish Party (PED) | 1,180 | 0.10 | +0.05 | |
| For the Europe of the Peoples (PEP)8 | 1,014 | 0.09 | +0.01 | |
| Green Alternative–Ecologist Movement of Catalonia (AV–MEC) | 1,000 | 0.09 | New | |
| Andalusian Party (PA) | 905 | 0.08 | +0.05 | |
| Convergence and Union (CiU) | 846 | 0.07 | +0.03 | |
| Initiative for a European Democracy (IDE) | 837 | 0.07 | New | |
| Asturian Nationalist Unity (UNA) | 820 | 0.07 | New | |
| Galician Nationalist Bloc (BNG) | 697 | 0.06 | +0.02 | |
| Carlist Party (PC) | 581 | 0.05 | New | |
| Andalusian Liberation (LA) | 512 | 0.04 | +0.03 | |
| BACTERIA Electors' Group (BACTERIA) | 0 | 0.00 | New | |
| Blank ballots | 21,071 | 1.83 | +0.39 | |
| Total | 1,152,198 | |||
| Valid votes | 1,152,198 | 98.45 | +0.14 | |
| Invalid votes | 18,135 | 1.55 | –0.14 | |
| Votes cast / turnout | 1,170,333 | 57.54 | –15.53 | |
| Abstentions | 863,458 | 42.46 | +15.53 | |
| Registered voters | 2,033,791 | |||
| Sources[6][14] | ||||
Castilla–La Mancha
| Parties and coalitions | Popular vote | |||
|---|---|---|---|---|
| Votes | % | ±pp | ||
| Spanish Socialist Workers' Party (PSOE) | 364,506 | 48.28 | +3.62 | |
| People's Party (PP)1 | 220,591 | 29.22 | –5.87 | |
| Democratic and Social Centre (CDS) | 55,679 | 7.37 | –2.84 | |
| United Left (IU) | 40,712 | 5.39 | +0.84 | |
| Ruiz-Mateos Group (Ruiz-Mateos)2 | 22,643 | 3.00 | +2.68 | |
| National Front (FN) | 5,905 | 0.78 | –0.72 | |
| Workers' Party of Spain–Communist Unity (PTE–UC) | 5,427 | 0.72 | +0.17 | |
| The Ecologist Greens (LVE) | 4,677 | 0.62 | New | |
| Green List (Adhered to the European Greens) (LV)3 | 4,463 | 0.59 | +0.06 | |
| Left of the Peoples (IP)4 | 2,836 | 0.38 | +0.34 | |
| Social Democratic Coalition (CSD) | 2,466 | 0.33 | +0.26 | |
| Communist Party of the Peoples of Spain–PCC (PCPE–PCC) | 2,450 | 0.32 | New | |
| Spanish Vertex Ecological Development Revindication (VERDE) | 2,015 | 0.27 | New | |
| Spanish Phalanx of the CNSO (FE–JONS) | 1,978 | 0.26 | +0.07 | |
| Workers' Socialist Party–Revolutionary Workers' Party (PST–PORE)5 | 1,617 | 0.21 | –0.19 | |
| Popular Unity (HB) | 1,024 | 0.14 | –0.02 | |
| Europe for Life (EPV) | 994 | 0.13 | New | |
| Federation of Regional Parties (FPR)6 | 972 | 0.13 | +0.06 | |
| Alliance for the Republic (AxR)7 | 832 | 0.11 | +0.03 | |
| Humanist Party (PH) | 754 | 0.10 | +0.01 | |
| Andalusian Party (PA) | 590 | 0.08 | +0.05 | |
| Convergence and Union (CiU) | 490 | 0.06 | +0.03 | |
| Centrist Unity–Democratic Spanish Party (PED) | 481 | 0.06 | +0.03 | |
| Green Alternative–Ecologist Movement of Catalonia (AV–MEC) | 452 | 0.06 | New | |
| Nationalist Coalition (CN)8 | 399 | 0.05 | –0.02 | |
| For the Europe of the Peoples (PEP)9 | 392 | 0.05 | +0.02 | |
| Initiative for a European Democracy (IDE) | 381 | 0.05 | New | |
| Andalusian Liberation (LA) | 333 | 0.04 | +0.02 | |
| Asturian Nationalist Unity (UNA) | 324 | 0.04 | New | |
| Galician Nationalist Bloc (BNG) | 320 | 0.04 | +0.02 | |
| Carlist Party (PC) | 298 | 0.04 | New | |
| BACTERIA Electors' Group (BACTERIA) | 0 | 0.00 | New | |
| Blank ballots | 8,022 | 1.06 | +0.09 | |
| Total | 755,023 | |||
| Valid votes | 755,023 | 98.90 | +0.08 | |
| Invalid votes | 8,388 | 1.10 | –0.08 | |
| Votes cast / turnout | 763,411 | 59.78 | –15.47 | |
| Abstentions | 513,624 | 40.22 | +15.47 | |
| Registered voters | 1,277,035 | |||
| Sources[6][15] | ||||
Catalonia
| Parties and coalitions | Popular vote | |||
|---|---|---|---|---|
| Votes | % | ±pp | ||
| Socialists' Party of Catalonia (PSC–PSOE) | 865,506 | 36.36 | –0.46 | |
| Convergence and Union (CiU) | 655,339 | 27.53 | –0.29 | |
| People's Party (PP)1 | 204,624 | 8.60 | –2.85 | |
| United Left–Initiative (IU–I) | 131,658 | 5.53 | +0.16 | |
| Democratic and Social Centre (CDS) | 87,119 | 3.66 | –1.98 | |
| Republican Left of Catalonia (For the Europe of the Nations) (ERC) | 78,408 | 3.29 | –0.41 | |
| Ruiz-Mateos Group (Ruiz-Mateos)2 | 68,613 | 2.88 | +2.40 | |
| Green Alternative–Ecologist Movement of Catalonia (AV–MEC) | 34,489 | 1.45 | New | |
| PCPE–Party of the Communists of Catalonia (PCPE–PCC) | 33,948 | 1.43 | New | |
| The Ecologist Greens (LVE) | 30,490 | 1.28 | New | |
| Green List (Adhered to the European Greens) (LLV)3 | 29,009 | 1.22 | –0.32 | |
| Workers' Party of Spain–Communist Unity (PTE–UC) | 18,637 | 0.78 | –0.03 | |
| Free Catalonia (CLl) | 16,885 | 0.71 | New | |
| Agreement of Left Nationalists (Left of the Peoples) (ENE) | 16,032 | 0.67 | –0.15 | |
| Popular Unity (HB) | 15,427 | 0.65 | –0.66 | |
| Spanish Vertex Ecological Development Revindication (VERDE) | 11,200 | 0.47 | New | |
| Andalusian Party (PA) | 10,866 | 0.46 | +0.28 | |
| Workers' Socialist Party–Revolutionary Workers' Party (PST–PORE)4 | 7,113 | 0.30 | –0.56 | |
| National Front (FN) | 6,012 | 0.25 | –0.11 | |
| Social Democratic Coalition (CSD) | 5,912 | 0.25 | +0.09 | |
| Europe for Life (EPV) | 3,208 | 0.13 | New | |
| Humanist Party (PH) | 3,046 | 0.13 | –0.04 | |
| Spanish Phalanx of the CNSO (FE–JONS) | 2,674 | 0.11 | +0.02 | |
| Alliance for the Republic (AxR)5 | 2,345 | 0.10 | –0.14 | |
| Andalusian Liberation (LA) | 1,999 | 0.08 | +0.01 | |
| Centrist Unity–Democratic Spanish Party (PED) | 1,935 | 0.08 | ±0.00 | |
| Nationalist Coalition (CN)6 | 1,553 | 0.07 | –0.17 | |
| Galician Nationalist Bloc (BNG) | 1,504 | 0.06 | –0.01 | |
| Initiative for a European Democracy (IDE) | 1,432 | 0.06 | New | |
| Federation of Regional Parties (FPR)7 | 1,371 | 0.06 | –0.15 | |
| Asturian Nationalist Unity (UNA) | 1,189 | 0.05 | New | |
| Carlist Party (PC) | 1,052 | 0.04 | New | |
| BACTERIA Electors' Group (BACTERIA) | 0 | 0.00 | New | |
| Blank ballots | 29,875 | 1.26 | +0.31 | |
| Total | 2,380,470 | |||
| Valid votes | 2,380,470 | 99.20 | +0.06 | |
| Invalid votes | 19,167 | 0.80 | –0.06 | |
| Votes cast / turnout | 2,399,637 | 51.53 | –16.41 | |
| Abstentions | 2,257,306 | 48.47 | +16.41 | |
| Registered voters | 4,656,943 | |||
| Sources[6][16] | ||||
Extremadura
| Parties and coalitions | Popular vote | |||
|---|---|---|---|---|
| Votes | % | ±pp | ||
| Spanish Socialist Workers' Party (PSOE) | 266,500 | 54.79 | +4.85 | |
| People's Party (PP)1 | 105,886 | 21.77 | –5.03 | |
| Democratic and Social Centre (CDS) | 41,820 | 8.60 | –2.26 | |
| United Left (IU) | 23,798 | 4.89 | +0.18 | |
| Ruiz-Mateos Group (Ruiz-Mateos)2 | 11,975 | 2.46 | +2.21 | |
| United Extremadura (Federation of Regional Parties) (EU) | 11,343 | 2.33 | –1.11 | |
| Workers' Party of Spain–Communist Unity (PTE–UC) | 2,927 | 0.60 | –0.02 | |
| Green List (Adhered to the European Greens) (LV)3 | 2,689 | 0.55 | +0.08 | |
| The Ecologist Greens (LVE) | 2,479 | 0.51 | New | |
| Communist Party of the Peoples of Spain–PCC (PCPE–PCC) | 2,026 | 0.42 | New | |
| Social Democratic Coalition (CSD) | 1,572 | 0.32 | +0.24 | |
| Workers' Socialist Party–Revolutionary Workers' Party (PST–PORE)4 | 1,140 | 0.23 | –0.27 | |
| Left of the Peoples (IP)5 | 1,036 | 0.21 | +0.07 | |
| National Front (FN) | 974 | 0.20 | –0.15 | |
| Spanish Phalanx of the CNSO (FE–JONS) | 963 | 0.20 | +0.03 | |
| Spanish Vertex Ecological Development Revindication (VERDE) | 944 | 0.19 | New | |
| Popular Unity (HB) | 704 | 0.14 | –0.06 | |
| Europe for Life (EPV) | 581 | 0.12 | New | |
| Alliance for the Republic (AxR)6 | 464 | 0.10 | +0.03 | |
| Andalusian Party (PA) | 346 | 0.07 | +0.03 | |
| Humanist Party (PH) | 278 | 0.06 | –0.01 | |
| Green Alternative–Ecologist Movement of Catalonia (AV–MEC) | 275 | 0.06 | New | |
| Convergence and Union (CiU) | 236 | 0.05 | +0.02 | |
| Centrist Unity–Democratic Spanish Party (PED) | 220 | 0.05 | +0.03 | |
| For the Europe of the Peoples (PEP)7 | 213 | 0.04 | ±0.00 | |
| Initiative for a European Democracy (IDE) | 196 | 0.04 | New | |
| Asturian Nationalist Unity (UNA) | 193 | 0.04 | New | |
| Andalusian Liberation (LA) | 170 | 0.03 | +0.02 | |
| Galician Nationalist Bloc (BNG) | 166 | 0.03 | ±0.00 | |
| Carlist Party (PC) | 155 | 0.03 | New | |
| Nationalist Coalition (CN)8 | 153 | 0.03 | –0.03 | |
| BACTERIA Electors' Group (BACTERIA) | 0 | 0.00 | New | |
| Blank ballots | 3,953 | 0.81 | +0.06 | |
| Total | 486,375 | |||
| Valid votes | 486,375 | 99.00 | –0.02 | |
| Invalid votes | 4,917 | 1.00 | +0.02 | |
| Votes cast / turnout | 491,292 | 60.36 | –13.89 | |
| Abstentions | 322,641 | 39.64 | +13.89 | |
| Registered voters | 813,933 | |||
| Sources[6][17] | ||||
Galicia
| Parties and coalitions | Popular vote | |||
|---|---|---|---|---|
| Votes | % | ±pp | ||
| People's Party (PP)1 | 313,124 | 33.48 | –10.07 | |
| Socialists' Party of Galicia (PSdG–PSOE) | 309,019 | 33.05 | +3.44 | |
| Democratic and Social Centre (CDS) | 62,947 | 6.73 | –3.52 | |
| Ruiz-Mateos Group (Ruiz-Mateos)2 | 40,603 | 4.34 | +3.39 | |
| Galician Nationalist Bloc (BNG) | 38,968 | 4.17 | +0.47 | |
| Galician Socialist Party–Galician Left (Left of the Peoples) (PSG–EG) | 31,229 | 3.34 | +0.41 | |
| Galician Coalition (Nationalist Coalition) (CN) | 28,556 | 3.05 | New | |
| United Left (IU) | 18,587 | 1.99 | +0.72 | |
| Galician Nationalist Party–Galicianist Party (Europe of the Peoples) (PNG–PG) | 12,906 | 1.38 | +0.38 | |
| Workers' Party of Spain–Communist Unity (PTE–UC) | 11,794 | 1.26 | +0.20 | |
| Green List (Adhered to the European Greens) (LV(G))3 | 7,867 | 0.84 | +0.29 | |
| The Ecologist Greens (LVE) | 6,835 | 0.73 | New | |
| Social Democratic Coalition (CSD) | 5,213 | 0.56 | +0.32 | |
| Popular Unity (HB) | 4,760 | 0.51 | –0.08 | |
| Workers' Socialist Party–Revolutionary Workers' Party (PST–PORE)4 | 3,342 | 0.36 | –0.50 | |
| Spanish Vertex Ecological Development Revindication (VERDE) | 3,209 | 0.34 | New | |
| Communist Party of the Peoples of Spain–PCC (PCPE–PCC) | 2,991 | 0.32 | New | |
| Europe for Life (EPV) | 2,144 | 0.23 | New | |
| Alliance for the Republic (AxR)5 | 2,034 | 0.22 | –0.03 | |
| National Front (FN) | 1,637 | 0.18 | –0.05 | |
| Humanist Party (PH) | 1,501 | 0.16 | +0.01 | |
| Spanish Phalanx of the CNSO (FE–JONS) | 1,407 | 0.15 | +0.03 | |
| Federation of Regional Parties (FPR)6 | 1,350 | 0.14 | –0.01 | |
| Green Alternative–Ecologist Movement of Catalonia (AV–MEC) | 1,195 | 0.13 | New | |
| Centrist Unity–Democratic Spanish Party (PED) | 1,170 | 0.13 | +0.05 | |
| Convergence and Union (CiU) | 1,103 | 0.12 | +0.04 | |
| Initiative for a European Democracy (IDE) | 990 | 0.11 | New | |
| Andalusian Party (PA) | 872 | 0.09 | +0.04 | |
| Asturian Nationalist Unity (UNA) | 859 | 0.09 | New | |
| Carlist Party (PC) | 791 | 0.08 | New | |
| Andalusian Liberation (LA) | 776 | 0.08 | +0.03 | |
| BACTERIA Electors' Group (BACTERIA) | 0 | 0.00 | New | |
| Blank ballots | 15,363 | 1.64 | +0.46 | |
| Total | 935,142 | |||
| Valid votes | 935,142 | 98.86 | +0.15 | |
| Invalid votes | 10,814 | 1.14 | –0.15 | |
| Votes cast / turnout | 945,956 | 42.74 | –14.38 | |
| Abstentions | 1,267,469 | 57.26 | +14.38 | |
| Registered voters | 2,213,425 | |||
| Sources[6][18] | ||||
La Rioja
| Parties and coalitions | Popular vote | |||
|---|---|---|---|---|
| Votes | % | ±pp | ||
| Spanish Socialist Workers' Party (PSOE) | 45,965 | 38.67 | –1.29 | |
| People's Party (PP)1 | 39,274 | 33.04 | –6.58 | |
| Democratic and Social Centre (CDS) | 9,005 | 7.58 | –2.98 | |
| Ruiz-Mateos Group (Ruiz-Mateos)2 | 5,236 | 4.41 | +3.38 | |
| United Left (IU) | 4,358 | 3.67 | +1.96 | |
| Progressive Riojan Party (Federation of Regional Parties) (PRP) | 2,463 | 2.07 | New | |
| Workers' Party of Spain–Communist Unity (PTE–UC) | 1,533 | 1.29 | +0.31 | |
| Left of the Peoples (IP)3 | 1,469 | 1.24 | +0.72 | |
| Green List (Adhered to the European Greens) (LV)4 | 1,263 | 1.06 | +0.31 | |
| The Ecologist Greens (LVE) | 1,011 | 0.85 | New | |
| Popular Unity (HB) | 733 | 0.62 | –0.12 | |
| Social Democratic Coalition (CSD) | 490 | 0.41 | +0.26 | |
| National Front (FN) | 449 | 0.38 | –0.26 | |
| Spanish Vertex Ecological Development Revindication (VERDE) | 425 | 0.36 | New | |
| Workers' Socialist Party–Revolutionary Workers' Party (PST–PORE)5 | 324 | 0.27 | –0.33 | |
| Communist Party of the Peoples of Spain–PCC (PCPE–PCC) | 301 | 0.25 | New | |
| Europe for Life (EPV) | 231 | 0.19 | New | |
| Alliance for the Republic (AxR)6 | 192 | 0.16 | –0.06 | |
| Spanish Phalanx of the CNSO (FE–JONS) | 176 | 0.15 | +0.04 | |
| Humanist Party (PH) | 142 | 0.12 | +0.06 | |
| For the Europe of the Peoples (PEP)7 | 131 | 0.11 | –0.02 | |
| Convergence and Union (CiU) | 127 | 0.11 | +0.06 | |
| Nationalist Coalition (CN)8 | 125 | 0.11 | –0.06 | |
| Carlist Party (PC) | 102 | 0.09 | New | |
| Green Alternative–Ecologist Movement of Catalonia (AV–MEC) | 96 | 0.08 | New | |
| Andalusian Party (PA) | 90 | 0.08 | +0.05 | |
| Centrist Unity–Democratic Spanish Party (PED) | 77 | 0.06 | +0.02 | |
| Initiative for a European Democracy (IDE) | 59 | 0.05 | New | |
| Galician Nationalist Bloc (BNG) | 58 | 0.05 | +0.02 | |
| Andalusian Liberation (LA) | 47 | 0.04 | +0.02 | |
| Asturian Nationalist Unity (UNA) | 41 | 0.03 | New | |
| BACTERIA Electors' Group (BACTERIA) | 0 | 0.00 | New | |
| Blank ballots | 2,864 | 2.41 | +0.98 | |
| Total | 118,857 | |||
| Valid votes | 118,857 | 98.59 | –0.05 | |
| Invalid votes | 1,703 | 1.41 | +0.05 | |
| Votes cast / turnout | 120,560 | 58.64 | –13.59 | |
| Abstentions | 85,024 | 41.36 | +13.59 | |
| Registered voters | 205,584 | |||
| Sources[6][19] | ||||
Madrid
| Parties and coalitions | Popular vote | |||
|---|---|---|---|---|
| Votes | % | ±pp | ||
| Spanish Socialist Workers' Party (PSOE) | 751,937 | 35.47 | –4.91 | |
| People's Party (PP)1 | 593,239 | 27.98 | –2.89 | |
| Democratic and Social Centre (CDS) | 197,681 | 9.32 | –4.68 | |
| United Left (IU) | 178,868 | 8.44 | +3.29 | |
| Ruiz-Mateos Group (Ruiz-Mateos)2 | 129,002 | 6.09 | +5.46 | |
| Workers' Party of Spain–Communist Unity (PTE–UC) | 44,821 | 2.11 | –0.10 | |
| Green List (Adhered to the European Greens) (LV)3 | 39,025 | 1.84 | +0.69 | |
| The Ecologist Greens (LVE) | 35,196 | 1.66 | New | |
| Left of the Peoples (IP)4 | 33,172 | 1.56 | +0.71 | |
| National Front (FN) | 14,516 | 0.68 | –0.52 | |
| Spanish Vertex Ecological Development Revindication (VERDE) | 11,054 | 0.52 | New | |
| Popular Unity (HB) | 6,986 | 0.33 | –0.27 | |
| Andalusian Party (PA) | 6,571 | 0.31 | +0.24 | |
| Europe for Life (EPV) | 5,515 | 0.26 | New | |
| Social Democratic Coalition (CSD) | 5,424 | 0.26 | +0.17 | |
| Communist Party of the Peoples of Spain–PCC (PCPE–PCC) | 4,407 | 0.21 | New | |
| Spanish Phalanx of the CNSO (FE–JONS) | 3,900 | 0.18 | +0.01 | |
| Humanist Party (PH) | 3,890 | 0.18 | +0.01 | |
| Workers' Socialist Party–Revolutionary Workers' Party (PST–PORE)5 | 3,629 | 0.17 | –0.22 | |
| Regional Party of Madrid–Federation of Regional Parties (PRM) | 3,538 | 0.17 | New | |
| Alliance for the Republic (AxR)6 | 1,981 | 0.09 | +0.03 | |
| Convergence and Union (CiU) | 1,454 | 0.07 | +0.01 | |
| For the Europe of the Peoples (PEP)7 | 1,441 | 0.07 | –0.02 | |
| Green Alternative–Ecologist Movement of Catalonia (AV–MEC) | 1,406 | 0.07 | New | |
| Nationalist Coalition (CN)8 | 1,383 | 0.07 | –0.10 | |
| Asturian Nationalist Unity (UNA) | 1,018 | 0.05 | New | |
| Initiative for a European Democracy (IDE) | 928 | 0.04 | New | |
| Andalusian Liberation (LA) | 841 | 0.04 | +0.02 | |
| Galician Nationalist Bloc (BNG) | 782 | 0.04 | ±0.00 | |
| Carlist Party (PC) | 636 | 0.03 | New | |
| Centrist Unity–Democratic Spanish Party (PED) | 621 | 0.03 | –0.01 | |
| BACTERIA Electors' Group (BACTERIA) | 0 | 0.00 | New | |
| Blank ballots | 35,129 | 1.66 | +0.59 | |
| Total | 2,119,991 | |||
| Valid votes | 2,119,991 | 98.96 | +0.34 | |
| Invalid votes | 22,345 | 1.04 | –0.34 | |
| Votes cast / turnout | 2,142,336 | 58.48 | –11.45 | |
| Abstentions | 1,521,310 | 41.52 | +11.45 | |
| Registered voters | 3,663,646 | |||
| Sources[6][20] | ||||
Murcia
| Parties and coalitions | Popular vote | |||
|---|---|---|---|---|
| Votes | % | ±pp | ||
| Spanish Socialist Workers' Party (PSOE) | 208,277 | 48.18 | +2.77 | |
| People's Party (PP)1 | 115,595 | 26.74 | –6.28 | |
| Democratic and Social Centre (CDS) | 40,309 | 9.32 | –1.96 | |
| United Left (IU) | 26,089 | 6.03 | +0.46 | |
| Ruiz-Mateos Group (Ruiz-Mateos)2 | 12,668 | 2.93 | +2.41 | |
| Green List (Adhered to the European Greens) (LV)3 | 3,481 | 0.81 | +0.25 | |
| The Ecologist Greens (LVE) | 3,466 | 0.80 | New | |
| Workers' Party of Spain–Communist Unity (PTE–UC) | 2,967 | 0.69 | +0.32 | |
| Communist Party of the Peoples of Spain–PCC (PCPE–PCC) | 2,275 | 0.53 | New | |
| Left of the Peoples (IP)4 | 1,843 | 0.43 | +0.23 | |
| Spanish Vertex Ecological Development Revindication (VERDE) | 1,760 | 0.41 | New | |
| Social Democratic Coalition (CSD) | 1,738 | 0.40 | +0.29 | |
| National Front (FN) | 1,390 | 0.32 | –0.32 | |
| Workers' Socialist Party–Revolutionary Workers' Party (PST–PORE)5 | 947 | 0.22 | –0.10 | |
| Europe for Life (EPV) | 779 | 0.18 | New | |
| Popular Unity (HB) | 710 | 0.16 | –0.10 | |
| Humanist Party (PH) | 634 | 0.15 | +0.04 | |
| Spanish Phalanx of the CNSO (FE–JONS) | 555 | 0.13 | +0.02 | |
| Alliance for the Republic (AxR)6 | 449 | 0.10 | +0.02 | |
| Andalusian Party (PA) | 443 | 0.10 | +0.07 | |
| Federation of Regional Parties (FPR)7 | 362 | 0.08 | –0.01 | |
| Green Alternative–Ecologist Movement of Catalonia (AV–MEC) | 337 | 0.08 | New | |
| Convergence and Union (CiU) | 301 | 0.07 | +0.03 | |
| Centrist Unity–Democratic Spanish Party (PED) | 273 | 0.06 | +0.02 | |
| Initiative for a European Democracy (IDE) | 248 | 0.06 | New | |
| For the Europe of the Peoples (PEP)8 | 217 | 0.05 | ±0.00 | |
| Asturian Nationalist Unity (UNA) | 206 | 0.05 | New | |
| Nationalist Coalition (CN)9 | 203 | 0.05 | –0.03 | |
| Galician Nationalist Bloc (BNG) | 185 | 0.04 | +0.02 | |
| Andalusian Liberation (LA) | 184 | 0.04 | +0.01 | |
| Carlist Party (PC) | 144 | 0.03 | New | |
| BACTERIA Electors' Group (BACTERIA) | 0 | 0.00 | New | |
| Blank ballots | 3,287 | 0.76 | –0.06 | |
| Total | 432,322 | |||
| Valid votes | 432,322 | 99.21 | +0.42 | |
| Invalid votes | 3,421 | 0.79 | –0.42 | |
| Votes cast / turnout | 435,743 | 58.71 | –13.34 | |
| Abstentions | 306,401 | 41.29 | +13.34 | |
| Registered voters | 742,144 | |||
| Sources[6][21] | ||||
Navarre
| Parties and coalitions | Popular vote | |||
|---|---|---|---|---|
| Votes | % | ±pp | ||
| Spanish Socialist Workers' Party (PSOE) | 65,540 | 28.60 | –0.89 | |
| People's Party (PP)1 | 62,212 | 27.15 | –1.48 | |
| Popular Unity (HB) | 31,516 | 13.75 | –0.63 | |
| Basque Solidarity (Europe of the Peoples) (EA) | 14,280 | 6.23 | –0.51 | |
| Democratic and Social Centre (CDS) | 12,351 | 5.39 | –4.38 | |
| Basque Country Left (Left of the Peoples) (EE) | 8,550 | 3.73 | +0.38 | |
| United Left (IU) | 7,184 | 3.14 | +1.78 | |
| Ruiz-Mateos Group (Ruiz-Mateos)2 | 6,732 | 2.94 | +2.60 | |
| Green List (Adhered to the European Greens) (LB)3 | 2,741 | 1.20 | +0.41 | |
| Basque Nationalist Party (Nationalist Coalition) (EAJ/PNV) | 2,410 | 1.05 | +0.14 | |
| The Ecologist Greens (LVE) | 2,267 | 0.99 | New | |
| Europe for Life (EPV) | 1,485 | 0.65 | New | |
| Carlist Party (PC) | 1,226 | 0.54 | New | |
| Workers' Party of Spain–Communist Unity (PTE–UC) | 1,130 | 0.49 | +0.09 | |
| Spanish Vertex Ecological Development Revindication (VERDE) | 929 | 0.41 | New | |
| Social Democratic Coalition (CSD) | 900 | 0.39 | +0.16 | |
| National Front (FN) | 603 | 0.26 | –0.17 | |
| Workers' Socialist Party–Revolutionary Workers' Party (PST–PORE)4 | 556 | 0.24 | –0.26 | |
| Communist Party of the Peoples of Spain–PCC (PCPE–PCC) | 435 | 0.19 | New | |
| Green Alternative–Ecologist Movement of Catalonia (AV–MEC) | 242 | 0.11 | New | |
| Humanist Party (PH) | 240 | 0.10 | +0.03 | |
| Spanish Phalanx of the CNSO (FE–JONS) | 203 | 0.09 | +0.01 | |
| Alliance for the Republic (AxR)5 | 195 | 0.09 | –0.05 | |
| Convergence and Union (CiU) | 177 | 0.08 | +0.02 | |
| Federation of Regional Parties (FPR)6 | 159 | 0.07 | –0.01 | |
| Asturian Nationalist Unity (UNA) | 148 | 0.06 | New | |
| Centrist Unity–Democratic Spanish Party (PED) | 144 | 0.06 | +0.01 | |
| Andalusian Party (PA) | 138 | 0.06 | +0.01 | |
| Initiative for a European Democracy (IDE) | 126 | 0.05 | New | |
| Galician Nationalist Bloc (BNG) | 96 | 0.04 | ±0.00 | |
| Andalusian Liberation (LA) | 89 | 0.04 | +0.01 | |
| BACTERIA Electors' Group (BACTERIA) | 0 | 0.00 | New | |
| Blank ballots | 4,146 | 1.81 | +0.16 | |
| Total | 229,150 | |||
| Valid votes | 229,150 | 98.70 | –0.05 | |
| Invalid votes | 3,008 | 1.30 | +0.05 | |
| Votes cast / turnout | 232,158 | 57.34 | –15.22 | |
| Abstentions | 172,713 | 42.66 | +15.22 | |
| Registered voters | 404,871 | |||
| Sources[6][22] | ||||
Valencian Community
| Parties and coalitions | Popular vote | |||
|---|---|---|---|---|
| Votes | % | ±pp | ||
| Spanish Socialist Workers' Party (PSOE) | 732,602 | 42.67 | +0.59 | |
| People's Party (PP)1 | 390,500 | 22.75 | –2.58 | |
| Democratic and Social Centre (CDS) | 128,508 | 7.49 | –2.97 | |
| Valencian Union (Federation of Regional Parties) (UV) | 116,575 | 6.79 | –0.96 | |
| United Left of the Valencian Country (IU–EU) | 101,425 | 5.91 | +0.96 | |
| Ruiz-Mateos Group (Ruiz-Mateos)2 | 54,227 | 3.16 | +2.66 | |
| Valencian People's Union (Left of the Peoples) (IP) | 43,893 | 2.56 | New | |
| Workers' Party of Spain–Communist Unity (PTE–UC) | 25,880 | 1.51 | –0.02 | |
| The Ecologist Greens (LVE) | 22,924 | 1.34 | New | |
| Green List (Adhered to the European Greens) (LV)3 | 17,743 | 1.03 | –0.36 | |
| Spanish Vertex Ecological Development Revindication (VERDE) | 8,636 | 0.50 | New | |
| National Front (FN) | 7,509 | 0.44 | –0.40 | |
| Communist Party of the Peoples of Spain–PCC (PCPE–PCC) | 7,182 | 0.42 | New | |
| Popular Unity (HB) | 5,566 | 0.32 | –0.29 | |
| Social Democratic Coalition (CSD) | 5,467 | 0.32 | +0.21 | |
| Workers' Socialist Party–Revolutionary Workers' Party (PST–PORE)4 | 3,875 | 0.23 | –0.36 | |
| Spanish Phalanx of the CNSO (FE–JONS) | 2,901 | 0.17 | +0.02 | |
| Andalusian Party (PA) | 2,748 | 0.16 | +0.10 | |
| Europe for Life (EPV) | 2,535 | 0.15 | New | |
| Green Alternative–Ecologist Movement of Catalonia (AV–MEC) | 2,460 | 0.14 | New | |
| Free Catalonia (CLL) | 2,223 | 0.13 | New | |
| Convergence and Union (CiU) | 1,847 | 0.11 | ±0.00 | |
| Alliance for the Republic (AxR)5 | 1,640 | 0.10 | ±0.00 | |
| For the Europe of the Peoples (PEP)6 | 1,626 | 0.09 | –0.05 | |
| Humanist Party (PH) | 1,501 | 0.09 | –0.01 | |
| Asturian Nationalist Unity (UNA) | 1,172 | 0.07 | New | |
| Centrist Unity–Democratic Spanish Party (PED) | 862 | 0.05 | +0.01 | |
| Carlist Party (PC) | 759 | 0.04 | New | |
| Nationalist Coalition (CN)7 | 756 | 0.04 | –0.11 | |
| Initiative for a European Democracy (IDE) | 736 | 0.04 | New | |
| Andalusian Liberation (LA) | 686 | 0.04 | –0.02 | |
| Galician Nationalist Bloc (BNG) | 619 | 0.04 | ±0.00 | |
| BACTERIA Electors' Group (BACTERIA) | 0 | 0.00 | New | |
| Blank ballots | 19,176 | 1.12 | +0.30 | |
| Total | 1,716,759 | |||
| Valid votes | 1,716,759 | 98.96 | +0.02 | |
| Invalid votes | 18,113 | 1.04 | –0.02 | |
| Votes cast / turnout | 1,734,872 | 61.69 | –12.77 | |
| Abstentions | 1,077,502 | 38.31 | +12.77 | |
| Registered voters | 2,812,374 | |||
| Sources[6][23] | ||||
Autonomous cities
Ceuta
| Parties and coalitions | Popular vote | |||
|---|---|---|---|---|
| Votes | % | ±pp | ||
| Spanish Socialist Workers' Party (PSOE) | 6,196 | 39.91 | –4.95 | |
| People's Party (PP)1 | 5,068 | 32.64 | –0.99 | |
| Democratic and Social Centre (CDS) | 1,423 | 9.17 | –1.71 | |
| Ruiz-Mateos Group (Ruiz-Mateos)2 | 989 | 6.37 | +5.38 | |
| Andalusian Party (PA) | 313 | 2.02 | +1.69 | |
| United Left (IU) | 236 | 1.52 | +0.63 | |
| The Ecologist Greens (LVE) | 196 | 1.26 | New | |
| Green List (Adhered to the European Greens) (LV)3 | 187 | 1.20 | –0.42 | |
| Federation of Regional Parties (FPR)4 | 128 | 0.82 | +0.61 | |
| National Front (FN) | 82 | 0.53 | –0.19 | |
| Social Democratic Coalition (CSD) | 62 | 0.40 | +0.18 | |
| Workers' Socialist Party–Revolutionary Workers' Party (PST–PORE)5 | 55 | 0.35 | –0.03 | |
| Workers' Party of Spain–Communist Unity (PTE–UC) | 49 | 0.32 | –0.03 | |
| Left of the Peoples (IP)6 | 46 | 0.30 | +0.18 | |
| Spanish Phalanx of the CNSO (FE–JONS) | 44 | 0.28 | +0.08 | |
| Communist Party of the Peoples of Spain–PCC (PCPE–PCC) | 33 | 0.21 | New | |
| Europe for Life (EPV) | 30 | 0.19 | New | |
| Green Alternative–Ecologist Movement of Catalonia (AV–MEC) | 28 | 0.18 | New | |
| Alliance for the Republic (AxR)7 | 25 | 0.16 | –0.06 | |
| Popular Unity (HB) | 18 | 0.12 | –0.03 | |
| Asturian Nationalist Unity (UNA) | 16 | 0.10 | New | |
| Andalusian Liberation (LA) | 15 | 0.10 | –0.05 | |
| Carlist Party (PC) | 15 | 0.10 | New | |
| For the Europe of the Peoples (PEP)8 | 10 | 0.06 | –0.02 | |
| Nationalist Coalition (CN)9 | 9 | 0.06 | –0.20 | |
| Humanist Party (PH) | 9 | 0.06 | –0.07 | |
| Galician Nationalist Bloc (BNG) | 8 | 0.05 | ±0.00 | |
| Centrist Unity–Democratic Spanish Party (PED) | 7 | 0.05 | –0.02 | |
| Convergence and Union (CiU) | 7 | 0.05 | –0.07 | |
| BACTERIA Electors' Group (BACTERIA) | 0 | 0.00 | New | |
| Blank ballots | 222 | 1.43 | –0.19 | |
| Total | 15,526 | |||
| Valid votes | 15,526 | 98.52 | +0.38 | |
| Invalid votes | 233 | 1.48 | –0.38 | |
| Votes cast / turnout | 15,759 | 39.77 | –15.27 | |
| Abstentions | 23,868 | 60.23 | +15.27 | |
| Registered voters | 39,627 | |||
| Sources[6][24] | ||||
Melilla
| Parties and coalitions | Popular vote | |||
|---|---|---|---|---|
| Votes | % | ±pp | ||
| Spanish Socialist Workers' Party (PSOE) | 5,281 | 42.21 | –3.66 | |
| People's Party (PP)1 | 3,687 | 29.47 | –6.76 | |
| Democratic and Social Centre (CDS) | 1,130 | 9.03 | +0.64 | |
| Melillan People's Union (Federation of Regional Parties) (FPR) | 703 | 5.62 | New | |
| Ruiz-Mateos Group (Ruiz-Mateos)2 | 400 | 3.20 | +2.85 | |
| United Left (IU) | 265 | 2.12 | +1.14 | |
| Andalusian Party (PA) | 178 | 1.42 | +1.23 | |
| The Ecologist Greens (LVE) | 143 | 1.14 | New | |
| Green List (Adhered to the European Greens) (LV)3 | 133 | 1.06 | +0.52 | |
| National Front (FN) | 73 | 0.58 | +0.06 | |
| Left of the Peoples (IP)4 | 51 | 0.41 | +0.17 | |
| Workers' Party of Spain–Communist Unity (PTE–UC) | 50 | 0.40 | +0.14 | |
| Communist Party of the Peoples of Spain–PCC (PCPE–PCC) | 36 | 0.29 | New | |
| Social Democratic Coalition (CSD) | 32 | 0.26 | +0.20 | |
| Europe for Life (EPV) | 32 | 0.26 | New | |
| Spanish Phalanx of the CNSO (FE–JONS) | 19 | 0.15 | +0.09 | |
| Andalusian Liberation (LA) | 15 | 0.12 | –0.04 | |
| Green Alternative–Ecologist Movement of Catalonia (AV–MEC) | 15 | 0.12 | New | |
| Workers' Socialist Party–Revolutionary Workers' Party (PST–PORE)5 | 14 | 0.11 | –0.28 | |
| Popular Unity (HB) | 13 | 0.10 | –0.04 | |
| Convergence and Union (CiU) | 13 | 0.10 | +0.04 | |
| Nationalist Coalition (CN)6 | 13 | 0.10 | –0.06 | |
| Alliance for the Republic (AxR)7 | 13 | 0.10 | +0.05 | |
| Humanist Party (PH) | 11 | 0.09 | +0.04 | |
| Carlist Party (PC) | 9 | 0.07 | New | |
| Asturian Nationalist Unity (UNA) | 8 | 0.06 | New | |
| For the Europe of the Peoples (PEP)8 | 5 | 0.04 | +0.02 | |
| Centrist Unity–Democratic Spanish Party (PED) | 5 | 0.04 | ±0.00 | |
| Galician Nationalist Bloc (BNG) | 4 | 0.03 | ±0.00 | |
| BACTERIA Electors' Group (BACTERIA) | 0 | 0.00 | New | |
| Blank ballots | 161 | 1.29 | +0.41 | |
| Total | 12,512 | |||
| Valid votes | 12,512 | 98.61 | +0.05 | |
| Invalid votes | 176 | 1.39 | –0.05 | |
| Votes cast / turnout | 12,688 | 39.89 | –22.75 | |
| Abstentions | 19,120 | 60.11 | +22.75 | |
| Registered voters | 31,808 | |||
| Sources[6][25] | ||||
Congress of Deputies projection
A projection of European Parliament election results using electoral rules for the Congress of Deputies would have given the following seat allocation, as distributed per constituencies and regions (note that results are compared with party totals in the preceding general election—held in June 1986—for consistency):[26]
| Parties and coalitions | Popular vote | Seats | ||||
|---|---|---|---|---|---|---|
| Votes | % | ±pp | Total | +/− | ||
| Spanish Socialist Workers' Party (PSOE) | 6,275,552 | 39.57 | –4.49 | 187 | +3 | |
| People's Party (PP)1 | 3,395,015 | 21.41 | –4.56 | 96 | –9 | |
| Democratic and Social Centre (CDS) | 1,133,429 | 7.15 | –2.07 | 13 | –6 | |
| United Left (IU) | 961,742 | 6.06 | +1.43 | 10 | +3 | |
| Convergence and Union (CiU) | 655,339 | 4.13 | –0.89 | 17 | –1 | |
| Ruiz-Mateos Group (Ruiz-Mateos) | 608,560 | 3.84 | New | 2 | +2 | |
| Andalusian Party (PA) | 267,790 | 1.69 | +1.22 | 5 | +5 | |
| Popular Unity (HB) | 215,878 | 1.36 | +0.21 | 6 | +1 | |
| Basque Nationalist Party (EAJ/PNV) | 204,219 | 1.29 | –0.24 | 5 | –1 | |
| Basque Solidarity (EA) | 139,507 | 0.88 | New | 3 | +3 | |
| Valencian Union (UV) | 116,575 | 0.74 | +0.42 | 2 | +1 | |
| Basque Country Left (EE) | 103,283 | 0.65 | +0.12 | 2 | ±0 | |
| Republican Left of Catalonia (ERC) | 78,408 | 0.49 | +0.07 | 1 | +1 | |
| Canarian Independent Groups (AIC) | 57,932 | 0.37 | +0.04 | 1 | ±0 | |
| Galician Coalition (CG) | 28,556 | 0.18 | –0.22 | 0 | –1 | |
| Regionalist Aragonese Party (PAR) | n/a | n/a | –0.36 | 0 | –1 | |
| Others | 1,415,891 | 8.93 | — | 0 | ±0 | |
| Blank ballots | 200,794 | 1.27 | +0.67 | |||
| Total | 15,858,470 | 350 | ±0 | |||
| Sources[27] | ||||||
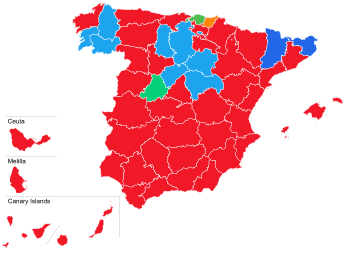
Constituencies

| Constituency | PSOE | PP | CDS | IU | CiU | RMateos | PA | HB | PNV | EA | UV | EE | ERC | AIC | ||||||||||||||
|---|---|---|---|---|---|---|---|---|---|---|---|---|---|---|---|---|---|---|---|---|---|---|---|---|---|---|---|---|
| % | S | % | S | % | S | % | S | % | S | % | S | % | S | % | S | % | S | % | S | % | S | % | S | % | S | % | S | |
| La Coruña | 36.0 | 5 | 29.1 | 4 | 7.1 | − | 2.4 | − | 5.2 | − | ||||||||||||||||||
| Álava | 22.5 | 1 | 12.8 | 1 | 5.2 | − | 1.8 | − | 2.0 | − | 14.0 | 1 | 14.7 | 1 | 10.3 | − | 9.9 | − | ||||||||||
| Albacete | 50.0 | 3 | 25.3 | 1 | 7.5 | − | 7.0 | − | 3.4 | − | ||||||||||||||||||
| Alicante | 45.7 | 6 | 23.8 | 3 | 9.8 | 1 | 5.8 | − | 3.7 | − | 0.7 | − | ||||||||||||||||
| Almería | 52.8 | 4 | 18.2 | 1 | 8.6 | − | 6.1 | − | 3.3 | − | 5.9 | − | ||||||||||||||||
| Asturias | 41.5 | 5 | 22.5 | 2 | 11.3 | 1 | 11.7 | 1 | 3.1 | − | ||||||||||||||||||
| Ávila | 27.9 | 1 | 29.4 | 1 | 30.1 | 1 | 2.6 | − | 2.8 | − | ||||||||||||||||||
| Badajoz | 56.1 | 5 | 20.0 | 1 | 9.3 | − | 6.0 | − | 2.7 | − | ||||||||||||||||||
| Balearics | 35.6 | 3 | 32.9 | 3 | 8.2 | − | 3.5 | − | 5.7 | − | ||||||||||||||||||
| Barcelona | 37.4 | 15 | 8.5 | 3 | 3.7 | 1 | 6.1 | 2 | 25.8 | 10 | 2.9 | − | 3.0 | 1 | ||||||||||||||
| Biscay | 18.1 | 2 | 7.6 | 1 | 2.7 | − | 2.1 | − | 1.7 | − | 17.4 | 2 | 26.3 | 3 | 9.8 | 1 | 9.2 | 1 | ||||||||||
| Burgos | 32.2 | 2 | 35.1 | 2 | 10.8 | − | 4.5 | − | 5.6 | − | ||||||||||||||||||
| Cáceres | 52.6 | 4 | 24.6 | 1 | 7.5 | − | 3.1 | − | 2.1 | − | ||||||||||||||||||
| Cádiz | 46.8 | 6 | 11.5 | 1 | 3.5 | − | 6.0 | − | 6.1 | − | 19.6 | 2 | ||||||||||||||||
| Cantabria | 40.3 | 3 | 32.0 | 2 | 7.0 | − | 4.2 | − | 4.3 | − | ||||||||||||||||||
| Castellón | 43.0 | 3 | 30.2 | 2 | 7.3 | − | 3.4 | − | 3.0 | − | 1.7 | − | ||||||||||||||||
| Ceuta | 39.9 | 1 | 32.6 | − | 9.2 | − | 1.5 | − | 6.4 | − | ||||||||||||||||||
| Ciudad Real | 53.3 | 4 | 25.5 | 1 | 7.5 | − | 4.7 | − | 2.6 | − | ||||||||||||||||||
| Córdoba | 48.4 | 4 | 15.1 | 1 | 4.4 | − | 15.1 | 1 | 3.8 | − | 10.0 | 1 | ||||||||||||||||
| Cuenca | 45.9 | 2 | 34.6 | 1 | 7.0 | − | 3.1 | − | 2.3 | − | ||||||||||||||||||
| Gipuzkoa | 16.9 | 1 | 5.6 | − | 1.9 | − | 1.3 | − | 0.8 | − | 24.1 | 2 | 14.2 | 1 | 19.6 | 2 | 11.0 | 1 | ||||||||||
| Gerona | 29.7 | 2 | 6.6 | − | 3.2 | − | 3.0 | − | 39.4 | 3 | 2.5 | − | 5.0 | − | ||||||||||||||
| Granada | 48.6 | 5 | 19.9 | 2 | 4.8 | − | 7.7 | − | 5.0 | − | 5.9 | − | ||||||||||||||||
| Guadalajara | 37.5 | 1 | 37.8 | 2 | 7.2 | − | 5.6 | − | 3.5 | − | ||||||||||||||||||
| Huelva | 56.3 | 4 | 14.7 | 1 | 3.6 | − | 5.1 | − | 4.8 | − | 9.9 | − | ||||||||||||||||
| Huesca | 44.8 | 2 | 25.4 | 1 | 9.6 | − | 5.3 | − | 4.1 | − | ||||||||||||||||||
| Jaén | 52.7 | 4 | 21.5 | 2 | 4.2 | − | 9.1 | − | 2.4 | − | 5.6 | − | ||||||||||||||||
| La Rioja | 38.7 | 2 | 33.0 | 2 | 7.6 | − | 3.7 | − | 4.4 | − | ||||||||||||||||||
| Las Palmas | 36.2 | 3 | 21.4 | 2 | 22.8 | 2 | 6.6 | − | 6.2 | − | 5.5 | − | ||||||||||||||||
| León | 42.3 | 3 | 30.4 | 2 | 10.6 | − | 4.3 | − | 3.1 | − | ||||||||||||||||||
| Lérida | 30.6 | 2 | 10.4 | − | 3.4 | − | 2.7 | − | 35.3 | 2 | 3.0 | − | 4.4 | − | ||||||||||||||
| Lugo | 29.1 | 2 | 41.7 | 3 | 6.6 | − | 1.3 | − | 2.7 | − | ||||||||||||||||||
| Madrid | 35.5 | 15 | 28.0 | 10 | 9.3 | 3 | 8.4 | 3 | 6.1 | 2 | ||||||||||||||||||
| Málaga | 50.1 | 6 | 14.6 | 2 | 4.9 | − | 9.7 | 1 | 3.9 | − | 9.7 | 1 | ||||||||||||||||
| Melilla | 42.2 | 1 | 29.5 | − | 9.0 | − | 2.1 | − | 3.2 | − | ||||||||||||||||||
| Murcia | 48.2 | 5 | 26.7 | 3 | 9.3 | 1 | 6.0 | − | 2.9 | − | ||||||||||||||||||
| Navarre | 28.6 | 2 | 27.1 | 2 | 5.4 | − | 3.1 | − | 2.9 | − | 13.8 | 1 | 1.1 | − | 6.2 | − | 3.7 | − | ||||||||||
| Orense | 31.8 | 2 | 38.6 | 3 | 5.2 | − | 1.2 | − | 2.7 | − | ||||||||||||||||||
| Palencia | 36.8 | 1 | 37.3 | 2 | 8.5 | − | 3.9 | − | 3.9 | − | ||||||||||||||||||
| Pontevedra | 31.6 | 4 | 33.2 | 4 | 7.0 | − | 2.1 | − | 4.7 | − | ||||||||||||||||||
| Salamanca | 38.6 | 2 | 30.5 | 2 | 13.9 | − | 3.2 | − | 4.9 | − | ||||||||||||||||||
| Santa Cruz de Tenerife | 38.3 | 4 | 14.2 | 1 | 11.8 | 1 | 4.7 | − | 3.5 | − | 18.2 | 1 | ||||||||||||||||
| Segovia | 31.9 | 1 | 32.3 | 1 | 18.0 | 1 | 3.7 | − | 3.4 | − | ||||||||||||||||||
| Seville | 50.8 | 8 | 15.4 | 2 | 2.1 | − | 9.6 | 1 | 3.6 | − | 12.2 | 1 | ||||||||||||||||
| Soria | 35.5 | 1 | 40.2 | 2 | 9.6 | − | 3.2 | − | 2.5 | − | ||||||||||||||||||
| Tarragona | 35.9 | 3 | 10.5 | − | 3.8 | − | 4.1 | − | 27.9 | 2 | 3.4 | − | 3.5 | − | ||||||||||||||
| Teruel | 43.8 | 2 | 34.2 | 1 | 8.2 | − | 2.7 | − | 1.9 | − | ||||||||||||||||||
| Toledo | 47.1 | 3 | 30.1 | 2 | 7.4 | − | 5.9 | − | 3.2 | − | ||||||||||||||||||
| Valencia | 41.0 | 8 | 20.7 | 4 | 6.3 | 1 | 6.5 | 1 | 2.9 | − | 11.0 | 2 | ||||||||||||||||
| Valladolid | 36.2 | 3 | 29.1 | 2 | 11.9 | − | 5.5 | − | 4.4 | − | ||||||||||||||||||
| Zamora | 38.7 | 2 | 36.4 | 1 | 11.6 | − | 2.6 | − | 3.1 | − | ||||||||||||||||||
| Zaragoza | 40.4 | 4 | 25.5 | 3 | 7.3 | − | 7.2 | − | 6.5 | − | ||||||||||||||||||
| Total | 39.6 | 187 | 21.4 | 96 | 7.1 | 13 | 6.1 | 10 | 4.1 | 17 | 3.8 | 2 | 1.7 | 5 | 1.4 | 6 | 1.3 | 5 | 0.9 | 3 | 0.7 | 2 | 0.7 | 2 | 0.5 | 1 | 0.4 | 1 |
Regions
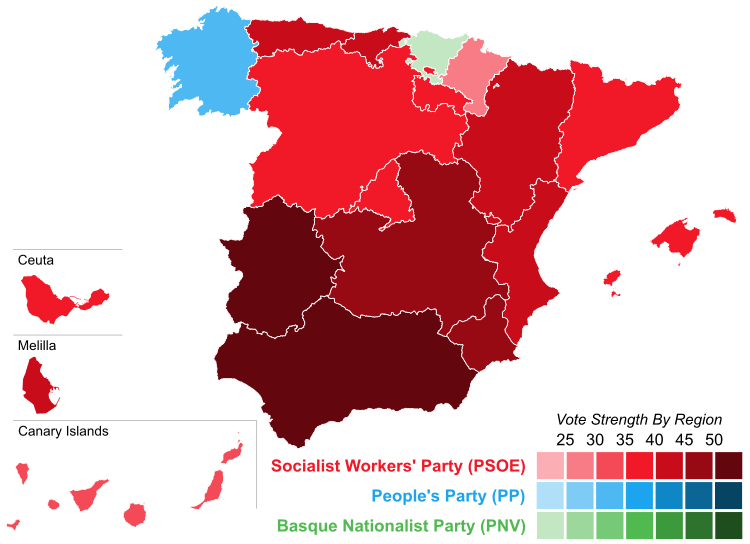
| Region | PSOE | PP | CDS | IU | CiU | RMateos | PA | HB | PNV | EA | UV | EE | ERC | AIC | ||||||||||||||
|---|---|---|---|---|---|---|---|---|---|---|---|---|---|---|---|---|---|---|---|---|---|---|---|---|---|---|---|---|
| % | S | % | S | % | S | % | S | % | S | % | S | % | S | % | S | % | S | % | S | % | S | % | S | % | S | % | S | |
| Andalusia | 50.3 | 41 | 16.1 | 12 | 4.1 | − | 9.0 | 3 | 4.1 | − | 10.4 | 5 | ||||||||||||||||
| Aragon | 41.6 | 8 | 26.6 | 5 | 7.8 | − | 6.3 | − | 5.5 | − | ||||||||||||||||||
| Asturias | 41.5 | 5 | 22.5 | 2 | 11.3 | 1 | 11.7 | 1 | 3.1 | − | ||||||||||||||||||
| Balearics | 35.6 | 3 | 32.9 | 3 | 8.2 | − | 3.5 | − | 5.7 | − | ||||||||||||||||||
| Basque Country | 18.2 | 4 | 7.6 | 2 | 2.7 | − | 1.8 | − | 1.4 | − | 19.1 | 5 | 21.0 | 5 | 13.0 | 3 | 9.8 | 2 | ||||||||||
| Canary Islands | 34.9 | 7 | 16.6 | 3 | 16.2 | 3 | 5.3 | − | 4.5 | − | 11.1 | 1 | ||||||||||||||||
| Cantabria | 40.3 | 3 | 32.0 | 2 | 7.0 | − | 4.2 | − | 4.3 | − | ||||||||||||||||||
| Castile and León | 36.4 | 16 | 32.3 | 15 | 13.2 | 2 | 4.0 | − | 4.0 | − | ||||||||||||||||||
| Castilla–La Mancha | 48.3 | 13 | 29.2 | 7 | 7.4 | − | 5.4 | − | 3.0 | − | ||||||||||||||||||
| Catalonia | 36.4 | 22 | 8.6 | 3 | 3.7 | 1 | 5.5 | 2 | 27.5 | 17 | 2.9 | − | 3.3 | 1 | ||||||||||||||
| Ceuta | 39.9 | 1 | 32.6 | − | 9.2 | − | 1.5 | − | 6.4 | − | ||||||||||||||||||
| Extremadura | 54.8 | 9 | 21.8 | 2 | 8.6 | − | 4.9 | − | 2.5 | − | ||||||||||||||||||
| Galicia | 33.0 | 13 | 33.5 | 14 | 6.7 | − | 2.0 | − | 4.3 | − | ||||||||||||||||||
| La Rioja | 38.7 | 2 | 33.0 | 2 | 7.6 | − | 3.7 | − | 4.4 | − | ||||||||||||||||||
| Madrid | 35.5 | 15 | 28.0 | 10 | 9.3 | 3 | 8.4 | 3 | 6.1 | 2 | ||||||||||||||||||
| Melilla | 42.2 | 1 | 29.5 | − | 9.0 | − | 2.1 | − | 3.2 | − | ||||||||||||||||||
| Murcia | 48.2 | 5 | 26.7 | 3 | 9.3 | 1 | 6.0 | − | 2.9 | − | ||||||||||||||||||
| Navarre | 28.6 | 2 | 27.1 | 2 | 5.4 | − | 3.1 | − | 2.9 | − | 13.8 | 1 | 1.1 | − | 6.2 | − | 3.7 | − | ||||||||||
| Valencian Community | 42.7 | 17 | 22.7 | 9 | 7.5 | 2 | 5.9 | 1 | 3.2 | − | 6.8 | 2 | ||||||||||||||||
| Total | 39.6 | 187 | 21.4 | 96 | 7.1 | 13 | 6.1 | 10 | 4.1 | 17 | 3.8 | 2 | 1.7 | 5 | 1.4 | 6 | 1.3 | 5 | 0.9 | 3 | 0.7 | 2 | 0.7 | 2 | 0.5 | 1 | 0.4 | 1 |
References
- "Elecciones Europeas. 15 de junio de 1989". elecciones.eldiario.es (in Spanish). eldiario.es. Retrieved 8 February 2020.
- "Ley Orgánica 5/1985, de 19 de junio, del Régimen Electoral General". Organic Law No. 5 of 19 June 1985. Boletín Oficial del Estado (in Spanish). Retrieved 6 March 2017.
- "Treaty concerning the accession of the Kingdom of Spain and the Portuguese Republic to the European Economic Community and to the European Atomic Energy Community". Act of 15 November 1985. Official Journal of the European Communities. Retrieved 21 July 2017.
- Gallagher, Michael (30 July 2012). "Effective threshold in electoral systems". Trinity College, Dublin. Retrieved 22 July 2017.
- "Electoral Results Consultation. European Parliament. June 1989. National totals". www.infoelectoral.mir.es (in Spanish). Ministry of the Interior. Retrieved 24 September 2017.
- "European election 15 June 1989". historiaelectoral.com (in Spanish). Electoral History. Retrieved 24 September 2017.
- "Electoral Results Consultation. European Parliament. June 1989. Andalusia". www.infoelectoral.mir.es (in Spanish). Ministry of the Interior. Retrieved 24 September 2017.
- "Electoral Results Consultation. European Parliament. June 1989. Aragon". www.infoelectoral.mir.es (in Spanish). Ministry of the Interior. Retrieved 24 September 2017.
- "Electoral Results Consultation. European Parliament. June 1989. Principality of Asturias". www.infoelectoral.mir.es (in Spanish). Ministry of the Interior. Retrieved 24 September 2017.
- "Electoral Results Consultation. European Parliament. June 1989. Balearics". www.infoelectoral.mir.es (in Spanish). Ministry of the Interior. Retrieved 24 September 2017.
- "Electoral Results Consultation. European Parliament. June 1989. Basque Country". www.infoelectoral.mir.es (in Spanish). Ministry of the Interior. Retrieved 24 September 2017.
- "Electoral Results Consultation. European Parliament. June 1989. Canary Islands". www.infoelectoral.mir.es (in Spanish). Ministry of the Interior. Retrieved 24 September 2017.
- "Electoral Results Consultation. European Parliament. June 1989. Cantabria". www.infoelectoral.mir.es (in Spanish). Ministry of the Interior. Retrieved 24 September 2017.
- "Electoral Results Consultation. European Parliament. June 1989. Castile and León". www.infoelectoral.mir.es (in Spanish). Ministry of the Interior. Retrieved 24 September 2017.
- "Electoral Results Consultation. European Parliament. June 1989. Castilla–La Mancha". www.infoelectoral.mir.es (in Spanish). Ministry of the Interior. Retrieved 24 September 2017.
- "Electoral Results Consultation. European Parliament. June 1989. Catalonia". www.infoelectoral.mir.es (in Spanish). Ministry of the Interior. Retrieved 24 September 2017.
- "Electoral Results Consultation. European Parliament. June 1989. Extremadura". www.infoelectoral.mir.es (in Spanish). Ministry of the Interior. Retrieved 24 September 2017.
- "Electoral Results Consultation. European Parliament. June 1989. Galicia". www.infoelectoral.mir.es (in Spanish). Ministry of the Interior. Retrieved 24 September 2017.
- "Electoral Results Consultation. European Parliament. June 1989. La Rioja". www.infoelectoral.mir.es (in Spanish). Ministry of the Interior. Retrieved 24 September 2017.
- "Electoral Results Consultation. European Parliament. June 1989. Community of Madrid". www.infoelectoral.mir.es (in Spanish). Ministry of the Interior. Retrieved 24 September 2017.
- "Electoral Results Consultation. European Parliament. June 1989. Region of Murcia". www.infoelectoral.mir.es (in Spanish). Ministry of the Interior. Retrieved 24 September 2017.
- "Electoral Results Consultation. European Parliament. June 1989. Foral Community of Navarre". www.infoelectoral.mir.es (in Spanish). Ministry of the Interior. Retrieved 24 September 2017.
- "Electoral Results Consultation. European Parliament. June 1989. Valencian Community". www.infoelectoral.mir.es (in Spanish). Ministry of the Interior. Retrieved 24 September 2017.
- "Electoral Results Consultation. European Parliament. June 1989. Ceuta". www.infoelectoral.mir.es (in Spanish). Ministry of the Interior. Retrieved 24 September 2017.
- "Electoral Results Consultation. European Parliament. June 1989. Melilla". www.infoelectoral.mir.es (in Spanish). Ministry of the Interior. Retrieved 24 September 2017.
- Díez, Anabel (6 July 1989). "El PSOE obtendría 187 diputados en unas legislativas con idénticos resultados a las pasadas elecciones europeas". El País (in Spanish). Madrid. Retrieved 18 July 2017.
- "European election 15 June 1989. General election projection". historiaelectoral.com (in Spanish). Electoral History. Retrieved 24 September 2017.
| General elections |
|
|---|---|
| Presidential elections | |
| European elections | |
| Local elections | |
| Regional elections | |
| Referendums | |
| |