Results breakdown of the 2004 Spanish general election (Congress)
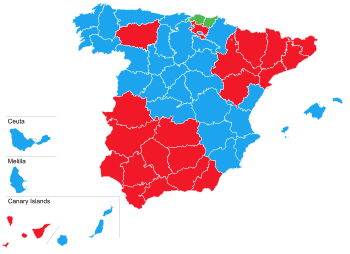
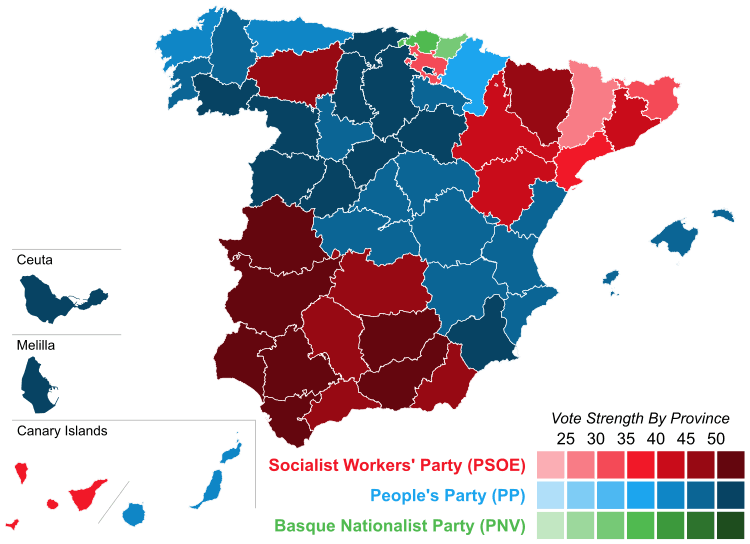
This is the results breakdown of the Congress of Deputies election held in Spain on 14 March 2004. The following tables show detailed results in each of the country's 17 autonomous communities and in the autonomous cities of Ceuta and Melilla, as well as a summary of constituency results.[1][2]
| Main: 2004 Spanish general election | ||||
|---|---|---|---|---|
| 14 March 2004 2008 → | ||||
 | ||||
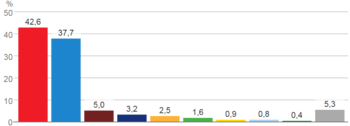 | ||||
Party | Votes | % | Seats | |
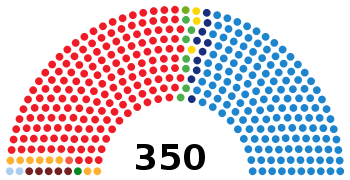
| PSOE | 11,026,163 | 42.6% | 164 | |
| PP | 9,763,144 | 37.7% | 148 | |
| IU | 1,284,081 | 5.0% | 5 | |
| CiU | 835,471 | 3.2% | 10 | |
| ERC | 652,196 | 2.5% | 8 | |
| EAJ/PNV | 420,980 | 1.6% | 7 | |
| CC | 235,221 | 0.9% | 3 | |
| BNG | 208,688 | 0.8% | 2 | |
| CHA | 94,252 | 0.4% | 1 | |
| Others | 1,371,103 | 5.3% | 2 | |
Total | 25,891,299 | 100.0% | 350 | |
Electoral system
348 members of the Congress of Deputies were elected using the D'Hondt method and a closed list proportional representation, with a threshold of three percent of valid votes—which included blank ballots—being applied in each constituency. Parties not reaching the threshold were not taken into consideration for seat distribution. The D'Hondt method might result in a higher effective threshold, depending on the district magnitude.[3] Seats were allocated to constituencies, corresponding to the provinces of Spain, with each being allocated an initial minimum of two seats and the remaining 248 being distributed in proportion to their populations. Ceuta and Melilla were allocated the two remaining seats, which were elected using plurality voting. Voting was on the basis of universal suffrage, which comprised all nationals over eighteen and in full enjoyment of their political rights.[4]
The electoral law allowed for parties and federations registered in the interior ministry, coalitions and groupings of electors to present lists of candidates. Parties and federations intending to form a coalition ahead of an election were required to inform the relevant Electoral Commission within ten days of the election call, whereas groupings of electors needed to secure the signature of at least one percent of the electorate in the constituencies for which they sought election, disallowing electors from signing for more than one list of candidates.[5][6]
Nationwide
 | ||||||
| Parties and coalitions | Popular vote | Seats | ||||
|---|---|---|---|---|---|---|
| Votes | % | ±pp | Total | +/− | ||
| Spanish Socialist Workers' Party (PSOE) | 11,026,163 | 42.59 | +8.43 | 164 | +39 | |
| People's Party (PP) | 9,763,144 | 37.71 | –6.81 | 148 | –35 | |
| United Left (IU)1 | 1,284,081 | 4.96 | –0.93 | 5 | –4 | |
| Convergence and Union (CiU) | 835,471 | 3.23 | –0.96 | 10 | –5 | |
| Republican Left of Catalonia (ERC) | 652,196 | 2.52 | +1.68 | 8 | +7 | |
| Basque Nationalist Party (EAJ/PNV)2 | 420,980 | 1.63 | +0.13 | 7 | ±0 | |
| Canarian Coalition (CC) | 235,221 | 0.91 | –0.16 | 3 | –1 | |
| Galician Nationalist Bloc (BNG) | 208,688 | 0.81 | –0.51 | 2 | –1 | |
| Andalusian Party (PA) | 181,868 | 0.70 | –0.19 | 0 | –1 | |
| Aragonese Union (CHA) | 94,252 | 0.36 | +0.03 | 1 | ±0 | |
| Basque Solidarity (EA)2 | 80,905 | 0.31 | –0.06 | 1 | ±0 | |
| The Eco-pacifist Greens (LVEP) | 68,027 | 0.26 | +0.16 | 0 | ±0 | |
| The Greens–The Ecologist Alternative (EV–AE) | 30,528 | 0.12 | New | 0 | ±0 | |
| Navarre Yes (NaBai)3 | 61,045 | 0.24 | +0.15 | 1 | +1 | |
| Valencian Nationalist Bloc–Green Left (Bloc–EV) | 40,759 | 0.16 | –0.09 | 0 | ±0 | |
| Progressives for the Balearic Islands (PSM–EN, EU, EV, ER)4 | 40,289 | 0.16 | –0.06 | 0 | ±0 | |
| Citizens for Blank Votes (CenB) | 40,208 | 0.16 | New | 0 | ±0 | |
| Aralar–Stand up (Aralar–Zutik) | 38,560 | 0.15 | New | 0 | ±0 | |
| Aragonese Party (PAR) | 36,540 | 0.14 | –0.03 | 0 | ±0 | |
| Democratic and Social Centre (CDS) | 34,101 | 0.13 | +0.03 | 0 | ±0 | |
| Socialist Party of Andalusia (PSA) | 24,127 | 0.09 | New | 0 | ±0 | |
| Humanist Party (PH) | 21,758 | 0.08 | ±0.00 | 0 | ±0 | |
| The Greens of the Community of Madrid (LVCM) | 19,600 | 0.08 | –0.01 | 0 | ±0 | |
| Republican Left (IR) | 16,993 | 0.07 | New | 0 | ±0 | |
| Cannabis Party for Legalisation and Normalisation (PCLyN) | 16,918 | 0.07 | New | 0 | ±0 | |
| Family and Life Party (PFyV) | 16,699 | 0.06 | New | 0 | ±0 | |
| The Greens (LV) | 15,220 | 0.06 | ±0.00 | 0 | ±0 | |
| The Greens of Extremadura (LV) | 3,133 | 0.01 | ±0.00 | 0 | ±0 | |
| National Democracy (DN) | 15,180 | 0.06 | New | 0 | ±0 | |
| Leonese People's Union (UPL) | 14,160 | 0.05 | –0.13 | 0 | ±0 | |
| Communist Party of the Peoples of Spain (PCPE) | 12,979 | 0.05 | –0.01 | 0 | ±0 | |
| The Greens–Green Group (LV–GV) | 12,749 | 0.05 | –0.04 | 0 | ±0 | |
| Spanish Phalanx of the CNSO (FE–JONS)5 | 12,266 | 0.05 | +0.02 | 0 | ±0 | |
| Majorcan Union (UM) | 10,558 | 0.04 | ±0.00 | 0 | ±0 | |
| The Phalanx (FE) | 10,311 | 0.04 | –0.02 | 0 | ±0 | |
| Commoners' Land–Castilian Nationalist Party (TC–PNC) | 8,866 | 0.03 | –0.05 | 0 | ±0 | |
| Internationalist Socialist Workers' Party (POSI) | 8,003 | 0.03 | –0.02 | 0 | ±0 | |
| Republican Social Movement (MSR) | 6,768 | 0.03 | New | 0 | ±0 | |
| Spanish Democratic Party (PADE) | 5,677 | 0.02 | –0.02 | 0 | ±0 | |
| Convergence of Democrats of Navarre (CDN) | 5,573 | 0.02 | –0.02 | 0 | ±0 | |
| Authentic Phalanx (FA) | 4,589 | 0.02 | New | 0 | ±0 | |
| Asturianist Party (PAS) | 4,292 | 0.02 | –0.01 | 0 | ±0 | |
| Spain 2000 (E–2000) | 4,231 | 0.02 | –0.02 | 0 | ±0 | |
| Canarian Nationalist Party (PNC) | 4,092 | 0.02 | New | 0 | ±0 | |
| United Extremadura (EU) | 3,916 | 0.02 | ±0.00 | 0 | ±0 | |
| Party of Self-employed and Professionals (AUTONOMO) | 3,124 | 0.01 | –0.01 | 0 | ±0 | |
| Initiative for the Development of Soria (IDES) | 2,934 | 0.01 | New | 0 | ±0 | |
| Andalusia Assembly (A) | 2,930 | 0.01 | ±0.00 | 0 | ±0 | |
| Canarian Popular Alternative (APCa) | 2,715 | 0.01 | New | 0 | ±0 | |
| European Green Group (GVE) | 2,662 | 0.01 | New | 0 | ±0 | |
| Independent Candidacy–The Party of Castile and León (CI–PCL) | 2,421 | 0.01 | –0.01 | 0 | ±0 | |
| Unsubmissive Seats–Alternative of Discontented Democrats (Ei–ADD) | 2,332 | 0.01 | New | 0 | ±0 | |
| Party of the Democratic Karma (PKD) | 2,300 | 0.01 | ±0.00 | 0 | ±0 | |
| Galician People's Front (FPG) | 2,257 | 0.01 | ±0.00 | 0 | ±0 | |
| Galician Coalition (CG) | 2,235 | 0.01 | ±0.00 | 0 | ±0 | |
| Alliance for Development and Nature (ADN) | 2,215 | 0.01 | New | 0 | ±0 | |
| Party of Precarious Workers (PTPRE) | 2,115 | 0.01 | New | 0 | ±0 | |
| Kingdom of Valencia Identity (IRV) | 2,111 | 0.01 | New | 0 | ±0 | |
| Party of Self-employed, Retirees and Widows (PAE) | 2,082 | 0.01 | ±0.00 | 0 | ±0 | |
| Andecha Astur (AA) | 1,970 | 0.01 | ±0.00 | 0 | ±0 | |
| Union of the Salamancan People (UPSa) | 1,871 | 0.01 | New | 0 | ±0 | |
| The Greens–Green Alternative (EV–AV) | 1,836 | 0.01 | –0.04 | 0 | ±0 | |
| Carlist Party (PC) | 1,813 | 0.01 | ±0.00 | 0 | ±0 | |
| Romantic Mutual Support Party (PMAR) | 1,561 | 0.01 | New | 0 | ±0 | |
| Cantabrian Nationalist Council (CNC) | 1,431 | 0.01 | ±0.00 | 0 | ±0 | |
| Salamanca–Zamora–León–PREPAL (PREPAL) | 1,322 | 0.01 | ±0.00 | 0 | ±0 | |
| Another Democracy is Possible (ODeP) | 1,302 | 0.01 | New | 0 | ±0 | |
| Independent Social Group (ASI) | 1,237 | 0.00 | New | 0 | ±0 | |
| Independent Social Democratic Party of the Valencian Community (PSICV) | 1,096 | 0.00 | New | 0 | ±0 | |
| Republican Party (PRF) | 1,051 | 0.00 | New | 0 | ±0 | |
| Alternative for Gran Canaria (AxGC) | 957 | 0.00 | New | 0 | ±0 | |
| Alliance for National Unity (AUN) | 923 | 0.00 | New | 0 | ±0 | |
| Left Assembly–Initiative for Andalusia (A–IZ) | 901 | 0.00 | New | 0 | ±0 | |
| Christian Positivist Party (PPCr) | 892 | 0.00 | ±0.00 | 0 | ±0 | |
| Asturian Left (IAS) | 854 | 0.00 | ±0.00 | 0 | ±0 | |
| Socialist Party of the People of Ceuta (PSPC) | 807 | 0.00 | ±0.00 | 0 | ±0 | |
| Liberal Centrist Union (UCL) | 798 | 0.00 | New | 0 | ±0 | |
| Caló Nationalist Party (PNCA) | 757 | 0.00 | –0.01 | 0 | ±0 | |
| United Zamora (ZU) | 754 | 0.00 | New | 0 | ±0 | |
| Union of Centrists of Menorca (UCM) | 751 | 0.00 | New | 0 | ±0 | |
| Internationalist Struggle (LI (LIT–CI)) | 668 | 0.00 | –0.01 | 0 | ±0 | |
| Spanish Democratic Front (FDE) | 619 | 0.00 | New | 0 | ±0 | |
| Castilian Unity (UdCa) | 601 | 0.00 | New | 0 | ±0 | |
| Andalusian Social Democratic Party (PSDA) | 583 | 0.00 | New | 0 | ±0 | |
| Nationalist Maga Alternative (AMAGA) | 468 | 0.00 | New | 0 | ±0 | |
| Balearic People's Union (UPB) | 411 | 0.00 | ±0.00 | 0 | ±0 | |
| European Nation State (N) | 410 | 0.00 | ±0.00 | 0 | ±0 | |
| Workers for Democracy Coalition (TD) | 407 | 0.00 | New | 0 | ±0 | |
| National Workers' Party (PNT) | 379 | 0.00 | New | 0 | ±0 | |
| Party of The People (LG) | 378 | 0.00 | New | 0 | ±0 | |
| Regionalist Party of Guadalajara (PRGU) | 330 | 0.00 | ±0.00 | 0 | ±0 | |
| National Union (UN) | 318 | 0.00 | ±0.00 | 0 | ±0 | |
| Citizens' Convergence of the South-East (CCSE) | 308 | 0.00 | ±0.00 | 0 | ±0 | |
| National Democratic Party of Spain (PDNE) | 232 | 0.00 | New | 0 | ±0 | |
| Spanish Absolute Honesty Political Group (GPHAE) | 52 | 0.00 | New | 0 | ±0 | |
| Blank ballots | 407,795 | 1.58 | ±0.00 | |||
| Total | 25,891,299 | 350 | ±0 | |||
| Valid votes | 25,891,299 | 98.99 | –0.33 | |||
| Invalid votes | 264,137 | 1.01 | +0.33 | |||
| Votes cast / turnout | 26,155,436 | 75.66 | +6.95 | |||
| Abstentions | 8,416,395 | 24.34 | –6.95 | |||
| Registered voters | 34,571,831 | |||||
| Sources[7][8] | ||||||
Summary
Constituencies
| Constituency | PSOE | PP | IU | CiU | ERC | PNV | CC | BNG | CHA | EA | NaBai | |||||||||||
|---|---|---|---|---|---|---|---|---|---|---|---|---|---|---|---|---|---|---|---|---|---|---|
| % | S | % | S | % | S | % | S | % | S | % | S | % | S | % | S | % | S | % | S | % | S | |
| A Coruña | 38.9 | 4 | 44.6 | 4 | 1.9 | − | 11.7 | 1 | ||||||||||||||
| Álava | 30.8 | 2 | 26.9 | 1 | 7.8 | − | 25.8 | 1 | 4.3 | − | ||||||||||||
| Albacete | 46.3 | 2 | 46.9 | 2 | 3.9 | − | ||||||||||||||||
| Alicante | 42.1 | 5 | 48.9 | 6 | 3.9 | − | 0.3 | − | ||||||||||||||
| Almería | 47.7 | 3 | 44.3 | 2 | 3.1 | − | ||||||||||||||||
| Asturias | 43.4 | 4 | 43.8 | 4 | 8.4 | − | ||||||||||||||||
| Ávila | 34.0 | 1 | 59.5 | 2 | 3.2 | − | ||||||||||||||||
| Badajoz | 51.7 | 3 | 41.7 | 3 | 3.9 | − | ||||||||||||||||
| Balearic Islands | 39.5 | 4 | 45.9 | 4 | ||||||||||||||||||
| Barcelona | 41.7 | 14 | 16.0 | 5 | 6.5 | 2 | 19.3 | 6 | 14.1 | 4 | ||||||||||||
| Biscay | 26.8 | 3 | 18.7 | 2 | 8.6 | − | 37.3 | 4 | 4.3 | − | ||||||||||||
| Burgos | 38.9 | 2 | 52.0 | 2 | 3.3 | − | ||||||||||||||||
| Cáceres | 50.5 | 2 | 43.5 | 2 | 2.8 | − | ||||||||||||||||
| Cádiz | 50.7 | 6 | 33.6 | 3 | 6.0 | − | ||||||||||||||||
| Cantabria | 40.9 | 2 | 51.9 | 3 | 3.3 | − | ||||||||||||||||
| Castellón | 44.6 | 2 | 45.6 | 3 | 3.3 | − | 0.7 | − | ||||||||||||||
| Ceuta | 35.8 | − | 59.2 | 1 | 0.6 | − | ||||||||||||||||
| Ciudad Real | 48.1 | 3 | 46.6 | 2 | 2.8 | − | ||||||||||||||||
| Córdoba | 49.9 | 4 | 33.7 | 3 | 9.7 | − | ||||||||||||||||
| Cuenca | 45.4 | 1 | 49.7 | 2 | 2.4 | − | ||||||||||||||||
| Gipuzkoa | 26.3 | 2 | 15.3 | 1 | 7.7 | − | 31.0 | 2 | 11.5 | 1 | ||||||||||||
| Girona | 31.6 | 2 | 11.5 | − | 4.2 | − | 27.1 | 2 | 23.3 | 2 | ||||||||||||
| Granada | 51.5 | 4 | 37.0 | 3 | 6.0 | − | ||||||||||||||||
| Guadalajara | 44.1 | 1 | 47.6 | 2 | 4.4 | − | ||||||||||||||||
| Huelva | 56.2 | 3 | 30.6 | 2 | 5.5 | − | ||||||||||||||||
| Huesca | 45.7 | 2 | 37.5 | 1 | 2.7 | − | 6.4 | − | ||||||||||||||
| Jaén | 54.4 | 4 | 34.1 | 2 | 5.8 | − | ||||||||||||||||
| La Rioja | 44.0 | 2 | 49.9 | 2 | 2.8 | − | ||||||||||||||||
| Las Palmas | 33.9 | 3 | 42.2 | 4 | 2.0 | − | 18.1 | 1 | ||||||||||||||
| León | 46.8 | 3 | 45.0 | 2 | 2.1 | − | ||||||||||||||||
| Lleida | 29.6 | 2 | 14.6 | − | 3.0 | − | 29.5 | 1 | 21.5 | 1 | ||||||||||||
| Lugo | 37.2 | 2 | 49.7 | 2 | 1.0 | − | 10.1 | − | ||||||||||||||
| Madrid | 44.1 | 16 | 45.0 | 17 | 6.4 | 2 | ||||||||||||||||
| Málaga | 49.8 | 6 | 36.4 | 4 | 6.4 | − | ||||||||||||||||
| Melilla | 41.4 | − | 54.6 | 1 | 0.8 | − | ||||||||||||||||
| Murcia | 35.0 | 3 | 57.4 | 6 | 4.3 | − | ||||||||||||||||
| Navarre | 33.6 | 2 | 37.6 | 2 | 5.9 | − | 18.0 | 1 | ||||||||||||||
| Ourense | 31.1 | 1 | 55.3 | 3 | 0.9 | − | 10.9 | − | ||||||||||||||
| Palencia | 43.1 | 1 | 50.2 | 2 | 2.8 | − | ||||||||||||||||
| Pontevedra | 37.5 | 3 | 46.0 | 3 | 2.2 | − | 11.6 | 1 | ||||||||||||||
| Salamanca | 39.8 | 2 | 54.3 | 2 | 2.0 | − | ||||||||||||||||
| Santa Cruz de Tenerife | 35.0 | 3 | 28.3 | 2 | 1.9 | − | 30.9 | 2 | ||||||||||||||
| Segovia | 39.9 | 1 | 52.4 | 2 | 3.5 | − | ||||||||||||||||
| Seville | 58.3 | 8 | 27.9 | 4 | 6.7 | − | ||||||||||||||||
| Soria | 38.8 | 1 | 50.8 | 2 | 2.1 | − | ||||||||||||||||
| Tarragona | 35.5 | 3 | 17.0 | 1 | 3.8 | − | 21.5 | 1 | 19.8 | 1 | ||||||||||||
| Teruel | 41.1 | 2 | 40.8 | 1 | 2.9 | − | 5.1 | − | ||||||||||||||
| Toledo | 46.5 | 2 | 47.5 | 3 | 3.5 | − | ||||||||||||||||
| Valencia | 42.2 | 7 | 45.7 | 8 | 5.4 | 1 | 0.6 | − | ||||||||||||||
| Valladolid | 44.6 | 2 | 46.8 | 3 | 3.7 | − | ||||||||||||||||
| Zamora | 39.9 | 1 | 53.3 | 2 | 2.5 | − | ||||||||||||||||
| Zaragoza | 40.3 | 3 | 35.5 | 3 | 2.8 | − | 14.5 | 1 | ||||||||||||||
| Total | 42.6 | 164 | 37.7 | 148 | 5.0 | 5 | 3.2 | 10 | 2.5 | 8 | 1.6 | 7 | 0.9 | 3 | 0.8 | 2 | 0.4 | 1 | 0.3 | 1 | 0.2 | 1 |
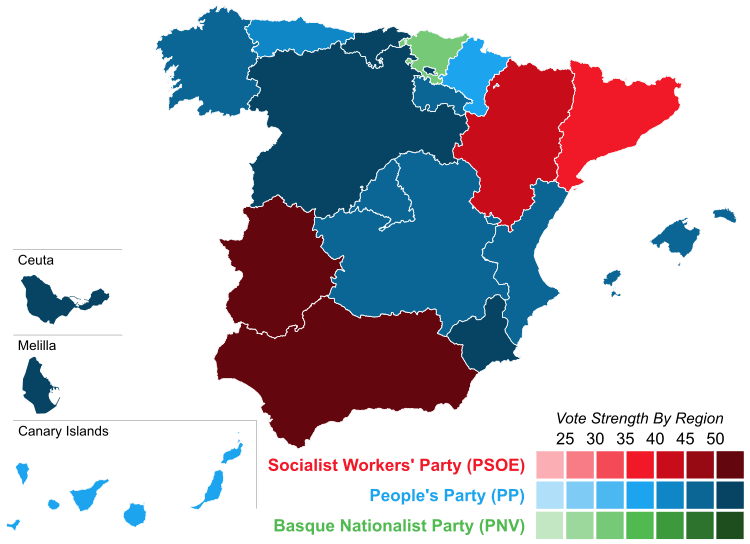
Regions
| Region | PSOE | PP | IU | CiU | ERC | PNV | CC | BNG | CHA | EA | NaBai | |||||||||||
|---|---|---|---|---|---|---|---|---|---|---|---|---|---|---|---|---|---|---|---|---|---|---|
| % | S | % | S | % | S | % | S | % | S | % | S | % | S | % | S | % | S | % | S | % | S | |
| Andalusia | 52.9 | 38 | 33.7 | 23 | 6.4 | − | ||||||||||||||||
| Aragon | 41.3 | 7 | 36.5 | 5 | 2.8 | − | 12.1 | 1 | ||||||||||||||
| Asturias | 43.4 | 4 | 43.8 | 4 | 8.4 | − | ||||||||||||||||
| Balearic Islands | 39.5 | 4 | 45.9 | 4 | ||||||||||||||||||
| Basque Country | 27.2 | 7 | 18.9 | 4 | 8.2 | − | 33.7 | 7 | 6.5 | 1 | ||||||||||||
| Canary Islands | 34.5 | 6 | 35.4 | 6 | 1.9 | − | 24.3 | 3 | ||||||||||||||
| Cantabria | 40.9 | 2 | 51.9 | 3 | 3.3 | − | ||||||||||||||||
| Castile and León | 41.9 | 14 | 50.3 | 19 | 2.8 | − | ||||||||||||||||
| Castilla–La Mancha | 46.5 | 9 | 47.4 | 11 | 3.4 | − | ||||||||||||||||
| Catalonia | 39.5 | 21 | 15.6 | 6 | 5.8 | 2 | 20.8 | 10 | 15.9 | 8 | ||||||||||||
| Ceuta | 35.8 | − | 59.2 | 1 | 0.6 | − | ||||||||||||||||
| Extremadura | 51.2 | 5 | 42.4 | 5 | 3.5 | − | ||||||||||||||||
| Galicia | 37.2 | 10 | 47.1 | 12 | 1.7 | − | 11.4 | 2 | ||||||||||||||
| La Rioja | 44.0 | 2 | 49.9 | 2 | 2.8 | − | ||||||||||||||||
| Madrid | 44.1 | 16 | 45.0 | 17 | 6.4 | 2 | ||||||||||||||||
| Melilla | 41.4 | − | 54.6 | 1 | 0.8 | − | ||||||||||||||||
| Murcia | 35.0 | 3 | 57.4 | 6 | 4.3 | − | ||||||||||||||||
| Navarre | 33.6 | 2 | 37.6 | 2 | 5.9 | − | 18.0 | 1 | ||||||||||||||
| Valencian Community | 42.4 | 14 | 46.8 | 17 | 4.7 | 1 | 0.5 | – | ||||||||||||||
| Total | 42.6 | 164 | 37.7 | 148 | 5.0 | 5 | 3.2 | 10 | 2.5 | 8 | 1.6 | 7 | 0.9 | 3 | 0.8 | 2 | 0.4 | 1 | 0.3 | 1 | 0.2 | 1 |
Autonomous communities
Andalusia
| Parties and coalitions | Popular vote | Seats | ||||
|---|---|---|---|---|---|---|
| Votes | % | ±pp | Total | +/− | ||
| Spanish Socialist Workers' Party (PSOE) | 2,377,455 | 52.86 | +9.00 | 38 | +8 | |
| People's Party (PP) | 1,514,987 | 33.69 | –6.88 | 23 | –5 | |
| United Left/The Greens–Assembly for Andalusia (IULV–CA) | 287,374 | 6.39 | –1.43 | 0 | –3 | |
| Andalusian Party (PA) | 181,868 | 4.04 | –1.07 | 0 | –1 | |
| Socialist Party of Andalusia (PSA) | 24,127 | 0.54 | New | 0 | ±0 | |
| Citizens for Blank Votes (CenB) | 6,653 | 0.15 | New | 0 | ±0 | |
| Humanist Party (PH) | 4,055 | 0.09 | +0.01 | 0 | ±0 | |
| Republican Left (IR) | 3,462 | 0.08 | New | 0 | ±0 | |
| Democratic and Social Centre (CDS) | 3,336 | 0.07 | +0.02 | 0 | ±0 | |
| Andalusia Assembly (A) | 2,930 | 0.07 | ±0.00 | 0 | ±0 | |
| Family and Life Party (PFyV) | 2,596 | 0.06 | New | 0 | ±0 | |
| Spanish Phalanx of the CNSO (FE–JONS)1 | 2,190 | 0.05 | +0.02 | 0 | ±0 | |
| Party of Precarious Workers (PTPRE) | 2,115 | 0.05 | New | 0 | ±0 | |
| National Democracy (DN) | 1,956 | 0.04 | New | 0 | ±0 | |
| The Phalanx (FE) | 1,708 | 0.04 | –0.02 | 0 | ±0 | |
| Republican Social Movement (MSR) | 1,276 | 0.03 | New | 0 | ±0 | |
| Spanish Democratic Party (PADE) | 1,023 | 0.02 | –0.02 | 0 | ±0 | |
| Left Assembly–Initiative for Andalusia (A–IZ) | 901 | 0.02 | New | 0 | ±0 | |
| Christian Positivist Party (PPCr) | 892 | 0.02 | +0.01 | 0 | ±0 | |
| Andalusian Social Democratic Party (PSDA) | 583 | 0.01 | New | 0 | ±0 | |
| Spain 2000 (E–2000) | 503 | 0.01 | –0.03 | 0 | ±0 | |
| Communist Party of the Peoples of Spain (PCPE) | 372 | 0.01 | –0.08 | 0 | ±0 | |
| National Union (UN) | 318 | 0.01 | ±0.00 | 0 | ±0 | |
| Authentic Phalanx (FA) | 288 | 0.01 | New | 0 | ±0 | |
| Blank ballots | 74,305 | 1.65 | +0.28 | |||
| Total | 4,497,273 | 61 | –1 | |||
| Valid votes | 4,497,273 | 99.39 | +0.09 | |||
| Invalid votes | 27,780 | 0.61 | –0.09 | |||
| Votes cast / turnout | 4,525,053 | 74.77 | +6.00 | |||
| Abstentions | 1,526,716 | 25.23 | –6.00 | |||
| Registered voters | 6,051,769 | |||||
| Sources[7][9] | ||||||
Aragon
| Parties and coalitions | Popular vote | Seats | ||||
|---|---|---|---|---|---|---|
| Votes | % | ±pp | Total | +/− | ||
| Spanish Socialist Workers' Party (PSOE) | 322,428 | 41.28 | +10.20 | 7 | +3 | |
| People's Party (PP) | 284,893 | 36.48 | –10.75 | 5 | –3 | |
| Aragonese Union (CHA) | 94,252 | 12.07 | +1.65 | 1 | ±0 | |
| Aragonese Party (PAR) | 36,540 | 4.68 | –0.70 | 0 | ±0 | |
| United Left–The Greens (IU–LV) | 21,836 | 2.80 | –0.71 | 0 | ±0 | |
| Citizens for Blank Votes (CenB) | 1,037 | 0.13 | New | 0 | ±0 | |
| Democratic and Social Centre (CDS) | 775 | 0.10 | +0.07 | 0 | ±0 | |
| Family and Life Party (PFyV) | 719 | 0.09 | New | 0 | ±0 | |
| National Democracy (DN) | 581 | 0.07 | New | 0 | ±0 | |
| Communist Party of the Peoples of Spain (PCPE) | 460 | 0.06 | New | 0 | ±0 | |
| Republican Left (IR) | 428 | 0.05 | New | 0 | ±0 | |
| Humanist Party (PH) | 359 | 0.05 | ±0.00 | 0 | ±0 | |
| Spanish Phalanx of the CNSO (FE–JONS)1 | 310 | 0.04 | +0.01 | 0 | ±0 | |
| The Phalanx (FE) | 258 | 0.03 | –0.02 | 0 | ±0 | |
| Republican Social Movement (MSR) | 163 | 0.02 | New | 0 | ±0 | |
| Authentic Phalanx (FA) | 161 | 0.02 | New | 0 | ±0 | |
| Carlist Party (PC) | 99 | 0.01 | New | 0 | ±0 | |
| Spanish Democratic Party (PADE) | 23 | 0.00 | –0.02 | 0 | ±0 | |
| Blank ballots | 15,679 | 2.01 | +0.56 | |||
| Total | 781,001 | 13 | ±0 | |||
| Valid votes | 781,001 | 99.40 | +0.11 | |||
| Invalid votes | 4,731 | 0.60 | –0.11 | |||
| Votes cast / turnout | 785,732 | 77.04 | +5.65 | |||
| Abstentions | 234,191 | 22.96 | –5.65 | |||
| Registered voters | 1,019,923 | |||||
| Sources[7][10] | ||||||
Asturias
| Parties and coalitions | Popular vote | Seats | ||||
|---|---|---|---|---|---|---|
| Votes | % | ±pp | Total | +/− | ||
| People's Party (PP) | 307,977 | 43.77 | –2.56 | 4 | –1 | |
| Spanish Socialist Workers' Party (PSOE) | 305,240 | 43.38 | +6.36 | 4 | +1 | |
| United Left–Bloc for Asturias (IU–BA) | 59,253 | 8.42 | –1.84 | 0 | –1 | |
| The Greens of Asturias (LV) | 5,013 | 0.71 | –0.03 | 0 | ±0 | |
| Asturianist Party (PAS) | 4,292 | 0.61 | –0.29 | 0 | ±0 | |
| Andecha Astur (AA) | 1,970 | 0.28 | –0.03 | 0 | ±0 | |
| Citizens for Blank Votes (CenB) | 1,348 | 0.19 | New | 0 | ±0 | |
| Asturian Left (IAS) | 854 | 0.12 | –0.05 | 0 | ±0 | |
| Communist Party of the Peoples of Spain (PCPE) | 798 | 0.11 | New | 0 | ±0 | |
| Asturian Democratic Convergence–CDS (CDAS–CDS) | 582 | 0.08 | –0.02 | 0 | ±0 | |
| Humanist Party (PH) | 415 | 0.06 | +0.01 | 0 | ±0 | |
| Republican Left (IR) | 377 | 0.05 | New | 0 | ±0 | |
| National Democracy (DN) | 254 | 0.04 | New | 0 | ±0 | |
| Spanish Phalanx of the CNSO (FE–JONS)1 | 253 | 0.04 | +0.01 | 0 | ±0 | |
| Republican Social Movement (MSR) | 216 | 0.03 | New | 0 | ±0 | |
| The Phalanx (FE) | 181 | 0.03 | –0.02 | 0 | ±0 | |
| Authentic Phalanx (FA) | 179 | 0.03 | New | 0 | ±0 | |
| Blank ballots | 14,453 | 2.05 | +0.37 | |||
| Total | 703,655 | 8 | –1 | |||
| Valid votes | 703,655 | 99.45 | +0.11 | |||
| Invalid votes | 3,902 | 0.55 | –0.11 | |||
| Votes cast / turnout | 707,557 | 71.73 | +4.74 | |||
| Abstentions | 278,795 | 28.27 | –4.74 | |||
| Registered voters | 986,352 | |||||
| Sources[7][11] | ||||||
Balearic Islands
| Parties and coalitions | Popular vote | Seats | ||||
|---|---|---|---|---|---|---|
| Votes | % | ±pp | Total | +/− | ||
| People's Party (PP) | 215,737 | 45.89 | –7.98 | 4 | –1 | |
| Spanish Socialist Workers' Party (PSOE) | 185,623 | 39.48 | +10.20 | 4 | +2 | |
| Progressives for the Balearic Islands (PSM–EN, EU, EV, ER)1 | 40,289 | 8.57 | –4.07 | 0 | ±0 | |
| Majorcan Union (UM) | 10,558 | 2.25 | +0.15 | 0 | ±0 | |
| European Green Group (GVE) | 2,662 | 0.57 | New | 0 | ±0 | |
| Citizens for Blank Votes (CenB) | 1,588 | 0.34 | New | 0 | ±0 | |
| Independent Social Group (ASI) | 1,237 | 0.26 | New | 0 | ±0 | |
| Republican Left (IR) | 825 | 0.18 | New | 0 | ±0 | |
| Union of Centrists of Menorca (UCM) | 751 | 0.16 | New | 0 | ±0 | |
| Balearic People's Union (UPB) | 411 | 0.09 | –0.04 | 0 | ±0 | |
| Workers for Democracy Coalition (TD) | 407 | 0.09 | –0.02 | 0 | ±0 | |
| Spanish Phalanx of the CNSO (FE–JONS)2 | 325 | 0.07 | +0.02 | 0 | ±0 | |
| The Phalanx (FE) | 272 | 0.06 | ±0.00 | 0 | ±0 | |
| National Democracy (DN) | 227 | 0.05 | New | 0 | ±0 | |
| Republican Social Movement (MSR) | 134 | 0.03 | New | 0 | ±0 | |
| Blank ballots | 9,073 | 1.93 | +0.44 | |||
| Total | 470,119 | 8 | +1 | |||
| Valid votes | 470,119 | 99.29 | –0.05 | |||
| Invalid votes | 3,362 | 0.71 | +0.05 | |||
| Votes cast / turnout | 473,481 | 68.84 | +7.41 | |||
| Abstentions | 214,353 | 31.16 | –7.41 | |||
| Registered voters | 652,009 | |||||
| Sources[7][12] | ||||||
Basque Country
| Parties and coalitions | Popular vote | Seats | ||||
|---|---|---|---|---|---|---|
| Votes | % | ±pp | Total | +/− | ||
| Basque Nationalist Party (EAJ/PNV) | 420,980 | 33.72 | +3.34 | 7 | ±0 | |
| Socialist Party of the Basque Country–Basque Country Left (PSE–EE (PSOE)) | 339,751 | 27.22 | +3.91 | 7 | +3 | |
| People's Party (PP) | 235,785 | 18.89 | –9.37 | 4 | –3 | |
| United Left (EB/IU) | 102,342 | 8.20 | +2.75 | 0 | ±0 | |
| Basque Solidarity (EA) | 80,905 | 6.48 | –1.09 | 1 | ±0 | |
| Aralar–Stand up (Aralar–Zutik) | 38,560 | 3.09 | New | 0 | ±0 | |
| Humanist Party (PH) | 4,022 | 0.32 | +0.05 | 0 | ±0 | |
| Party of the Democratic Karma (PKD) | 2,300 | 0.18 | –0.06 | 0 | ±0 | |
| Internationalist Socialist Workers' Party (POSI) | 1,682 | 0.13 | +0.02 | 0 | ±0 | |
| Democratic and Social Centre (CDS) | 1,472 | 0.12 | +0.06 | 0 | ±0 | |
| Republican Left (IR) | 1,193 | 0.10 | New | 0 | ±0 | |
| National Democracy (DN) | 707 | 0.06 | New | 0 | ±0 | |
| Republican Social Movement (MSR) | 528 | 0.04 | New | 0 | ±0 | |
| Carlist Party of the Basque Country–Carlist Party (EKA–PC) | 515 | 0.04 | ±0.00 | 0 | ±0 | |
| Spanish Phalanx of the CNSO (FE–JONS)1 | 320 | 0.03 | +0.01 | 0 | ±0 | |
| The Phalanx (FE) | 266 | 0.02 | –0.02 | 0 | ±0 | |
| Authentic Phalanx (FA) | 100 | 0.01 | New | 0 | ±0 | |
| Blank ballots | 16,889 | 1.35 | –1.66 | |||
| Total | 1,248,317 | 19 | ±0 | |||
| Valid votes | 1,248,317 | 92.31 | –6.63 | |||
| Invalid votes | 104,017 | 7.69 | +6.63 | |||
| Votes cast / turnout | 1,352,334 | 74.97 | +11.13 | |||
| Abstentions | 451,603 | 25.03 | –11.13 | |||
| Registered voters | 1,803,937 | |||||
| Sources[7][13] | ||||||
Canary Islands
| Parties and coalitions | Popular vote | Seats | ||||
|---|---|---|---|---|---|---|
| Votes | % | ±pp | Total | +/− | ||
| People's Party (PP) | 342,672 | 35.44 | –6.37 | 6 | –1 | |
| Spanish Socialist Workers' Party (PSOE) | 333,084 | 34.45 | +12.26 | 6 | +3 | |
| Canarian Coalition (CC) | 235,221 | 24.33 | –5.23 | 3 | –1 | |
| The Greens–United Left–Citizens' Alternative Initiative (LV–IU–AC25M) | 18,612 | 1.93 | –0.48 | 0 | ±0 | |
| The Greens–Green Group (LV–GV) | 11,033 | 1.14 | New | 0 | ±0 | |
| Canarian Nationalist Party (PNC) | 4,092 | 0.42 | New | 0 | ±0 | |
| Canarian Popular Alternative (APCa) | 2,715 | 0.28 | New | 0 | ±0 | |
| Communist Party of the Canarian People (PCPC) | 1,592 | 0.16 | –0.01 | 0 | ±0 | |
| Democratic and Social Centre (CDS) | 1,445 | 0.15 | +0.02 | 0 | ±0 | |
| Alternative for Gran Canaria (AxGC) | 957 | 0.10 | New | 0 | ±0 | |
| Humanist Party (PH) | 895 | 0.09 | –0.04 | 0 | ±0 | |
| Republican Left (IR) | 642 | 0.07 | New | 0 | ±0 | |
| Internationalist Socialist Workers' Party (POSI) | 582 | 0.06 | New | 0 | ±0 | |
| National Democracy (DN) | 517 | 0.05 | New | 0 | ±0 | |
| Spanish Phalanx of the CNSO (FE–JONS) | 488 | 0.05 | New | 0 | ±0 | |
| Nationalist Maga Alternative (AMAGA) | 468 | 0.05 | New | 0 | ±0 | |
| Authentic Phalanx (FA) | 456 | 0.05 | New | 0 | ±0 | |
| Party of The People (LG) | 378 | 0.04 | New | 0 | ±0 | |
| The Phalanx (FE) | 354 | 0.04 | –0.06 | 0 | ±0 | |
| Republican Social Movement (MSR) | 261 | 0.03 | New | 0 | ±0 | |
| Blank ballots | 10,382 | 1.07 | +0.21 | |||
| Total | 966,846 | 15 | +1 | |||
| Valid votes | 966,846 | 99.42 | +0.07 | |||
| Invalid votes | 5,630 | 0.58 | –0.07 | |||
| Votes cast / turnout | 972,476 | 66.70 | +6.03 | |||
| Abstentions | 485,462 | 33.30 | –6.03 | |||
| Registered voters | 1,457,938 | |||||
| Sources[7][14] | ||||||
Cantabria
| Parties and coalitions | Popular vote | Seats | ||||
|---|---|---|---|---|---|---|
| Votes | % | ±pp | Total | +/− | ||
| People's Party (PP) | 190,383 | 51.90 | –4.94 | 3 | ±0 | |
| Spanish Socialist Workers' Party (PSOE) | 149,906 | 40.87 | +7.40 | 2 | ±0 | |
| United Left (IU) | 12,146 | 3.31 | –1.71 | 0 | ±0 | |
| Cantabrian Nationalist Council (CNC) | 1,431 | 0.39 | –0.24 | 0 | ±0 | |
| Citizens for Blank Votes (CenB) | 1,326 | 0.36 | New | 0 | ±0 | |
| Democratic and Social Centre (CDS) | 896 | 0.24 | +0.02 | 0 | ±0 | |
| Humanist Party (PH) | 694 | 0.19 | +0.08 | 0 | ±0 | |
| Republican Social Movement (MSR) | 500 | 0.14 | New | 0 | ±0 | |
| Communist Party of the Peoples of Spain (PCPE) | 431 | 0.12 | –0.04 | 0 | ±0 | |
| Spanish Phalanx of the CNSO (FE–JONS)1 | 209 | 0.06 | ±0.00 | 0 | ±0 | |
| National Democracy (DN) | 204 | 0.06 | New | 0 | ±0 | |
| The Phalanx (FE) | 167 | 0.05 | –0.04 | 0 | ±0 | |
| Authentic Phalanx (FA) | 140 | 0.04 | New | 0 | ±0 | |
| Carlist Party (PC) | 126 | 0.03 | New | 0 | ±0 | |
| Blank ballots | 8,267 | 2.25 | –0.37 | |||
| Total | 366,826 | 5 | ±0 | |||
| Valid votes | 366,826 | 99.12 | +0.08 | |||
| Invalid votes | 3,244 | 0.88 | –0.08 | |||
| Votes cast / turnout | 370,070 | 77.23 | +5.42 | |||
| Abstentions | 109,119 | 22.77 | –5.42 | |||
| Registered voters | 479,189 | |||||
| Sources[7][15] | ||||||
Castile and León
| Parties and coalitions | Popular vote | Seats | ||||
|---|---|---|---|---|---|---|
| Votes | % | ±pp | Total | +/− | ||
| People's Party (PP) | 846,623 | 50.31 | –5.37 | 19 | –3 | |
| Spanish Socialist Workers' Party (PSOE) | 705,053 | 41.90 | +9.73 | 14 | +3 | |
| United Left (IU) | 47,693 | 2.83 | –1.61 | 0 | ±0 | |
| Leonese People's Union (UPL) | 14,160 | 0.84 | –1.81 | 0 | ±0 | |
| Commoners' Land–Castilian Nationalist Party (TC–PNC) | 6,816 | 0.41 | –0.57 | 0 | ±0 | |
| Citizens for Blank Votes (CenB) | 3,681 | 0.22 | New | 0 | ±0 | |
| Democratic and Social Centre (CDS) | 3,306 | 0.20 | –0.12 | 0 | ±0 | |
| Initiative for the Development of Soria (IDES) | 2,934 | 0.17 | New | 0 | ±0 | |
| Independent Candidacy–The Party of Castile and León (CI–PCL) | 2,421 | 0.14 | –0.13 | 0 | ±0 | |
| Union of the Salamancan People (UPSa) | 1,871 | 0.11 | New | 0 | ±0 | |
| Cannabis Party for Legalisation and Normalisation (PCLyN) | 1,851 | 0.11 | New | 0 | ±0 | |
| Family and Life Party (PFyV) | 1,690 | 0.10 | New | 0 | ±0 | |
| The Greens–Green Group (LV–GV) | 1,581 | 0.09 | New | 0 | ±0 | |
| Salamanca–Zamora–León–PREPAL (PREPAL) | 1,322 | 0.08 | –0.05 | 0 | ±0 | |
| Humanist Party (PH) | 1,316 | 0.08 | –0.02 | 0 | ±0 | |
| Republican Left (IR) | 1,042 | 0.06 | New | 0 | ±0 | |
| Spanish Phalanx of the CNSO (FE–JONS)1 | 881 | 0.05 | +0.01 | 0 | ±0 | |
| Communist Party of the Castilian People (PCPC–PCPE) | 857 | 0.05 | –0.01 | 0 | ±0 | |
| United Zamora (ZU) | 754 | 0.04 | New | 0 | ±0 | |
| The Phalanx (FE) | 738 | 0.04 | –0.05 | 0 | ±0 | |
| National Democracy (DN) | 695 | 0.04 | New | 0 | ±0 | |
| Spanish Democratic Party (PADE) | 622 | 0.04 | –0.03 | 0 | ±0 | |
| Authentic Phalanx (FA) | 429 | 0.03 | New | 0 | ±0 | |
| Republican Social Movement (MSR) | 408 | 0.02 | New | 0 | ±0 | |
| Liberal Centrist Union (UCL) | 140 | 0.01 | New | 0 | ±0 | |
| Spain 2000 (E–2000) | 119 | 0.01 | –0.04 | 0 | ±0 | |
| Carlist Party (PC) | 91 | 0.01 | ±0.00 | 0 | ±0 | |
| Romantic Mutual Support Party (PMAR) | 77 | 0.00 | New | 0 | ±0 | |
| Spanish Absolute Honesty Political Group (GPHAE) | 17 | 0.00 | New | 0 | ±0 | |
| Blank ballots | 33,669 | 2.00 | –0.01 | |||
| Total | 1,682,857 | 33 | ±0 | |||
| Valid votes | 1,682,857 | 99.23 | +0.01 | |||
| Invalid votes | 13,066 | 0.77 | –0.01 | |||
| Votes cast / turnout | 1,695,923 | 77.81 | +5.24 | |||
| Abstentions | 483,598 | 22.19 | –5.24 | |||
| Registered voters | 2,179,521 | |||||
| Sources[7][16] | ||||||
Castilla–La Mancha
| Parties and coalitions | Popular vote | Seats | ||||
|---|---|---|---|---|---|---|
| Votes | % | ±pp | Total | +/− | ||
| People's Party (PP) | 547,764 | 47.40 | –4.96 | 11 | –1 | |
| Spanish Socialist Workers' Party (PSOE) | 537,405 | 46.50 | +5.72 | 9 | +1 | |
| United Left–Left of Castilla–La Mancha (IU–ICAM) | 39,001 | 3.37 | –0.98 | 0 | ±0 | |
| Citizens for Blank Votes (CenB) | 2,270 | 0.20 | New | 0 | ±0 | |
| Democratic and Social Centre (CDS) | 1,629 | 0.14 | +0.01 | 0 | ±0 | |
| Family and Life Party (PFyV) | 1,379 | 0.12 | New | 0 | ±0 | |
| Commoners' Land–Castilian Nationalist Party (TC–PNC) | 1,021 | 0.09 | –0.06 | 0 | ±0 | |
| Humanist Party (PH) | 829 | 0.07 | –0.05 | 0 | ±0 | |
| Communist Party of the Peoples of Spain (PCPE) | 769 | 0.07 | New | 0 | ±0 | |
| National Democracy (DN) | 687 | 0.06 | New | 0 | ±0 | |
| Republican Left (IR) | 614 | 0.05 | New | 0 | ±0 | |
| Castilian Unity (UdCa) | 601 | 0.05 | New | 0 | ±0 | |
| The Phalanx (FE) | 561 | 0.05 | –0.03 | 0 | ±0 | |
| Spanish Democratic Party (PADE) | 509 | 0.04 | –0.01 | 0 | ±0 | |
| Spanish Phalanx of the CNSO (FE–JONS)1 | 487 | 0.04 | +0.03 | 0 | ±0 | |
| Authentic Phalanx (FA) | 363 | 0.03 | New | 0 | ±0 | |
| Regionalist Party of Guadalajara (PRGU) | 330 | 0.03 | –0.01 | 0 | ±0 | |
| Republican Social Movement (MSR) | 287 | 0.02 | New | 0 | ±0 | |
| Romantic Mutual Support Party (PMAR) | 273 | 0.02 | New | 0 | ±0 | |
| Internationalist Socialist Workers' Party (POSI) | 152 | 0.01 | New | 0 | ±0 | |
| Spanish Absolute Honesty Political Group (GPHAE) | 35 | 0.00 | New | 0 | ±0 | |
| Blank ballots | 18,726 | 1.62 | +0.29 | |||
| Total | 1,155,692 | 20 | ±0 | |||
| Valid votes | 1,155,692 | 99.14 | –0.06 | |||
| Invalid votes | 10,050 | 0.86 | +0.06 | |||
| Votes cast / turnout | 1,165,742 | 79.90 | +3.59 | |||
| Abstentions | 293,202 | 20.10 | –3.59 | |||
| Registered voters | 1,458,944 | |||||
| Sources[7][17] | ||||||
Catalonia
| Parties and coalitions | Popular vote | Seats | ||||
|---|---|---|---|---|---|---|
| Votes | % | ±pp | Total | +/− | ||
| Socialists' Party of Catalonia (PSC–PSOE) | 1,586,748 | 39.47 | +5.34 | 21 | +4 | |
| Convergence and Union (CiU) | 835,471 | 20.78 | –8.01 | 10 | –5 | |
| Republican Left of Catalonia (ERC) | 638,902 | 15.89 | +10.25 | 8 | +7 | |
| People's Party (PP) | 626,107 | 15.58 | –7.21 | 6 | –6 | |
| Initiative for Catalonia Greens–United and Alternative Left (ICV–EUiA)1 | 234,790 | 5.84 | +0.07 | 2 | +1 | |
| The Greens–The Ecologist Alternative (EV–AE) | 30,528 | 0.76 | New | 0 | ±0 | |
| Internationalist Socialist Workers' Party (POSI) | 3,688 | 0.09 | –0.05 | 0 | ±0 | |
| Citizens for Blank Votes (CenB) | 3,641 | 0.09 | New | 0 | ±0 | |
| Republican Left–Left Republican Party (IR–PRE) | 3,325 | 0.08 | +0.03 | 0 | ±0 | |
| Democratic and Social Centre (CDS) | 2,636 | 0.07 | +0.01 | 0 | ±0 | |
| Unsubmissive Seats–Alternative of Discontented Democrats (Ei–ADD) | 2,332 | 0.06 | New | 0 | ±0 | |
| Communist Party of the Catalan People (PCPC) | 2,331 | 0.06 | New | 0 | ±0 | |
| Family and Life Party (PFiV) | 2,028 | 0.05 | New | 0 | ±0 | |
| The Greens–Green Alternative (EV–AV) | 1,836 | 0.05 | –0.29 | 0 | ±0 | |
| Spanish Phalanx of the CNSO (FE–JONS)2 | 1,561 | 0.04 | +0.02 | 0 | ±0 | |
| Humanist Party (PH) | 1,550 | 0.04 | –0.01 | 0 | ±0 | |
| The Phalanx (FE) | 1,410 | 0.04 | ±0.00 | 0 | ±0 | |
| National Democracy (DN) | 1,392 | 0.03 | New | 0 | ±0 | |
| Caló Nationalist Party (PNCA) | 757 | 0.02 | –0.01 | 0 | ±0 | |
| Republican Social Movement (MSR) | 691 | 0.02 | New | 0 | ±0 | |
| Spanish Democratic Party (PADE) | 674 | 0.02 | ±0.00 | 0 | ±0 | |
| Internationalist Struggle (LI (LIT–CI)) | 487 | 0.01 | –0.01 | 0 | ±0 | |
| European Nation State (N) | 410 | 0.01 | –0.02 | 0 | ±0 | |
| Spanish Democratic Front (FDE) | 377 | 0.01 | New | 0 | ±0 | |
| Spain 2000 (E–2000) | 117 | 0.00 | –0.03 | 0 | ±0 | |
| Carlist Party of Catalonia (PCdeC) | 61 | 0.00 | New | 0 | ±0 | |
| Blank ballots | 35,923 | 0.89 | –0.52 | |||
| Total | 4,019,773 | 47 | +1 | |||
| Valid votes | 4,019,773 | 99.68 | +0.18 | |||
| Invalid votes | 12,816 | 0.32 | –0.18 | |||
| Votes cast / turnout | 4,032,589 | 75.96 | +11.95 | |||
| Abstentions | 1,276,125 | 24.04 | –11.95 | |||
| Registered voters | 5,308,714 | |||||
| Sources[7][18] | ||||||
Extremadura
| Parties and coalitions | Popular vote | Seats | ||||
|---|---|---|---|---|---|---|
| Votes | % | ±pp | Total | +/− | ||
| Spanish Socialist Workers' Party (PSOE) | 356,826 | 51.22 | +6.51 | 5 | ±0 | |
| People's Party (PP) | 295,326 | 42.39 | –4.91 | 5 | –1 | |
| United Left–Independent Socialists of Extremadura (IU–SIEx)1 | 24,158 | 3.47 | –1.44 | 0 | ±0 | |
| United Extremadura (EU) | 3,916 | 0.56 | –0.17 | 0 | ±0 | |
| The Greens of Extremadura (LV) | 3,133 | 0.45 | –0.07 | 0 | ±0 | |
| Communist Party of the Peoples of Spain (PCPE) | 872 | 0.13 | New | 0 | ±0 | |
| Citizens for Blank Votes (CenB) | 769 | 0.11 | New | 0 | ±0 | |
| Democratic and Social Centre (CDS) | 727 | 0.10 | +0.02 | 0 | ±0 | |
| Republican Left (IR) | 384 | 0.06 | New | 0 | ±0 | |
| Family and Life Party (PFyV) | 351 | 0.05 | New | 0 | ±0 | |
| Humanist Party (PH) | 294 | 0.04 | +0.01 | 0 | ±0 | |
| National Democracy (DN) | 283 | 0.04 | New | 0 | ±0 | |
| Spanish Phalanx of the CNSO (FE–JONS)2 | 247 | 0.04 | +0.02 | 0 | ±0 | |
| Authentic Phalanx (FA) | 203 | 0.02 | New | 0 | ±0 | |
| Republican Social Movement (MSR) | 139 | 0.02 | New | 0 | ±0 | |
| The Phalanx (FE) | 129 | 0.02 | –0.05 | 0 | ±0 | |
| Blank ballots | 8,889 | 1.28 | +0.12 | |||
| Total | 696,646 | 10 | –1 | |||
| Valid votes | 696,646 | 99.26 | +0.05 | |||
| Invalid votes | 5,164 | 0.74 | –0.05 | |||
| Votes cast / turnout | 701,810 | 79.26 | +3.84 | |||
| Abstentions | 183,600 | 20.74 | –3.84 | |||
| Registered voters | 885,410 | |||||
| Sources[7][19] | ||||||
Galicia
| Parties and coalitions | Popular vote | Seats | ||||
|---|---|---|---|---|---|---|
| Votes | % | ±pp | Total | +/− | ||
| People's Party (PP) | 865,460 | 47.15 | –6.84 | 12 | –4 | |
| Socialists' Party of Galicia (PSdeG–PSOE) | 682,684 | 37.19 | +13.48 | 10 | +4 | |
| Galician Nationalist Bloc (BNG) | 208,688 | 11.37 | –7.25 | 2 | –1 | |
| United Left (EU–IU) | 31,908 | 1.74 | +0.46 | 0 | ±0 | |
| Party of Self-employed and Professionals (AUTONOMO) | 3,124 | 0.17 | –0.02 | 0 | ±0 | |
| Humanist Party (PH) | 2,740 | 0.15 | +0.03 | 0 | ±0 | |
| Democratic and Social Centre (CDS) | 2,507 | 0.14 | +0.04 | 0 | ±0 | |
| Galician People's Front (FPG) | 2,257 | 0.12 | –0.02 | 0 | ±0 | |
| Galician Coalition (CG) | 2,235 | 0.12 | –0.02 | 0 | ±0 | |
| Republican Left–Galician Republican Left (IR–ERG) | 1,669 | 0.09 | New | 0 | ±0 | |
| National Democracy (DN) | 1,029 | 0.06 | New | 0 | ±0 | |
| Spanish Phalanx of the CNSO (FE–JONS)1 | 715 | 0.04 | +0.02 | 0 | ±0 | |
| Spanish Democratic Party (PADE) | 653 | 0.04 | ±0.00 | 0 | ±0 | |
| The Phalanx (FE) | 626 | 0.03 | –0.02 | 0 | ±0 | |
| Republican Social Movement (MSR) | 539 | 0.03 | New | 0 | ±0 | |
| Blank ballots | 28,850 | 1.57 | +0.25 | |||
| Total | 1,835,684 | 24 | –1 | |||
| Valid votes | 1,835,684 | 99.29 | –0.01 | |||
| Invalid votes | 13,130 | 0.71 | +0.01 | |||
| Votes cast / turnout | 1,848,814 | 70.97 | +5.95 | |||
| Abstentions | 756,072 | 29.03 | –5.95 | |||
| Registered voters | 2,604,886 | |||||
| Sources[7][20] | ||||||
La Rioja
| Parties and coalitions | Popular vote | Seats | ||||
|---|---|---|---|---|---|---|
| Votes | % | ±pp | Total | +/− | ||
| People's Party (PP) | 92,441 | 49.94 | –4.16 | 2 | –1 | |
| Spanish Socialist Workers' Party (PSOE) | 81,390 | 43.97 | +9.10 | 2 | +1 | |
| United Left (IU) | 5,115 | 2.76 | –1.26 | 0 | ±0 | |
| Citizens for Blank Votes (CenB) | 926 | 0.50 | New | 0 | ±0 | |
| Family and Life Party (PFyV) | 434 | 0.23 | New | 0 | ±0 | |
| Democratic and Social Centre (CDS) | 272 | 0.15 | +0.07 | 0 | ±0 | |
| Republican Left (IR) | 253 | 0.14 | New | 0 | ±0 | |
| The Phalanx (FE) | 154 | 0.08 | +0.02 | 0 | ±0 | |
| National Democracy (DN) | 123 | 0.07 | New | 0 | ±0 | |
| Republican Social Movement (MSR) | 101 | 0.05 | New | 0 | ±0 | |
| Carlist Party (PC) | 63 | 0.03 | ±0.00 | 0 | ±0 | |
| Blank ballots | 3,827 | 2.07 | +0.15 | |||
| Total | 185,099 | 4 | ±0 | |||
| Valid votes | 185,099 | 99.22 | –0.02 | |||
| Invalid votes | 1,446 | 0.78 | +0.02 | |||
| Votes cast / turnout | 186,545 | 79.46 | +5.25 | |||
| Abstentions | 48,231 | 20.54 | –5.25 | |||
| Registered voters | 234,776 | |||||
| Sources[7][21] | ||||||
Madrid
| Parties and coalitions | Popular vote | Seats | ||||
|---|---|---|---|---|---|---|
| Votes | % | ±pp | Total | +/− | ||
| People's Party (PP) | 1,576,636 | 45.02 | –7.50 | 17 | –2 | |
| Spanish Socialist Workers' Party (PSOE) | 1,544,676 | 44.11 | +11.05 | 16 | +4 | |
| United Left of the Community of Madrid (IUCM) | 225,109 | 6.43 | –2.69 | 2 | –1 | |
| The Greens of the Community of Madrid (LVCM) | 19,600 | 0.56 | –0.12 | 0 | ±0 | |
| The Eco-pacifist Greens (LVEP) | 15,984 | 0.46 | New | 0 | ±0 | |
| Citizens for Blank Votes (CenB) | 9,990 | 0.29 | New | 0 | ±0 | |
| Democratic and Social Centre (CDS) | 7,528 | 0.21 | +0.10 | 0 | ±0 | |
| National Democracy (DN) | 4,036 | 0.12 | New | 0 | ±0 | |
| Family and Life Party (PFyV) | 2,888 | 0.08 | New | 0 | ±0 | |
| Spanish Phalanx of the CNSO (FE–JONS)1 | 2,676 | 0.08 | +0.03 | 0 | ±0 | |
| Alliance for Development and Nature (ADN) | 2,215 | 0.06 | New | 0 | ±0 | |
| Party of Self-employed, Retirees and Widows (PAE) | 2,082 | 0.06 | +0.02 | 0 | ±0 | |
| The Phalanx (FE) | 1,943 | 0.06 | ±0.00 | 0 | ±0 | |
| Humanist Party (PH) | 1,770 | 0.05 | –0.02 | 0 | ±0 | |
| Communist Party of the Peoples of Spain (PCPE) | 1,746 | 0.05 | –0.04 | 0 | ±0 | |
| Republican Left (IR) | 1,530 | 0.04 | New | 0 | ±0 | |
| Another Democracy is Possible (ODeP) | 1,302 | 0.04 | New | 0 | ±0 | |
| Romantic Mutual Support Party (PMAR) | 1,211 | 0.03 | New | 0 | ±0 | |
| Commoners' Land–Castilian Nationalist Party (TC–PNC) | 1,029 | 0.03 | –0.01 | 0 | ±0 | |
| Spanish Democratic Party (PADE) | 1,024 | 0.03 | –0.01 | 0 | ±0 | |
| Alliance for National Unity (AUN) | 923 | 0.03 | New | 0 | ±0 | |
| Authentic Phalanx (FA) | 909 | 0.03 | New | 0 | ±0 | |
| Internationalist Socialist Workers' Party (POSI) | 892 | 0.03 | –0.03 | 0 | ±0 | |
| Republican Social Movement (MSR) | 684 | 0.02 | New | 0 | ±0 | |
| Spain 2000 (E–2000) | 528 | 0.02 | ±0.00 | 0 | ±0 | |
| Liberal Centrist Union (UCL) | 410 | 0.01 | New | 0 | ±0 | |
| Carlist Party (PC) | 238 | 0.01 | ±0.00 | 0 | ±0 | |
| Internationalist Struggle (LI (LIT–CI)) | 181 | 0.01 | ±0.00 | 0 | ±0 | |
| Blank ballots | 72,038 | 2.06 | +0.18 | |||
| Total | 3,501,778 | 35 | +1 | |||
| Valid votes | 3,501,778 | 99.50 | +0.02 | |||
| Invalid votes | 17,465 | 0.50 | –0.02 | |||
| Votes cast / turnout | 3,519,243 | 78.93 | +6.85 | |||
| Abstentions | 939,297 | 21.07 | –6.85 | |||
| Registered voters | 4,458,540 | |||||
| Sources[7][22] | ||||||
Murcia
| Parties and coalitions | Popular vote | Seats | ||||
|---|---|---|---|---|---|---|
| Votes | % | ±pp | Total | +/− | ||
| People's Party (PP) | 413,902 | 57.42 | –0.66 | 6 | ±0 | |
| Spanish Socialist Workers' Party (PSOE) | 252,246 | 35.00 | +2.62 | 3 | ±0 | |
| United Left (IU) | 30,787 | 4.27 | –1.97 | 0 | ±0 | |
| The Greens of the Region of Murcia (LVRM) | 7,074 | 0.98 | ±0.00 | 0 | ±0 | |
| Democratic and Social Centre (CDS) | 1,153 | 0.16 | +0.07 | 0 | ±0 | |
| Citizens for Blank Votes (CenB) | 957 | 0.13 | New | 0 | ±0 | |
| Family and Life Party (PFyV) | 657 | 0.09 | New | 0 | ±0 | |
| Republican Left (IR) | 521 | 0.07 | New | 0 | ±0 | |
| Spanish Democratic Party (PADE) | 426 | 0.06 | –0.15 | 0 | ±0 | |
| Communist Party of the Peoples of Spain (PCPE) | 419 | 0.06 | New | 0 | ±0 | |
| National Workers' Party (PNT) | 379 | 0.05 | New | 0 | ±0 | |
| Authentic Phalanx (FA) | 361 | 0.05 | New | 0 | ±0 | |
| Spanish Phalanx of the CNSO (FE–JONS) | 353 | 0.05 | New | 0 | ±0 | |
| Citizens' Convergence of the South-East (CCSE) | 308 | 0.04 | –0.06 | 0 | ±0 | |
| National Democracy (DN) | 258 | 0.04 | New | 0 | ±0 | |
| National Democratic Party of Spain (PDNE) | 232 | 0.03 | New | 0 | ±0 | |
| The Phalanx (FE) | 228 | 0.03 | –0.06 | 0 | ±0 | |
| Republican Social Movement (MSR) | 183 | 0.03 | New | 0 | ±0 | |
| Blank ballots | 10,331 | 1.43 | +0.36 | |||
| Total | 720,775 | 9 | ±0 | |||
| Valid votes | 720,775 | 99.38 | –0.05 | |||
| Invalid votes | 4,491 | 0.62 | +0.05 | |||
| Votes cast / turnout | 725,266 | 77.06 | +3.52 | |||
| Abstentions | 215,879 | 22.94 | –3.52 | |||
| Registered voters | 941,145 | |||||
| Sources[7][23] | ||||||
Navarre
| Parties and coalitions | Popular vote | Seats | ||||
|---|---|---|---|---|---|---|
| Votes | % | ±pp | Total | +/− | ||
| Navarrese People's Union–People's Party (UPN–PP) | 127,653 | 37.60 | –12.29 | 2 | –1 | |
| Spanish Socialist Workers' Party (PSOE) | 113,906 | 33.55 | +6.23 | 2 | ±0 | |
| Navarre Yes (NaBai)1 | 61,045 | 17.98 | +11.13 | 1 | +1 | |
| United Left of Navarre (IUN/NEB) | 19,899 | 5.86 | –1.75 | 0 | ±0 | |
| Convergence of Democrats of Navarre (CDN) | 5,573 | 1.64 | –1.22 | 0 | ±0 | |
| Humanist Party (PH) | 958 | 0.28 | –0.04 | 0 | ±0 | |
| Family and Life Party (PFyV) | 778 | 0.23 | New | 0 | ±0 | |
| Democratic and Social Centre (CDS) | 763 | 0.22 | +0.05 | 0 | ±0 | |
| Republican Left (IR) | 634 | 0.19 | New | 0 | ±0 | |
| Carlist Party (PC) | 620 | 0.18 | –0.03 | 0 | ±0 | |
| National Democracy (DN) | 351 | 0.10 | New | 0 | ±0 | |
| Spain 2000 (E–2000) | 221 | 0.07 | –0.02 | 0 | ±0 | |
| The Phalanx (FE) | 195 | 0.06 | –0.09 | 0 | ±0 | |
| Republican Social Movement (MSR) | 173 | 0.05 | New | 0 | ±0 | |
| Blank ballots | 6,739 | 1.98 | –1.97 | |||
| Total | 339,508 | 5 | ±0 | |||
| Valid votes | 339,508 | 95.54 | –3.22 | |||
| Invalid votes | 15,831 | 4.46 | +3.22 | |||
| Votes cast / turnout | 355,339 | 76.22 | +10.15 | |||
| Abstentions | 110,842 | 23.78 | –10.15 | |||
| Registered voters | 466,181 | |||||
| Sources[7][24] | ||||||
Valencian Community
| Parties and coalitions | Popular vote | Seats | ||||
|---|---|---|---|---|---|---|
| Votes | % | ±pp | Total | +/− | ||
| People's Party (PP) | 1,242,800 | 46.78 | –5.33 | 17 | –2 | |
| Spanish Socialist Workers' Party (PSOE) | 1,127,700 | 42.45 | +8.45 | 14 | +2 | |
| United Left–The Agreement+Republican Left (Entesa+IR) | 123,611 | 4.65 | –1.17 | 1 | ±0 | |
| Valencian Nationalist Bloc–Green Left (Bloc–EV) | 40,759 | 1.53 | –0.88 | 0 | ±0 | |
| The Eco-pacifist Greens (LVEP) | 21,515 | 0.81 | –0.10 | 0 | ±0 | |
| Cannabis Party for Legalisation and Normalisation (PCLyN) | 15,067 | 0.57 | New | 0 | ±0 | |
| Republican Left of the Valencian Country (ERPV) | 13,294 | 0.50 | +0.37 | 0 | ±0 | |
| Citizens for Blank Votes (CenB) | 6,022 | 0.23 | New | 0 | ±0 | |
| Democratic and Social Centre (CDS) | 4,985 | 0.19 | +0.11 | 0 | ±0 | |
| Family and Life Party (PFyV) | 3,179 | 0.12 | New | 0 | ±0 | |
| Spain 2000 (E–2000) | 2,721 | 0.10 | +0.04 | 0 | ±0 | |
| Communist Party of the Peoples of Spain (PCPE) | 2,332 | 0.09 | –0.04 | 0 | ±0 | |
| Kingdom of Valencia Identity (IRV) | 2,111 | 0.08 | New | 0 | ±0 | |
| Humanist Party (PH) | 1,861 | 0.07 | +0.01 | 0 | ±0 | |
| National Democracy (DN) | 1,788 | 0.07 | New | 0 | ±0 | |
| Spanish Phalanx of the CNSO (FE–JONS)1 | 1,251 | 0.05 | +0.02 | 0 | ±0 | |
| Independent Social Democratic Party of the Valencian Community (PSICV) | 1,096 | 0.04 | New | 0 | ±0 | |
| Republican Party (PRF) | 1,051 | 0.04 | New | 0 | ±0 | |
| Internationalist Socialist Workers' Party (POSI) | 1,007 | 0.04 | –0.07 | 0 | ±0 | |
| Authentic Phalanx (FA) | 1,000 | 0.04 | New | 0 | ±0 | |
| The Phalanx (FE) | 959 | 0.04 | –0.02 | 0 | ±0 | |
| Spanish Democratic Party (PADE) | 663 | 0.02 | –0.03 | 0 | ±0 | |
| Republican Social Movement (MSR) | 485 | 0.02 | New | 0 | ±0 | |
| Liberal Centrist Union (UCL) | 248 | 0.01 | New | 0 | ±0 | |
| Spanish Democratic Front (FDE) | 242 | 0.01 | New | 0 | ±0 | |
| Blank ballots | 38,805 | 1.46 | +0.26 | |||
| Total | 2,656,552 | 32 | ±0 | |||
| Valid votes | 2,656,552 | 99.35 | ±0.00 | |||
| Invalid votes | 17,468 | 0.65 | ±0.00 | |||
| Votes cast / turnout | 2,674,020 | 77.71 | +5.01 | |||
| Abstentions | 766,872 | 22.29 | –5.01 | |||
| Registered voters | 3,440,892 | |||||
| Sources[7][25] | ||||||
Autonomous cities
Ceuta
| Parties and coalitions | Popular vote | Seats | ||||
|---|---|---|---|---|---|---|
| Votes | % | ±pp | Total | +/− | ||
| People's Party (PP) | 21,142 | 59.24 | +11.65 | 1 | ±0 | |
| Spanish Socialist Workers' Party (PSOE) | 12,769 | 35.78 | +17.78 | 0 | ±0 | |
| Socialist Party of the People of Ceuta (PSPC) | 807 | 2.26 | –0.32 | 0 | ±0 | |
| United Left (IU) | 218 | 0.61 | –0.14 | 0 | ±0 | |
| The Phalanx (FE) | 116 | 0.33 | +0.03 | 0 | ±0 | |
| National Democracy (DN) | 62 | 0.17 | New | 0 | ±0 | |
| Republican Left (IR) | 37 | 0.10 | New | 0 | ±0 | |
| Spanish Democratic Party (PADE) | 25 | 0.07 | –0.01 | 0 | ±0 | |
| Blank ballots | 515 | 1.44 | –0.19 | |||
| Total | 35,691 | 1 | ±0 | |||
| Valid votes | 35,691 | 99.11 | +0.08 | |||
| Invalid votes | 319 | 0.89 | –0.08 | |||
| Votes cast / turnout | 36,010 | 63.45 | +8.30 | |||
| Abstentions | 20,741 | 36.55 | –8.30 | |||
| Registered voters | 56,751 | |||||
| Sources[7][26] | ||||||
Melilla
| Parties and coalitions | Popular vote | Seats | ||||
|---|---|---|---|---|---|---|
| Votes | % | ±pp | Total | +/− | ||
| People's Party (PP) | 14,856 | 54.60 | +4.80 | 1 | ±0 | |
| Spanish Socialist Workers' Party (PSOE) | 11,273 | 41.43 | +21.01 | 0 | ±0 | |
| United Left (IU) | 229 | 0.84 | –0.67 | 0 | ±0 | |
| The Greens–Green Group (LV–GV) | 135 | 0.50 | –0.16 | 0 | ±0 | |
| Democratic and Social Centre (CDS) | 89 | 0.33 | New | 0 | ±0 | |
| Republican Left (IR) | 57 | 0.21 | New | 0 | ±0 | |
| The Phalanx (FE) | 46 | 0.17 | –0.01 | 0 | ±0 | |
| Spanish Democratic Party (PADE) | 35 | 0.13 | +0.08 | 0 | ±0 | |
| National Democracy (DN) | 30 | 0.11 | New | 0 | ±0 | |
| Spain 2000 (E–2000) | 22 | 0.08 | New | 0 | ±0 | |
| Blank ballots | 435 | 1.60 | –0.50 | |||
| Total | 27,207 | 1 | ±0 | |||
| Valid votes | 27,207 | 99.18 | –0.10 | |||
| Invalid votes | 225 | 0.82 | +0.10 | |||
| Votes cast / turnout | 27,432 | 55.84 | +1.84 | |||
| Abstentions | 21,697 | 44.16 | –1.84 | |||
| Registered voters | 49,129 | |||||
| Sources[7][27] | ||||||
References
- "14M/Elecciones Generales 2004". especiales.publico.es (in Spanish). Público. Retrieved 6 March 2017.
- "Elecciones Congreso. 14 de marzo de 2004". elecciones.eldiario.es (in Spanish). eldiario.es. Retrieved 8 February 2020.
- Gallagher, Michael (30 July 2012). "Effective threshold in electoral systems". Trinity College, Dublin. Archived from the original on 30 July 2017. Retrieved 22 July 2017.CS1 maint: BOT: original-url status unknown (link)
- Carreras et al. 1989, pp. 1077.
- "Constitución Española". Act of 29 December 1978. Boletín Oficial del Estado (in Spanish). Retrieved 27 December 2016.
- "Ley Orgánica 5/1985, de 19 de junio, del Régimen Electoral General". Organic Law No. 5 of 19 June 1985. Boletín Oficial del Estado (in Spanish). Retrieved 28 December 2016.
- "General election 14 March 2004". historiaelectoral.com (in Spanish). Electoral History. Retrieved 24 September 2017.
- "Electoral Results Consultation. Congress. March 2004. National totals". www.infoelectoral.mir.es (in Spanish). Ministry of the Interior. Retrieved 24 September 2017.
- "Electoral Results Consultation. Congress. March 2004. Andalusia". www.infoelectoral.mir.es (in Spanish). Ministry of the Interior. Retrieved 24 September 2017.
- "Electoral Results Consultation. Congress. March 2004. Aragon". www.infoelectoral.mir.es (in Spanish). Ministry of the Interior. Retrieved 24 September 2017.
- "Electoral Results Consultation. Congress. March 2004. Principality of Asturias". www.infoelectoral.mir.es (in Spanish). Ministry of the Interior. Retrieved 24 September 2017.
- "Electoral Results Consultation. Congress. March 2004. Balearic Islands". www.infoelectoral.mir.es (in Spanish). Ministry of the Interior. Retrieved 24 September 2017.
- "Electoral Results Consultation. Congress. March 2004. Basque Country". www.infoelectoral.mir.es (in Spanish). Ministry of the Interior. Retrieved 24 September 2017.
- "Electoral Results Consultation. Congress. March 2004. Canary Islands". www.infoelectoral.mir.es (in Spanish). Ministry of the Interior. Retrieved 24 September 2017.
- "Electoral Results Consultation. Congress. March 2004. Cantabria". www.infoelectoral.mir.es (in Spanish). Ministry of the Interior. Retrieved 24 September 2017.
- "Electoral Results Consultation. Congress. March 2004. Castile and León". www.infoelectoral.mir.es (in Spanish). Ministry of the Interior. Retrieved 24 September 2017.
- "Electoral Results Consultation. Congress. March 2004. Castilla–La Mancha". www.infoelectoral.mir.es (in Spanish). Ministry of the Interior. Retrieved 24 September 2017.
- "Electoral Results Consultation. Congress. March 2004. Catalonia". www.infoelectoral.mir.es (in Spanish). Ministry of the Interior. Retrieved 24 September 2017.
- "Electoral Results Consultation. Congress. March 2004. Extremadura". www.infoelectoral.mir.es (in Spanish). Ministry of the Interior. Retrieved 24 September 2017.
- "Electoral Results Consultation. Congress. March 2004. Galicia". www.infoelectoral.mir.es (in Spanish). Ministry of the Interior. Retrieved 24 September 2017.
- "Electoral Results Consultation. Congress. March 2004. La Rioja". www.infoelectoral.mir.es (in Spanish). Ministry of the Interior. Retrieved 24 September 2017.
- "Electoral Results Consultation. Congress. March 2004. Community of Madrid". www.infoelectoral.mir.es (in Spanish). Ministry of the Interior. Retrieved 24 September 2017.
- "Electoral Results Consultation. Congress. March 2004. Region of Murcia". www.infoelectoral.mir.es (in Spanish). Ministry of the Interior. Retrieved 24 September 2017.
- "Electoral Results Consultation. Congress. March 2004. Foral Community of Navarre". www.infoelectoral.mir.es (in Spanish). Ministry of the Interior. Retrieved 24 September 2017.
- "Electoral Results Consultation. Congress. March 2004. Valencian Community". www.infoelectoral.mir.es (in Spanish). Ministry of the Interior. Retrieved 24 September 2017.
- "Electoral Results Consultation. Congress. March 2004. Ceuta". www.infoelectoral.mir.es (in Spanish). Ministry of the Interior. Retrieved 24 September 2017.
- "Electoral Results Consultation. Congress. March 2004. Melilla". www.infoelectoral.mir.es (in Spanish). Ministry of the Interior. Retrieved 24 September 2017.
Bibliography
- Carreras, Albert; Tafunell, Xavier; Soler, Raimon; Fontana, Josep (2005) [1989]. Estadísticas históricas de España, siglos XIX-XX (PDF) (in Spanish). Volume 1 (II ed.). Bilbao: Fundación BBVA. pp. 1072–1097. ISBN 84-96515-00-1. Archived from the original (PDF) on 24 September 2015.
| General elections |
|
|---|---|
| Presidential elections | |
| European elections | |
| Local elections | |
| Regional elections | |
| Referendums | |
| |