Pehuajó
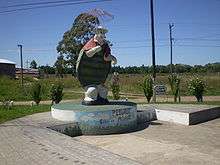
Pehuajó (Spanish pronunciation: [pewaˈxo]) is a city in the Pehuajó Partido (Pehuajó district) in the province of Buenos Aires, Argentina. The partido has about 38,400 inhabitants as per the 2001 census [INDEC]. The name of this relatively small city is well known in Argentina because of María Elena Walsh's song Manuelita, about an adventurous turtle (tortoise); a dilapidated concrete statue of María Elena Walsh's Manuelita lies just outside the city, beside Ruta Nacional ("National Route") 5.[1]
Pehuajó | |
|---|---|
City | |
 Flag  Coat of arms | |
 Pehuajó Location in Argentina | |
| Coordinates: 35°48′S 61°54′W | |
| Country | |
| Province | |
| Partido | Pehuajó |
| Founded | July 3, 1881 |
| Government | |
| • Intendant | Pablo Javier Zurro (FPV) |
| Area | |
| • City | 17.66 km2 (6.82 sq mi) |
| • Urban | 10.40 km2 (4.02 sq mi) |
| Elevation | 83.5 m (274.0 ft) |
| Population (2010 census) | |
| • City | 31,553 |
| CPA Base | B 6450 |
| Area code(s) | +54 2396 |
| Climate | Cfa |
| Website | Official website |
Climate
Pehuajó has a humid subtropical climate (Köppen climate classification Cfa).[2] Winters are characterized with moderate temperatures during the day and cold nights with a July mean of 8.3 °C (46.9 °F).[3][4] During this time of the year, overcast days are more common, averaging 8–10 days per month.[3] Spring and fall are transition seasons featuring warm daytime temperatures and cool nighttime temperatures and are highly variable with some days reaching 37.7 °C (99.9 °F) and below −5 °C (23.0 °F).[3] Summers are hot with a January high of 30.4 °C (86.7 °F) followed by mild nights, averaging 15.7 °C (60.3 °F).[3] The average relative humidity is 75%, with the summer months being drier than the winter months.[4] The average first date of frost is on May 22 while the last date of frost is on September 11.[5] The city is moderately windy throughout the entire year with windspeeds ranging from a low of 9.0 kilometres per hour (5.6 mph) in June to 15.7 kilometres per hour (9.8 mph) in October and November.[3] On average, Pehuajó receives 945.3 millimetres (37 in) of precipitation per year with 83 days with measureable precipitation with summer months being more wetter than the winter months, where most of the precipitation falls in the form of thunderstorms.[4][6] Pehuajó receives approximately 2,720.1 hours of sunshine per year or 60% of possible sunshine per year, ranging from a low of 41% in June (only 120.0 hours of sunshine per month) to a high of 74% in March (279.7 hours of sunshine per month).[7][8][9] The highest recorded temperature was 43.4 °C (110.1 °F) on December 29, 1971 while the lowest recorded temperature was −10.8 °C (12.6 °F) on July 17, 1995.[5]
| Climate data for Pehuajó (1981–2010, extremes 1970–present) | |||||||||||||
|---|---|---|---|---|---|---|---|---|---|---|---|---|---|
| Month | Jan | Feb | Mar | Apr | May | Jun | Jul | Aug | Sep | Oct | Nov | Dec | Year |
| Record high °C (°F) | 42.8 (109.0) |
39.1 (102.4) |
37.7 (99.9) |
33.5 (92.3) |
30.6 (87.1) |
24.6 (76.3) |
27.7 (81.9) |
36.0 (96.8) |
31.8 (89.2) |
40.0 (104.0) |
37.2 (99.0) |
43.4 (110.1) |
43.4 (110.1) |
| Average high °C (°F) | 29.6 (85.3) |
28.3 (82.9) |
26.1 (79.0) |
22.0 (71.6) |
17.9 (64.2) |
14.4 (57.9) |
14.0 (57.2) |
16.7 (62.1) |
18.8 (65.8) |
22.0 (71.6) |
25.3 (77.5) |
28.3 (82.9) |
22.0 (71.6) |
| Daily mean °C (°F) | 22.5 (72.5) |
21.3 (70.3) |
19.2 (66.6) |
15.3 (59.5) |
11.8 (53.2) |
8.6 (47.5) |
8.0 (46.4) |
9.9 (49.8) |
12.3 (54.1) |
15.6 (60.1) |
18.6 (65.5) |
21.4 (70.5) |
15.4 (59.7) |
| Average low °C (°F) | 16.1 (61.0) |
14.9 (58.8) |
13.4 (56.1) |
9.9 (49.8) |
6.7 (44.1) |
3.9 (39.0) |
3.0 (37.4) |
4.2 (39.6) |
6.3 (43.3) |
9.9 (49.8) |
12.5 (54.5) |
14.9 (58.8) |
9.6 (49.3) |
| Record low °C (°F) | 5.1 (41.2) |
4.3 (39.7) |
−0.5 (31.1) |
−6.7 (19.9) |
−5.7 (21.7) |
−7.2 (19.0) |
−7.5 (18.5) |
−7.8 (18.0) |
−5.3 (22.5) |
−3.6 (25.5) |
−1.8 (28.8) |
1.7 (35.1) |
−7.8 (18.0) |
| Average precipitation mm (inches) | 119.6 (4.71) |
101.2 (3.98) |
149.3 (5.88) |
79.9 (3.15) |
49.0 (1.93) |
25.8 (1.02) |
24.0 (0.94) |
28.8 (1.13) |
63.6 (2.50) |
116.1 (4.57) |
104.3 (4.11) |
107.0 (4.21) |
968.6 (38.13) |
| Average precipitation days (≥ 0.1 mm) | 8.6 | 6.6 | 8.8 | 6.5 | 5.3 | 4.5 | 4.5 | 4.1 | 5.9 | 9.2 | 8.0 | 8.8 | 80.8 |
| Average relative humidity (%) | 69.9 | 73.5 | 77.6 | 78.4 | 80.3 | 82.0 | 79.8 | 74.2 | 72.6 | 73.1 | 70.0 | 67.9 | 74.9 |
| Mean monthly sunshine hours | 322.4 | 279.7 | 251.1 | 213.0 | 176.7 | 120.0 | 136.4 | 195.3 | 213.0 | 232.5 | 270.0 | 310.0 | 2,720.1 |
| Percent possible sunshine | 72 | 74 | 66 | 63 | 55 | 41 | 45 | 58 | 60 | 58 | 64 | 68 | 60 |
| Source 1: Servicio Meteorológico Nacional[10] | |||||||||||||
| Source 2: Oficina de Riesgo Agropecuario (record highs and lows),[5] UNLP (sun only)[7] | |||||||||||||
Notes and references
- Chiappe, Luis M.; Dingus, Lowell (2001). Walking on Eggs: The Astonishing Discovery of Thousands of Dinosaur Eggs in the Badlands of Patagonia. New York: Scribner. p. 41. ISBN 978-0-7432-1211-3.
- Peel, M. C. and Finlayson, B. L. and McMahon, T. A. (2007). "Updated world map of the Köppen–Geiger climate classification" (PDF). Hydrol. Earth Syst. Sci. 11: 1633–1644. doi:10.5194/hess-11-1633-2007. ISSN 1027-5606.CS1 maint: multiple names: authors list (link)
- "Datos Estadísticos (Período 1981-1990)" (in Spanish). Servicio Meteorológico Nacional. Retrieved June 15, 2015.
- "Pehuajó Aero Climate Normals 1961–1990". National Oceanic and Atmospheric Administration. Retrieved March 23, 2015.
- "Pehuajó, Buenos Aires". Estadísticas meteorológicas decadiales (in Spanish). Oficina de Riesgo Agropecuario. Retrieved June 15, 2015.
- "Valores Medios de Temperatura y Precipitación-Buenos Aires: Pehuajó" (in Spanish). Servicio Meteorológico Nacional. Retrieved March 30, 2015.
- "Datos bioclimáticos de 173 localidades argentinas". Atlas Bioclimáticos (in Spanish). Universidad Nacional de La Plata. Retrieved June 15, 2015.
- "Datos bioclimáticos de 173 localidades argentinas–Junio". Atlas Bioclimáticos (in Spanish). Universidad Nacional de La Plata. Retrieved June 15, 2015.
- "Datos bioclimáticos de 173 localidades argentinas–Marzo". Atlas Bioclimáticos (in Spanish). Universidad Nacional de La Plata. Retrieved June 15, 2015.
- "Estadísticas Climatológicas Normales - período 1981-2010" (in Spanish). Servicio Meteorológico Nacional. Retrieved January 21, 2018.
External links
- Municipal information: Municipal Affairs Federal Institute (IFAM), Municipal Affairs Secretariat, Ministry of Interior, Argentina. (in Spanish)
- (in Spanish) Municipal website