Nuclear weapon yield
The explosive yield of a nuclear weapon is the amount of energy released when that particular nuclear weapon is detonated, usually expressed as a TNT equivalent (the standardized equivalent mass of trinitrotoluene which, if detonated, would produce the same energy discharge), either in kilotons (kt—thousands of tons of TNT), in megatons (Mt—millions of tons of TNT), or sometimes in terajoules (TJ). An explosive yield of one terajoule is equal to 0.239 kilotonnes of TNT. Because the accuracy of any measurement of the energy released by TNT has always been problematic, the conventional definition is that one kiloton of TNT is held simply to be equivalent to 1012 calories.
The yield-to-weight ratio is the amount of weapon yield compared to the mass of the weapon. The practical maximum yield-to-weight ratio for fusion weapons (thermonuclear weapons) has been estimated to six megatons of TNT per metric ton of bomb mass (25 TJ/kg). Yields of 5.2 megatons/ton and higher have been reported for large weapons constructed for single-warhead use in the early 1960s.[1] Since then, the smaller warheads needed to achieve the increased net damage efficiency (bomb damage/bomb mass) of multiple warhead systems have resulted in decreases in the yield/mass ratio for single modern warheads.
Examples of nuclear weapon yields
In order of increasing yield (most yield figures are approximate):
| Bomb | Yield | Notes | |
|---|---|---|---|
| kt TNT | TJ | ||
| Davy Crockett | 0.02 | 0.084 | Variable yield tactical nuclear weapon—mass only 23 kg (51 lb), lightest ever deployed by the United States (same warhead as Special Atomic Demolition Munition and GAR-11 Nuclear Falcon missile). |
| AIR-2 Genie | 1.5 | 6.3 | An unguided air-to-air rocket armed with a W25 nuclear warhead developed to intercept bomber squadrons. |
| Hiroshima's "Little Boy" gravity bomb | 13–18 | 54–75 | Gun type uranium-235 fission bomb (the first of the two nuclear weapons that have been used in warfare). |
| Nagasaki's "Fat Man" gravity bomb | 19–23 | 79–96 | Implosion type plutonium-239 fission bomb (the second of the two nuclear weapons used in warfare). |
| W76 warhead | 100 | 420 | Twelve of these may be in a MIRVed Trident II missile; treaty limited to eight. |
| W87 warhead | 300 | 1,300 | Ten of these were in a MIRVed LGM-118A Peacekeeper. |
| W88 warhead | 475 | 1,990 | Twelve of these may be in a Trident II missile; treaty limited to eight. |
| Ivy King device | 500 | 2,100 | Most powerful US pure fission bomb,[2] 60 kg uranium, implosion type. Never deployed. |
| Orange Herald Small | 720 | 3,000 | Most powerful tested UK boosted fission missile warhead. |
| B83 nuclear bomb | 1,200 | 5,000 | Variable yield weapon, most powerful US weapon in active service. |
| B53 nuclear bomb | 9,000 | 38,000 | Was the most powerful US bomb in active service until 1997. 50 were retained as part of the "Hedge" portion of the Enduring Stockpile until completely dismantled in 2011.[3] The Mod 11 variant of the B61 replaced the B53 in the bunker busting role. The W53 warhead from the weapon was used on the Titan II Missile until the system was decommissioned in 1987. |
| Castle Bravo device | 15,000 | 63,000 | Most powerful US test.[4] Never deployed. |
| EC17/Mk-17, the EC24/Mk-24, and the B41 (Mk-41) | 25,000 | 100,000 | Most powerful US weapons ever: 25 megatonnes of TNT (100 PJ); the Mk-17 was also the largest by area square footage and mass cubic footage: about 20 short tons (18,000 kg). The Mk-41 or B41 had a mass of 4800 kg and yield of 25 Mt; this equates to being the highest yield-to-weight weapon ever produced. All were gravity bombs carried by the B-36 bomber (retired by 1957). |
| The entire Operation Castle nuclear test series | 48,200 | 202,000 | The highest-yielding test series conducted by the US. |
| Tsar Bomba device | 50,000 | 210,000 | USSR, most powerful nuclear weapon ever detonated, yield of 50 megatons, (50 million tons of TNT). In its "final" form (i.e. with a depleted uranium tamper instead of one made of lead) it would have been 100 megatons. |
| All nuclear testing as of 1996 | 510,300 | 2,135,000 | Total energy expended during all nuclear testing. |
As a comparison, the blast yield of the GBU-43 Massive Ordnance Air Blast bomb is 0.011 kt, and that of the Oklahoma City bombing, using a truck-based fertilizer bomb, was 0.002 kt. Most artificial non-nuclear explosions are considerably smaller than even what are considered to be very small nuclear weapons.
Yield limits
The yield-to-weight ratio is the amount of weapon yield compared to the mass of the weapon. According to nuclear-weapons designer Ted Taylor, the practical maximum yield-to-weight ratio for fusion weapons is about 6 megatons of TNT per metric ton (25 TJ/kg).[8] The "Taylor limit" is not derived from first principles, and weapons with yields as high as 9.5 megatons per metric ton have been theorized.[9] The highest achieved values are somewhat lower, and the value tends to be lower for smaller, lighter weapons, of the sort that are emphasized in today's arsenals, designed for efficient MIRV use, or delivery by cruise missile systems.
- The 25 Mt yield option reported for the B41 would give it a yield-to-weight ratio of 5.1 megatons of TNT per metric ton. While this would require a far greater efficiency than any other current U.S. weapon (at least 40% efficiency in a fusion fuel of lithium deuteride), this was apparently attainable, probably by the use of higher than normal Lithium-6 enrichment in the lithium deuteride fusion fuel. This results in the B41 still retaining the record for the highest yield-to-weight weapon ever designed.[9]
- The W56 demonstrated a yield-to-weight ratio of 4.96 kt per kg of device mass, and very close to the predicted 5.1 kt/kg achievable in the highest yield to weight weapon ever built, the 25 megaton B41. Unlike the B41, which was never proof tested at full yield, the W56 demonstrated its efficiency in the XW-56X2 Bluestone shot of Operation Dominic in 1962,[10] thus, from information available in the public domain, the W56 may hold the distinction of demonstrating the highest efficiency in a nuclear weapon to date.
- In 1963 DOE declassified statements that the U.S. had the technological capability of deploying a 35 Mt warhead on the Titan II, or a 50-60 Mt gravity bomb on B-52s. Neither weapon was pursued, but either would require yield-to-weight ratios superior to a 25 Mt Mk-41. This may have been achievable by utilizing the same design as the B41 but with the addition of a HEU tamper, in place of the cheaper but lower energy density U-238 tamper which is the most commonly used tamper material in Teller-Ulam thermonuclear weapons.
- For current smaller US weapons, yield is 600 to 2200 kilotons of TNT per metric ton. By comparison, for the very small tactical devices such as the Davy Crockett it was 0.4 to 40 kilotons of TNT per metric ton. For historical comparison, for Little Boy the yield was only 4 kilotons of TNT per metric ton, and for the largest Tsar Bomba, the yield was 2 megatons of TNT per metric ton (deliberately reduced from about twice as much yield for the same weapon, so there is little doubt that this bomb as designed was capable of 4 megatons per ton yield).
- The largest pure-fission bomb ever constructed, Ivy King, had a 500 kiloton yield,[2] which is probably in the range of the upper limit on such designs. Fusion boosting could likely raise the efficiency of such a weapon significantly, but eventually all fission-based weapons have an upper yield limit due to the difficulties of dealing with large critical masses. (The UK's Orange Herald was a very large boosted fission bomb, with a yield of 750 kilotons.) However, there is no known upper yield limit for a fusion bomb.
Large single warheads are seldom a part of today's arsenals, since smaller MIRV warheads, spread out over a pancake-shaped destructive area, are far more destructive for a given total yield, or unit of payload mass. This effect results from the fact that destructive power of a single warhead on land scales approximately only as the cube root of its yield, due to blast "wasted" over a roughly hemispherical blast volume while the strategic target is distributed over a circular land area with limited height and depth. This effect more than makes up for the lessened yield/mass efficiency encountered if ballistic missile warheads are individually scaled down from the maximal size that could be carried by a single-warhead missile.
Milestone nuclear explosions
The following list is of milestone nuclear explosions. In addition to the atomic bombings of Hiroshima and Nagasaki, the first nuclear test of a given weapon type for a country is included, and tests which were otherwise notable (such as the largest test ever). All yields (explosive power) are given in their estimated energy equivalents in kilotons of TNT (see TNT equivalent). Putative tests (like Vela Incident) have not been included.
| Date | Name | Yield (kt) |
Country | Significance |
|---|---|---|---|---|
| July 16, 1945 | Trinity | 18–20 | United States | First fission device test, first plutonium implosion detonation |
| August 6, 1945 | Little Boy | 12–18 | United States | Bombing of Hiroshima, Japan, first detonation of a uranium gun-type device, first use of a nuclear device in combat. |
| August 9, 1945 | Fat Man | 18–23 | United States | Bombing of Nagasaki, Japan, second detonation of a plutonium implosion device (the first being the Trinity Test), second and last use of a nuclear device in combat. |
| August 29, 1949 | RDS-1 | 22 | Soviet Union | First fission weapon test by the Soviet Union |
| October 3, 1952 | Hurricane | 25 | United Kingdom | First fission weapon test by the United Kingdom |
| November 1, 1952 | Ivy Mike | 10,400 | United States | First cryogenic fusion fuel "staged" thermonuclear weapon, primarily a test device and not weaponized |
| November 16, 1952 | Ivy King | 500 | United States | Largest pure-fission weapon ever tested |
| August 12, 1953 | Joe 4 | 400 | Soviet Union | First fusion weapon test by the Soviet Union (not "staged") |
| March 1, 1954 | Castle Bravo | 15,000 | United States | First dry fusion fuel "staged" thermonuclear weapon; a serious nuclear fallout accident occurred; largest nuclear detonation conducted by United States |
| November 22, 1955 | RDS-37 | 1,600 | Soviet Union | First "staged" thermonuclear weapon test by the Soviet Union (deployable) |
| May 31, 1957 | Orange Herald | 720 | United Kingdom | Largest boosted fission weapon ever tested. Intended as a fallback "in megaton range" in case British thermonuclear development failed. |
| November 8, 1957 | Grapple X | 1,800 | United Kingdom | First (successful) "staged" thermonuclear weapon test by the United Kingdom |
| February 13, 1960 | Gerboise Bleue | 70 | France | First fission weapon test by France |
| October 31, 1961 | Tsar Bomba | 50,000 | Soviet Union | Largest thermonuclear weapon ever tested—scaled down from its initial 100 Mt design by 50% |
| October 16, 1964 | 596 | 22 | China | First fission weapon test by the People's Republic of China |
| June 17, 1967 | Test No. 6 | 3,300 | China | First "staged" thermonuclear weapon test by the People's Republic of China |
| August 24, 1968 | Canopus | 2,600 | France | First "staged" thermonuclear weapon test by France |
| May 18, 1974 | Smiling Buddha | 12 | India | First fission nuclear explosive test by India |
| May 11, 1998 | Pokhran-II | 45–50 | India | First potential fusion-boosted weapon test by India; first deployable fission weapon test by India |
| May 28, 1998 | Chagai-I | 40 | Pakistan | First fission weapon (boosted) test by Pakistan[11] |
| October 9, 2006 | 2006 nuclear test | under 1 | North Korea | First fission weapon test by North Korea (plutonium-based) |
| September 3, 2017 | 2017 nuclear test | 200–300 | North Korea | First "staged" thermonuclear weapon test claimed by North Korea |
- Note
- "Staged" refers to whether it was a "true" hydrogen bomb of the so-called Teller-Ulam configuration or simply a form of a boosted fission weapon. For a more complete list of nuclear test series, see List of nuclear tests. Some exact yield estimates, such as that of the Tsar Bomba and the tests by India and Pakistan in 1998, are somewhat contested among specialists.
Calculating yields and controversy
Yields of nuclear explosions can be very hard to calculate, even using numbers as rough as in the kiloton or megaton range (much less down to the resolution of individual terajoules). Even under very controlled conditions, precise yields can be very hard to determine, and for less controlled conditions the margins of error can be quite large. For fission devices, the most precise yield value is found from "radiochemical/Fallout analysis"; that is, measuring the quantity of fission products generated, in much the same way as the chemical yield in chemical reaction products can be measured after a chemical reaction. The radiochemical analysis method was pioneered by Herbert L. Anderson.
For nuclear explosive devices where the fallout is not attainable or would be misleading, neutron activation analysis is often employed as the second most accurate method, with it having been used to determine the yield of both Little Boy[12][13] and thermonuclear Ivy Mike's[14] respective yields. Yields can also be inferred in a number of other remote sensing ways, including scaling law calculations based on blast size, infrasound, fireball brightness (Bhangmeter), seismographic data (CTBTO),[15] and the strength of the shock wave.
| Blast | 50% |
| Thermal energy | 35% |
| Initial ionizing radiation | 5% |
| Residual fallout radiation | 10% |
Enrico Fermi famously made a (very) rough calculation of the yield of the Trinity test by dropping small pieces of paper in the air and measuring how far they were moved by the blast wave of the explosion; that is, he found the blast pressure at his distance from the detonation in pounds per square inch, using the deviation of the papers' fall away from the vertical as a crude blast gauge/barograph, and then with pressure X in psi, at distance Y, in miles figures, he extrapolated backwards to estimate the yield of the Trinity device, which he found was about 10 kiloton of blast energy.[19][20]
Fermi later recalled that:
I was stationed at the Base Camp at Trinity in a position about ten miles[16 km] from the site of the explosion...About 40 seconds after the explosion the air blast reached me. I tried to estimate its strength by dropping from about six feet small pieces of paper before, during, and after the passage of the blast wave. Since, at the time, there was no wind I could observe very distinctly and actually measure the displacement of the pieces of paper that were in the process of falling while the blast was passing. The shift was about 2 1/2 meters, which, at the time, I estimated to correspond to the blast that would be produced by ten thousand tons of T.N.T.[21][22][23]
The surface area (A) and volume (V) of a sphere are: and respectively.


The blast wave however was likely assumed to grow out as the surface area of the approximately hemispheric near surface burst blast wave of the Trinity gadget. The paper is moved 2.5 meters by the wave - so the effect of the Trinity device is to displace a hemispherical shell of air of volume 2.5 m × 2π(14 km)2. Multiply by 1 atm to get energy of 3×10¹⁴ J ~ 80 kT TN.
A good approximation of the yield of the Trinity test device was obtained in 1950 from simple dimensional analysis as well as an estimation of the heat capacity for very hot air, by the British physicist G. I. Taylor. Taylor had initially done this highly classified work in mid-1941, and published a paper which included an analysis of the Trinity data fireball when the Trinity photograph data was declassified in 1950 (after the USSR had exploded its own version of this bomb).
Taylor noted that the radius R of the blast should initially depend only on the energy E of the explosion, the time t after the detonation, and the density ρ of the air. The only equation having compatible dimensions that can be constructed from these quantities is:

Here S is a dimensionless constant having a value approximately equal to 1, since it is low order function of the heat capacity ratio or adiabatic index

which is approximately 1 for all conditions.
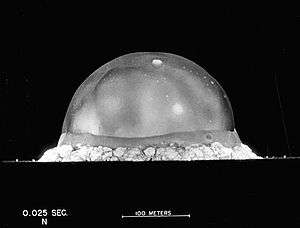
Using the picture of the Trinity test shown here (which had been publicly released by the U.S. government and published in Life magazine), using successive frames of the explosion, Taylor found that R5/t2 is a constant in a given nuclear blast (especially between 0.38 ms after the shock wave has formed, and 1.93 ms before significant energy is lost by thermal radiation). Furthermore, he estimated a value for S numerically at 1.
Thus, with t = 0.025 s and the blast radius was 140 metres, and taking ρ to be 1 kg/m3 (the measured value at Trinity on the day of the test, as opposed to sea level values of approximately 1.3 kg/m3) and solving for E, Taylor obtained that the yield was about 22 kilotons of TNT (90 TJ). This does not take into account the fact that the energy should only be about half this value for a hemispherical blast, but this very simple argument did agree to within 10% with the official value of the bomb's yield in 1950, which was 20 kilotons of TNT (84 TJ) (See G. I. Taylor, Proc. Roy. Soc. London A 200, pp. 235–247 (1950).)
A good approximation to Taylor's constant S for below about 2 is:


[24] The value of the heat capacity ratio here is between the 1.67 of fully dissociated air molecules and the lower value for very hot diatomic air (1.2), and under conditions of an atomic fireball is (coincidentally) close to the S.T.P. (standard) gamma for room temperature air, which is 1.4. This gives the value of Taylor's S constant to be 1.036 for the adiabatic hypershock region where the constant R5/t2 condition holds.
As it relates to fundamental dimensional analysis, if one expresses all the variables in terms of mass, M, length, L, and time, T :[25]

(think of the expression for kinetic energy,


and then derive an expression for, say, E, in terms of the other variables, by finding values of , , and in the general relation


such that the left- and right-hand sides are dimensionally balanced in terms of M, L, and T (i.e., each dimension has the same exponent on both sides).
Other methods and controversy
Where these data are not available, as in a number of cases, precise yields have been in dispute, especially when they are tied to questions of politics. The weapons used in the atomic bombings of Hiroshima and Nagasaki, for example, were highly individual and very idiosyncratic designs, and gauging their yield retrospectively has been quite difficult. The Hiroshima bomb, "Little Boy", is estimated to have been between 12 and 18 kilotonnes of TNT (50 and 75 TJ) (a 20% margin of error), while the Nagasaki bomb, "Fat Man", is estimated to be between 18 and 23 kilotonnes of TNT (75 and 96 TJ) (a 10% margin of error). Such apparently small changes in values can be important when trying to use the data from these bombings as reflective of how other bombs would behave in combat, and also result in differing assessments of how many "Hiroshima bombs" other weapons are equivalent to (for example, the Ivy Mike hydrogen bomb was equivalent to either 867 or 578 Hiroshima weapons — a rhetorically quite substantial difference — depending on whether one uses the high or low figure for the calculation). Other disputed yields have included the massive Tsar Bomba, whose yield was claimed between being "only" 50 megatonnes of TNT (210 PJ) or at a maximum of 57 megatonnes of TNT (240 PJ) by differing political figures, either as a way for hyping the power of the bomb or as an attempt to undercut it.
See also
- Effects of nuclear explosions — goes into detail about different effects at different yields
- List of nuclear weapons
References
- The B-41 Bomb
- "Complete List of All U.S. Nuclear Weapons". http://nuclearweaponarchive.org. October 14, 2006. Retrieved August 29, 2014. External link in
|website=(help) - Ackerman, Spencer (October 23, 2011). "Last Nuclear 'Monster Weapon' Gets Dismantled". Wired. Retrieved 23 October 2011.
- Rowberry, Ariana. "Castle Bravo: The Largest U.S. Nuclear Explosion". Brookings Institution. Retrieved 23 September 2017.
- Walker, John (June 2005). "Nuclear Bomb Effects Computer". Fourmilab. Retrieved 2009-11-22.
- Walker, John (June 2005). "Nuclear Bomb Effects Computer Revised Edition 1962, Based on Data from The Effects of Nuclear Weapons, Revised Edition". Fourmilab. Retrieved 2009-11-22.
The maximum fireball radius presented on the computer is an average between that for air and surface bursts. Thus, the fireball radius for a surface burst is 13 percent larger than that indicated and for an air burst, 13 percent smaller.
- Walker, John (June 2005). "Nuclear Bomb Effects Computer". Fourmilab. Retrieved 2009-11-22.
- Carey Sublette. "The B-41 (Mk-41) Bomb".
- Franco Cozzani (July 26, 2011), FISSION, FUSION AND STAGING: A bird's view at the core concepts of nuclear weapon design and the curious ideas about it, IERI, retrieved February 3, 2017
- http://nuclearweaponarchive.org/Usa/Tests/Dominic.html
- "Pakistan Nuclear Weapons: A Brief History of Pakistan's Nuclear Program". Federation of American Scientists. 11 December 2002. Retrieved 30 October 2019.
- Kerr, George D.; Young, Robert W.; Cullings, Harry M.; Christy, Robert F. (2005). "Bomb Parameters" (PDF). In Robert W. Young, George D. Kerr (ed.). Reassessment of the Atomic Bomb Radiation Dosimetry for Hiroshima and Nagasaki – Dosimetry System 2002. The Radiation Effects Research Foundation. pp. 42–43.
- Malik, John (September 1985). "The Yields of the Hiroshima and Nagasaki Explosions" (PDF). Los Alamos National Laboratory. Retrieved March 9, 2014.
- US Army (1952). Operation Ivy Final Report Joint Task Force 132 (PDF).
- Estimating the yields of nuclear explosions. chapter 7. Seismic verification of nuclear testing treaties.
- "CHAPTER 3 EFFECTS OF NUCLEAR EXPLOSIONS SECTION I – GENERAL".
- NUCLEAR EVENTS AND THEIR CONSEQUENCES by the Borden institute..."approximately 82% of the fission energy is released as kinetic energy of the two large fission fragments. These fragments, being massive and highly charged particles, interact readily with matter. They transfer their energy quickly to the surrounding weapon materials, which rapidly become heated"
- "Nuclear Engineering Overview The various energies emitted per fission event pg 4. "167 MeV" is emitted by means of the repulsive electrostatic energy between the 2 daughter nuclei, which takes the form of the "kinetic energy" of the fission fragments, this kinetic energy results in both later blast and thermal effects. "5 MeV" is released in prompt or initial gamma radiation, "5 MeV" in prompt neutron radiation (99.36% of total), "7 MeV" in delayed neutron energy (0.64%) and "13 MeV" in beta decay and gamma decay(residual radiation)" (PDF). Technical University Vienna. Archived from the original (PDF) on May 15, 2018.
- Article featuring Jack Aeby talking about his photograph
- Rhodes 1986, pp. 674–677.
- My Observations During the Explosion at Trinity on July 16, 1945 E. Fermi
- "Trinity Test, July 16, 1945, Eyewitness Accounts - Enrico Fermi". Retrieved November 4, 2014.
- "Eyewitnesses to Trinity" (PDF). Nuclear Weapons Journal, Issue 2 2005. Los Alamos National Laboratory. 2005. p. 45. Retrieved 18 February 2014.
- http://glasstone.blogspot.com/2006/03/analytical-mathematics-for-physical.html.
- San José State University The Expansion of the Fireball of an Explosion Thayer Watkins
External links
| Wikimedia Commons has media related to Nuclear weapon yield. |
- "What was the yield of the Hiroshima bomb?" (excerpt from official report)
- "General Principles of Nuclear Explosions", Chapter 1 in Samuel Glasstone and Phillip Dolan, eds., The Effects of Nuclear Weapons, 3rd edn. (Washington D.C.: U.S. Department of Defense/U.S. Energy Research and Development Administration, 1977); provides information about the relationship of nuclear yields to other effects (radiation, damage, etc.).
- "THE MAY 1998 POKHRAN TESTS: Scientific Aspects", discusses different methods used to determine the yields of the Indian 1998 tests.
- Discusses some of the controversy over the Indian test yields
- "What are the real yields of India's nuclear tests?" from Carey Sublette's NuclearWeaponArchive.org
- High-Yield Nuclear Detonation Effects Simulator
| |||||||||||||||||||||||||||||||||||||||||||||||||||||||
| |||||||||||||||||||||||||||||||||||||||||||||||||||||||
| |||||||||||||||||||||||||||||||||||||||||||||||||||||||