Mambusao
Mambusao, officially the Municipality of Mambusao, is a 3rd class municipality in the province of Capiz, Philippines. According to the 2015 census, it has a population of 39,644 people.[3]
Mambusao | |
|---|---|
| Municipality of Mambusao | |
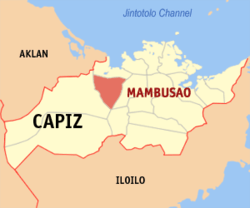 Map of Capiz with Mambusao highlighted | |

| |
.svg.png) Mambusao Location within the Philippines | |
| Coordinates: 11°26′N 122°36′E | |
| Country | |
| Region | Western Visayas (Region VI) |
| Province | Capiz |
| District | 2nd district of Capiz |
| Barangays | 26 (see Barangays) |
| Government | |
| • Type | Sangguniang Bayan |
| • Mayor | Leodegario A. Labao Jr. |
| • Vice Mayor | Wilfredo E. Leal |
| • Congressman | Fredenil H. Castro |
| • Electorate | 28,735 voters (2019) |
| Area | |
| • Total | 136.91 km2 (52.86 sq mi) |
| Elevation | 21.9 m (71.9 ft) |
| Population (2015 census)[3] | |
| • Total | 39,644 |
| • Density | 290/km2 (750/sq mi) |
| • Households | 9,661 |
| Economy | |
| • Income class | 3rd municipal income class |
| • Poverty incidence | 15.62% (2015)[4] |
| • Revenue (₱) | 100,069,485.75 (2016) |
| Time zone | UTC+8 (PST) |
| ZIP code | 5807 |
| PSGC | |
| IDD : area code | +63 (0)36 |
| Climate type | tropical climate |
| Native languages | Capiznon Hiligaynon Tagalog |
It is 36 kilometres (22 mi) from Roxas City.
Its economy is based on agriculture with rice and coconut as the primary products and crops. The annual festival of Mambusao is called "Inilusan" honoring of St. Catherine of Alexandria, the patron saint of the town, celebrated every November 25. Inilusan literally means sharing of dish by neighbors.
Mambusao is the home of the Villareal family, the most famous of whom is Speaker Cornelio "Agurang Coni" Villareal and Governor Cornelio "Dodoy" Villareal. It is also the birthplace of the late Filipino diplomat and politician Roy Señeres.
Barangays
Mambusao is politically subdivided into 26 barangays. [2]
- Atiplo
- Balat-an
- Balit
- Batiano
- Bating
- Bato Bato
- Baye
- Bergante
- Bunga
- Bula
- Bungsi
- Burias
- Caidquid
- Cala-agus
- Libo-o
- Manibad
- Maralag
- Najus-an
- Pangpang Norte
- Pangpang Sur
- Pinay
- Poblacion Proper
- Poblacion Tabuc
- Sinondojan
- Tugas
- Tumalalud
Climate
| Climate data for Mambusao, Capiz | |||||||||||||
|---|---|---|---|---|---|---|---|---|---|---|---|---|---|
| Month | Jan | Feb | Mar | Apr | May | Jun | Jul | Aug | Sep | Oct | Nov | Dec | Year |
| Average high °C (°F) | 27 (81) |
28 (82) |
29 (84) |
31 (88) |
32 (90) |
31 (88) |
30 (86) |
30 (86) |
29 (84) |
29 (84) |
29 (84) |
27 (81) |
29 (85) |
| Average low °C (°F) | 23 (73) |
23 (73) |
23 (73) |
24 (75) |
25 (77) |
25 (77) |
24 (75) |
24 (75) |
24 (75) |
24 (75) |
24 (75) |
23 (73) |
24 (75) |
| Average precipitation mm (inches) | 61 (2.4) |
39 (1.5) |
46 (1.8) |
48 (1.9) |
90 (3.5) |
144 (5.7) |
152 (6.0) |
145 (5.7) |
163 (6.4) |
160 (6.3) |
120 (4.7) |
90 (3.5) |
1,258 (49.4) |
| Average rainy days | 12.3 | 9.0 | 9.9 | 10.0 | 18.5 | 25.0 | 27.4 | 26.0 | 25.9 | 24.9 | 17.9 | 14.2 | 221 |
| Source: Meteoblue [5] | |||||||||||||
Demographics
| Population census of Mambusao | ||
|---|---|---|
| Year | Pop. | ±% p.a. |
| 1903 | 8,225 | — |
| 1918 | 11,913 | +2.50% |
| 1939 | 15,723 | +1.33% |
| 1948 | 18,619 | +1.90% |
| 1960 | 19,504 | +0.39% |
| 1970 | 24,530 | +2.32% |
| 1975 | 28,129 | +2.78% |
| 1980 | 32,097 | +2.67% |
| 1990 | 33,213 | +0.34% |
| 1995 | 35,632 | +1.33% |
| 2000 | 36,793 | +0.69% |
| 2007 | 37,498 | +0.26% |
| 2010 | 37,672 | +0.17% |
| 2015 | 39,644 | +0.98% |
| Source: Philippine Statistics Authority[3][6][7][8] | ||
In the 2015 census, the population of Mambusao was 39,644 people,[3] with a density of 290 inhabitants per square kilometre or 750 inhabitants per square mile.
References
- "Municipality". Quezon City, Philippines: Department of the Interior and Local Government. Retrieved 31 May 2013.
- "Province: Capiz". PSGC Interactive. Quezon City, Philippines: Philippine Statistics Authority. Retrieved 12 November 2016.
- Census of Population (2015). "Region VI (Western Visayas)". Total Population by Province, City, Municipality and Barangay. PSA. Retrieved 20 June 2016.
- "PSA releases the 2015 Municipal and City Level Poverty Estimates". Quezon City, Philippines. Retrieved 12 October 2019.
- "Mambusao: Average Temperatures and Rainfall". Meteoblue. Retrieved 2 May 2020.
- Census of Population and Housing (2010). "Region VI (Western Visayas)". Total Population by Province, City, Municipality and Barangay. NSO. Retrieved 29 June 2016.
- Censuses of Population (1903–2007). "Region VI (Western Visayas)". Table 1. Population Enumerated in Various Censuses by Province/Highly Urbanized City: 1903 to 2007. NSO.
- "Province of Capiz". Municipality Population Data. Local Water Utilities Administration Research Division. Retrieved 17 December 2016.