Lebel-sur-Quévillon
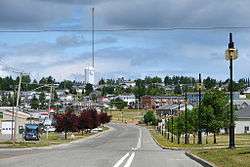
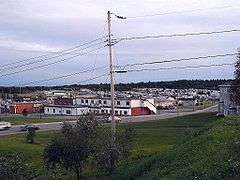
Lebel-sur-Quévillon is a city in the Canadian province of Quebec, located on Route 113 in the Jamésie region. It is located approximately 88 kilometres north of Senneterre and approximately 200 kilometres southwest of Chibougamau. It is surrounded by, but not a part of, the local municipality of Eeyou Istchee James Bay Regional Government. It is constituted from unorganized territories.[6]
Lebel-sur-Quévillon | |
|---|---|
City | |
 | |
 Coat of arms | |
 Lebel-sur-Quévillon | |
| Coordinates (500, place Quévillon[1]): 49°03′N 76°59′W[2] | |
| Country | |
| Province | |
| Region | Nord-du-Québec |
| RCM | None |
| Settled | 1965 |
| Constituted | August 6, 1965 |
| Government | |
| • Mayor | Gérald Lemoyne |
| • Federal riding | Abitibi—Baie-James—Nunavik—Eeyou |
| • Prov. riding | Ungava |
| Area | |
| • Total | 42.60 km2 (16.45 sq mi) |
| • Land | 40.14 km2 (15.50 sq mi) |
| Elevation | 304.50 m (999.02 ft) |
| Population (2016)[5] | |
| • Total | 2,187 |
| • Density | 53.8/km2 (139/sq mi) |
| • Change (2011–16) | |
| • Dwellings | 1,111 |
| Time zone | UTC−5 (EST) |
| • Summer (DST) | UTC−4 (EDT) |
| Postal code(s) | J0Y 1X0 |
| Area code(s) | 819 |
| Climate | Dfb |
| Website | www |
The town had a population of 2,187 as of the Canada 2016 Census, and is served by the Lebel-sur-Quévillon Airport. The hamlet of Rapide-des-Cèdres is also within its municipal boundary.
Geography
Lebel-sur-Quévillon is located in the north-east of Senneterre and 151 kilometres (94 mi). It is accessed by route 113 which links Lac Saint-Jean to Abitibi via Chapais and Chibougamau.
Located on the southern edge of the administrative region of Nord-du-Quebec, the village of Lebel-sur-Quévillon is enclosed entirely by Eeyou Istchee James Bay Regional Government.. The village is located on a peninsula at the southwest of Quevillon Lake. This lake of 12.6 kilometres (7.8 mi) in length resembles a heart. Lake Quévillon is mainly supplied by the Wilson River (Quevillon Lake), which empties on the north-east shore of the lake.
Toponymy
The name "Lebel" is in honor of Jean-Baptiste Lebel, a forestry contractor, born in 1887 and died in 1966 who worked for years to set up a paper mill in The north of the province. The lake gives the second part of its name to the city. Lac Quévillon is named in honor of Louis-Amable Quévillon (1749-1823), an architect and sculptor of religious objects.[7]
History
The town, built on the Quevillon Lake Peninsula, was erected to accommodate employees of the Dominion Tar Pulp and Chemical Plant (Domtar). At the end of August 1966, the first inhabitants arrived in the future village which according to the first plans had to count in 5 years. In 1971, the population reached 3000 inhabitants and 4300 with the surrounding villages. In 1974, Domtar installs a sawmill close to its pulp mill. A new neighborhood is created but the population will reach only the neighborhoods. The city is a mono-industrial place that survives thanks to the well-paid jobs of the company Domtar. It therefore becomes sensitive to any labor dispute. In 1975, a 6-month strike was carried out at Domtar, followed by a forestry strike at Domtar in 1977. In June 1984 and May 1985, a strike in the plant paralyzed the whole town. In 1988, a 4-month strike began at the beginning of the year. Start of a 16-year period without conflict between employer and employees. In 1994: significant investment in Domtar and opening of the Langlois mine by Canadian company Cambior. Creation of new district in the city.
In 2000, the Langlois mine was sold to Breakwater Resources ltd. Domtar is locked out of its Lebel-sur-Quévillon kraft paper plant and its sawmill.[8] Since the closure of the plant, a significant emigration is noted among the inhabitants of the town of Lebel-sur-Quévillon.[9] On December 18, 2008, the Domtar pulp mill was permanently closed. In the same year, on November 2, the Langlois mine was temporarily shut down due to the fall in the price of zinc.
In February 2010, the Langlois mine reopens. In the summer of 2011, the company Breakwater was bought by Nyrstar. January 31, 2012: announcement of the purchase of the former Domtar plant by Fortress Paper. The plant will produce pulp that will be used to make clothing, from rayon, a growing market around the world to replace cotton. The re-opening of the plant will create 333 direct jobs and 400 indirect jobs.
CKCJ-FM, Lebel-sur-Quévillon's first local community radio station, launched in 2018.[10]
Demographics
Population trend:[11]
- Population in 2016: 2,187 (2011 to 2016 population change: 1.3%
- Population in 2011: 2159 (2006 to 2011 population change: -20.9%)
- Population in 2006: 2729
- Population in 2001: 3236
- 2001 to 2006 population change: -15.7%
- Population in 1996: 3416
- Population in 1991: 3414
Private dwellings occupied by usual residents: 917 (total dwellings: 1111)
Mother tongue:
- English as first language: 1%
- French as first language: 98%
- English and French as first language: 0%
- Other as first language: <1 %
Climate
| Climate data for Lebel-sur-Quévillon | |||||||||||||
|---|---|---|---|---|---|---|---|---|---|---|---|---|---|
| Month | Jan | Feb | Mar | Apr | May | Jun | Jul | Aug | Sep | Oct | Nov | Dec | Year |
| Record high °C (°F) | 10.5 (50.9) |
10.0 (50.0) |
16.5 (61.7) |
28.0 (82.4) |
32.2 (90.0) |
33.5 (92.3) |
34.4 (93.9) |
33.9 (93.0) |
31.1 (88.0) |
26.1 (79.0) |
15.0 (59.0) |
13.0 (55.4) |
34.4 (93.9) |
| Average high °C (°F) | −12.0 (10.4) |
−9.7 (14.5) |
−2.3 (27.9) |
6.6 (43.9) |
15.3 (59.5) |
20.6 (69.1) |
23.1 (73.6) |
21.4 (70.5) |
15.5 (59.9) |
7.7 (45.9) |
−0.6 (30.9) |
−8.4 (16.9) |
6.4 (43.5) |
| Daily mean °C (°F) | −17.7 (0.1) |
−16.1 (3.0) |
−8.6 (16.5) |
0.8 (33.4) |
8.9 (48.0) |
14.2 (57.6) |
17.1 (62.8) |
15.7 (60.3) |
10.6 (51.1) |
3.9 (39.0) |
−4.0 (24.8) |
−13.2 (8.2) |
1.0 (33.8) |
| Average low °C (°F) | −23.4 (−10.1) |
−22.4 (−8.3) |
−15.0 (5.0) |
−5.0 (23.0) |
2.4 (36.3) |
7.9 (46.2) |
11.2 (52.2) |
10.1 (50.2) |
5.7 (42.3) |
0.0 (32.0) |
−7.4 (18.7) |
−17.9 (−0.2) |
−4.5 (23.9) |
| Record low °C (°F) | −43.0 (−45.4) |
−42.2 (−44.0) |
−40.0 (−40.0) |
−26.7 (−16.1) |
−13.9 (7.0) |
−3.9 (25.0) |
−1.7 (28.9) |
−2.0 (28.4) |
−7.8 (18.0) |
−13.5 (7.7) |
−28.9 (−20.0) |
−40.0 (−40.0) |
−43.0 (−45.4) |
| Average precipitation mm (inches) | 52.4 (2.06) |
29.6 (1.17) |
44.5 (1.75) |
58.0 (2.28) |
75.3 (2.96) |
98.0 (3.86) |
122.9 (4.84) |
108.2 (4.26) |
119.3 (4.70) |
91.1 (3.59) |
71.1 (2.80) |
58.5 (2.30) |
929.4 (36.59) |
| Average rainfall mm (inches) | 1.9 (0.07) |
2.0 (0.08) |
11.7 (0.46) |
40.6 (1.60) |
73.0 (2.87) |
97.8 (3.85) |
122.9 (4.84) |
108.2 (4.26) |
119.0 (4.69) |
82.5 (3.25) |
37.7 (1.48) |
6.4 (0.25) |
703.8 (27.71) |
| Average snowfall cm (inches) | 50.4 (19.8) |
27.6 (10.9) |
32.8 (12.9) |
17.3 (6.8) |
2.3 (0.9) |
0.2 (0.1) |
0 (0) |
0 (0) |
0.3 (0.1) |
8.5 (3.3) |
34.0 (13.4) |
52.1 (20.5) |
225.6 (88.8) |
| Average precipitation days (≥ 0.2 mm) | 14.3 | 9.6 | 10.9 | 11.5 | 13.3 | 14.7 | 16.7 | 16.5 | 18.9 | 17.1 | 16.2 | 15.8 | 175.4 |
| Average rainy days (≥ 0.2 mm) | 0.73 | 0.78 | 3.4 | 8.0 | 12.9 | 14.7 | 16.7 | 16.5 | 18.8 | 15.2 | 6.0 | 1.5 | 115.1 |
| Average snowy days (≥ 0.2 cm) | 13.8 | 9.1 | 8.2 | 5.0 | 0.96 | 0.09 | 0 | 0 | 0.27 | 3.2 | 11.6 | 14.8 | 67.0 |
| Source: Environment Canada[4] | |||||||||||||
See also
- Bell River (Quebec), a river
- Jamésie
- Nord-du-Québec, administrative region of Québec
- List of towns in Quebec
References
- Geographic code 99005 in the official Répertoire des municipalités (in French)
- Reference number 35012 of the Commission de toponymie du Québec (in French)
- "(Code 2499005) Census Profile". 2011 census. Statistics Canada. 2012.
- Environment Canada, Canadian Climate Normals 1971–2000, accessed 14 August 2012
- "Census Profile". statcan. Statistics Canada. Retrieved 6 January 2019.
- Site officiel de la ville de Lebel-sur-Quévillon
- Commission de toponymie du Québec - Lebel-sur-Quévillon
- Communiqué de presse Domtar 18 décembre 2008
- Données de recensement 2006, Statistique Canada, page consultée le 28 octobre 2008
- "La nouvelle station de radio de Lebel-sur-Quévillon est lancée". Ici Radio-Canada Abitibi-Témiscamingue, July 22, 2018.
- Statistics Canada: 1996, 2001, 2006, 2011 census
External links
- Lebel-sur-Quévillon

| Regional county municipalities and equivalent territories |
|
|---|---|
| Municipalities |
|
| Authority control |
|
|---|