La Chapelle-Faucher
La Chapelle-Faucher is a commune in the Dordogne department in Nouvelle-Aquitaine in southwestern France.
La Chapelle-Faucher | |
|---|---|
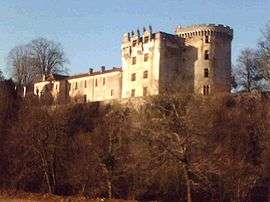 Château de La Chapelle-Faucher | |
Location of La Chapelle-Faucher 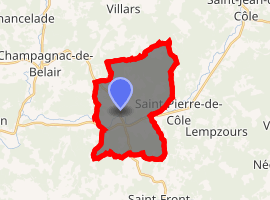
| |
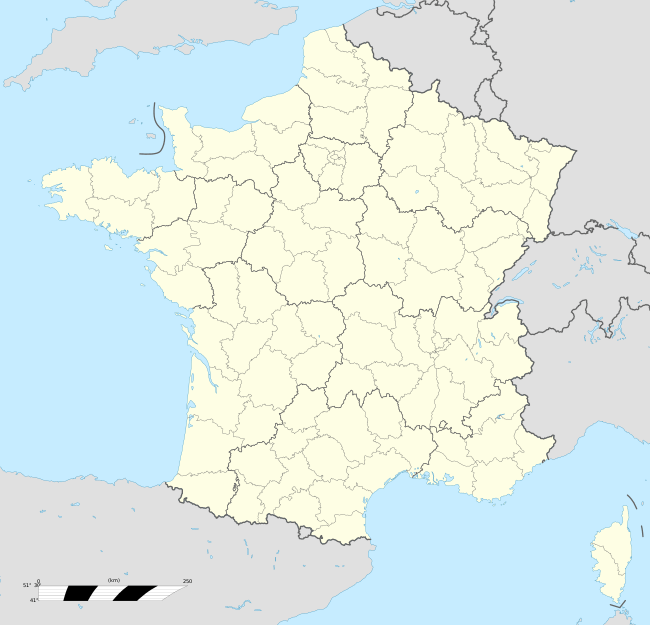 La Chapelle-Faucher 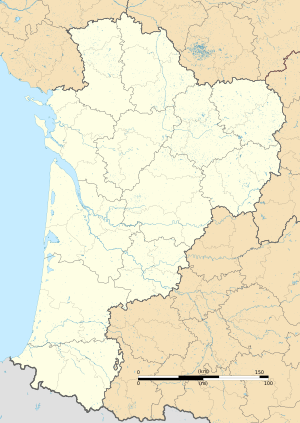 La Chapelle-Faucher | |
| Coordinates: 45°22′18″N 0°45′10″E | |
| Country | France |
| Region | Nouvelle-Aquitaine |
| Department | Dordogne |
| Arrondissement | Nontron |
| Canton | Brantôme |
| Intercommunality | Pays de Champagnac-en-Périgord |
| Government | |
| • Mayor (2008–2014) | Christian Mazière |
| Area 1 | 18.4 km2 (7.1 sq mi) |
| Population (2017-01-01)[1] | 414 |
| • Density | 23/km2 (58/sq mi) |
| Time zone | UTC+01:00 (CET) |
| • Summer (DST) | UTC+02:00 (CEST) |
| INSEE/Postal code | 24107 /24530 |
| Elevation | 114–213 m (374–699 ft) (avg. 144 m or 472 ft) |
| 1 French Land Register data, which excludes lakes, ponds, glaciers > 1 km2 (0.386 sq mi or 247 acres) and river estuaries. | |
This small but quaint rural French village has a Romanesque-style church, Notre Dame de l'Assomption built in the 12th century, a rambling ancient chateau overlooking the Cole River built in the 13th century (some of which has been restored and used for wedding receptions and other events), a kindergarten and a town hall. La Chapelle-Faucher is set above the river Côle, a tributary of the Dronne river which runs through the nearby town of Brantôme.
History
In the 14th century, the entire town was burnt to the ground during the Hundred Years' War. The village was gradually rebuilt, but religion's powerful hand frequented the village. On 2 July 1569, Protestants led by Gaspard de Coligny, rounded up 260 Catholic peasants (men, women and children), put into the chateau and brutally killed one by one during the wars of religion. The local priest pleaded that they be saved but to no avail. According to the local chronicler of these wars at the time, Pierre de Bourdeille, seigneur (and abbé) de Brantôme, the killings began at 9am and finished around 2pm. Some residents say you can hear the voices of distressed peasants in the darkness of the night...
Population
| Historical population | ||
|---|---|---|
| Year | Pop. | ±% |
| 1831 | 900 | — |
| 1836 | 923 | +2.6% |
| 1841 | 861 | −6.7% |
| 1846 | 882 | +2.4% |
| 1851 | 877 | −0.6% |
| 1856 | 901 | +2.7% |
| 1861 | 919 | +2.0% |
| 1866 | 921 | +0.2% |
| 1872 | 882 | −4.2% |
| 1876 | 869 | −1.5% |
| 1881 | 861 | −0.9% |
| 1886 | 881 | +2.3% |
| 1891 | 851 | −3.4% |
| 1896 | 852 | +0.1% |
| 1901 | 733 | −14.0% |
| 1906 | 725 | −1.1% |
| 1911 | 701 | −3.3% |
| 1921 | 553 | −21.1% |
| 1926 | 622 | +12.5% |
| 1931 | 603 | −3.1% |
| 1936 | 580 | −3.8% |
| 1946 | 517 | −10.9% |
| 1954 | 493 | −4.6% |
| 1962 | 464 | −5.9% |
| 1968 | 477 | +2.8% |
| 1975 | 478 | +0.2% |
| 1982 | 445 | −6.9% |
| 1990 | 398 | −10.6% |
| 1999 | 400 | +0.5% |
| 2008 | 381 | −4.7% |
See also
References
- "Populations légales 2017". INSEE. Retrieved 6 January 2020.
| Wikimedia Commons has media related to La Chapelle-Faucher. |
| Authority control |
|
|---|