Kelowna—Lake Country
Kelowna—Lake Country (formerly known as Kelowna) is a federal electoral district in the province of British Columbia, Canada, that has been represented in the House of Commons of Canada since 1997.
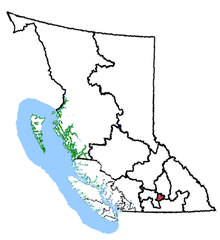 Kelowna—Lake Country in relation to other British Columbia federal electoral districts | |||
| Federal electoral district | |||
| Legislature | House of Commons | ||
| MP |
Conservative | ||
| District created | 1996 | ||
| First contested | 1997 | ||
| Last contested | 2015 | ||
| District webpage | profile, map | ||
| Demographics | |||
| Population (2011)[1] | 110,051 | ||
| Electors (2019) | 99,992 | ||
| Area (km²)[1] | 1,670 | ||
| Pop. density (per km²) | 65.9 | ||
| Census subdivisions | Kelowna, Lake Country, Central Okanagan | ||
It was one of only two ridings of the 338 during the 2015 election that did not have a Green Party candidate (the other being Labrador).
History
This district was created as "Kelowna" electoral district in 1996 from a portion of Okanagan Centre riding.
In 2003, it was renamed "Kelowna—Lake Country".
The 2012 federal electoral boundaries redistribution concluded that the electoral boundaries of Kelowna—Lake Country should be adjusted, and a modified electoral district of the same name will be contested in future elections.[2] The redefined Kelowna—Lake Country loses a portion of its current territory to the new district of Central Okanagan—Similkameen—Nicola. These new boundaries were legally defined in the 2013 representation order, which came into effect upon the call of the 42nd Canadian federal election, scheduled for 19 October 2015.[3]
Demographics
| Ethnic groups in Kelowna—Lake Country (2016) Source: | Population | % | |
|---|---|---|---|
| Ethnic group | European | 95,075 | 80.9% |
| Aboriginal | 7,635 | 6.5% | |
| South Asian | 3,170 | 2.7% | |
| Chinese | 1,565 | 1.3% | |
| Filipino | 1,310 | 1.1% | |
| Japanese | 1,100 | 0.9% | |
| Black | 825 | 0.7% | |
| Southeast Asian | 490 | 0.4% | |
| Korean | 380 | 0.3% | |
| Latin American | 295 | 0.3% | |
| West Asian | 250 | 0.2% | |
| Arab | 205 | 0.2% | |
| Multiple minorities | 315 | 0.3% | |
| Visible minority, n.i.e. | 205 | 0.2% | |
| Total population | 119,388 | 100% | |
Members of Parliament
| Parliament | Years | Member | Party | |
|---|---|---|---|---|
| Kelowna Riding created from Okanagan Centre |
||||
| 36th | 1997–2000 | Werner Schmidt | Reform | |
| 2000–2000 | Alliance | |||
| 37th | 2000–2003 | |||
| 2003–2004 | Conservative | |||
| Kelowna—Lake Country | ||||
| 38th | 2004–2006 | Werner Schmidt | Conservative | |
| 39th | 2006–2008 | Ron Cannan | ||
| 40th | 2008–2011 | |||
| 41st | 2011–2015 | |||
| 42nd | 2015–2019 | Stephen Fuhr | Liberal | |
| 43rd | 2019–present | Tracy Gray | Conservative | |
Current Member of Parliament
The Member of Parliament is Tracy Gray. She unseated Liberal incumbent Stephen Fuhr in the 2019 federal election.[4]
Election results
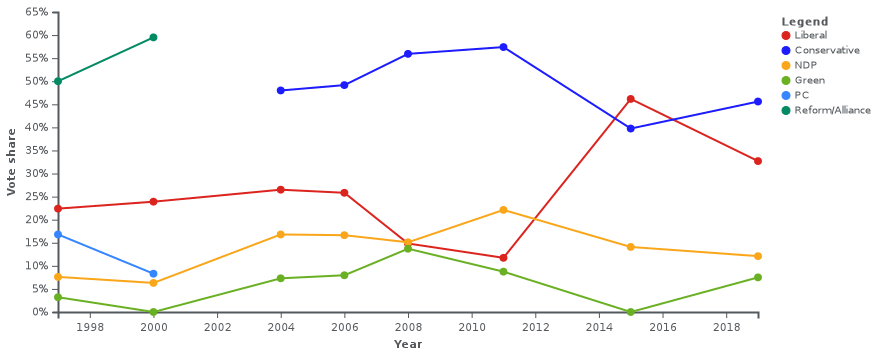
Kelowna—Lake Country, 2004–present
| 2019 Canadian federal election | ||||||||
|---|---|---|---|---|---|---|---|---|
| Party | Candidate | Votes | % | ±% | Expenditures | |||
| Conservative | Tracy Gray | 31,497 | 45.6 | +5.85 | ||||
| Liberal | Stephen Fuhr | 22,627 | 32.7 | -13.46 | ||||
| New Democratic | Justin Kulik | 8,381 | 12.1 | -1.99 | ||||
| Green | Travis Ashley | 5,171 | 7.5 | – | ||||
| People's | John Barr | 1,225 | 1.8 | – | ||||
| Independent | Daniel Joseph | 152 | 0.2 | – | ||||
| Independent | Silverado Socrates | 67 | 0.1 | – | ||||
| Total valid votes/Expense limit | 69,120 | 100.0 | ||||||
| Total rejected ballots | 305 | |||||||
| Turnout | 69,425 | 69.4 | ||||||
| Eligible voters | 99,992 | |||||||
| Conservative gain from Liberal | Swing | +9.66 | ||||||
| Source: Elections Canada[5][6] | ||||||||
| 2015 Canadian federal election | ||||||||
|---|---|---|---|---|---|---|---|---|
| Party | Candidate | Votes | % | ±% | Expenditures | |||
| Liberal | Stephen Fuhr | 29,614 | 46.16 | +34.69 | $127,002.68 | |||
| Conservative | Ron Cannan | 25,502 | 39.75 | -18.63 | $70,942.48 | |||
| New Democratic | Norah Mary Bowman | 9,039 | 14.09 | -7.28 | $33,945.86 | |||
| Total valid votes/Expense limit | 64,155 | 100.00 | $228,718.18 | |||||
| Total rejected ballots | 230 | 0.36 | – | |||||
| Turnout | 64,385 | 70.65 | – | |||||
| Eligible voters | 91,131 | |||||||
| Liberal gain from Conservative | Swing | +26.66 | ||||||
| Source: Elections Canada[7][8][9] | ||||||||
| 2011 federal election redistributed results[10] | |||
|---|---|---|---|
| Party | Vote | % | |
| Conservative | 28,220 | 58.38 | |
| New Democratic | 10,329 | 21.37 | |
| Liberal | 5,546 | 11.47 | |
| Green | 4,244 | 8.78 | |
| 2011 Canadian federal election | ||||||||
|---|---|---|---|---|---|---|---|---|
| Party | Candidate | Votes | % | ±% | Expenditures | |||
| Conservative | Ron Cannan | 34,566 | 57.40 | +1.47 | ||||
| New Democratic | Patricia Kalmanovitch | 13,322 | 22.12 | +7.01 | ||||
| Liberal | Kris Stewart | 7,069 | 11.74 | -1.97 | ||||
| Green | Alice Hooper | 5,265 | 8.74 | -4.97 | ||||
| Total valid votes/Expense limit | 60,222 | 100.00 | – | |||||
| Total rejected ballots | 146 | 0.24 | -0.05 | |||||
| Turnout | 60,368 | 60.27 | +1.51 | |||||
| Eligible voters | 100,169 | – | – | |||||
| 2008 Canadian federal election | ||||||||
|---|---|---|---|---|---|---|---|---|
| Party | Candidate | Votes | % | ±% | Expenditures | |||
| Conservative | Ron Cannan | 31,907 | 55.93 | +6.77 | $66,354 | |||
| New Democratic | Tish Lakes | 8,624 | 15.11 | -1.53 | – | |||
| Liberal | Diana Cabott | 8,469 | 14.84 | -10.99 | $37,576 | |||
| Green | Angela Reid | 7,821 | 13.71 | +5.75 | $13,334 | |||
| Communist | Mark Haley | 218 | 0.38 | – | $566 | |||
| Total valid votes/Expense limit | 57,039 | 100.00 | $95,647 | |||||
| Total rejected ballots | 168 | 0.29 | +0.09 | |||||
| Turnout | 57,207 | 58.76 | -0.8 | |||||
| 2006 Canadian federal election | ||||||||
|---|---|---|---|---|---|---|---|---|
| Party | Candidate | Votes | % | ±% | Expenditures | |||
| Conservative | Ron Cannan | 28,174 | 49.16 | +1.2 | $79,928 | |||
| Liberal | Vern Nielsen | 14,807 | 25.83 | -0.7 | $51,137 | |||
| New Democratic | Kevin Hagglund | 9538 | 16.64 | -0.2 | $13,654 | |||
| Green | Angela Reid | 4562 | 7.96 | +0.7 | $3,640 | |||
| Canadian Action | David Thomson | 223 | 0.38 | -0.1 | $1,290 | |||
| Total valid votes | 57,204 | 100.00 | ||||||
| Total rejected ballots | 116 | 0.20 | -0.1 | |||||
| Turnout | 57,420 | 63.40 | +2.0 | |||||
| 2004 Canadian federal election | ||||||||
|---|---|---|---|---|---|---|---|---|
| Party | Candidate | Votes | % | ±% | Expenditures | |||
| Conservative | Werner Schmidt | 25,553 | 48.0 | -19.7 | $61,185 | |||
| Liberal | Vern Nielsen | 14,109 | 26.5 | +2.7 | $58,986 | |||
| New Democratic | Starleigh Grass | 8,954 | 16.8 | +10.5 | $14,000 | |||
| Green | Kevin Ade | 3,903 | 7.3 | – | $4,993 | |||
| Marijuana | Huguette Plourde | 447 | 0.8 | – | ||||
| Canadian Action | Michael Cassidyne-Hook | 271 | 0.5 | -1.6 | ||||
| Total valid votes | 53,237 | 100.0 | ||||||
| Total rejected ballots | 159 | 0.3 | -0.1 | |||||
| Turnout | 53,396 | 62.1 | -1.9 | |||||
Note: Conservative vote is compared to the total of the Canadian Alliance vote and Progressive Conservative vote in 2000 election.
Kelowna, 1997–2004
| 2000 Canadian federal election | ||||||||
|---|---|---|---|---|---|---|---|---|
| Party | Candidate | Votes | % | ±% | Expenditures | |||
| Alliance | Werner Schmidt | 33,810 | 59.5 | +9.5 | $44,990 | |||
| Liberal | Joe Leask | 13,564 | 23.9 | +1.5 | $46,876 | |||
| Progressive Conservative | Doug Mallo | 4,708 | 8.3 | -8.5 | $9,791 | |||
| New Democratic | John O. Powell | 3,572 | 6.3 | -1.3 | $9,493 | |||
| Canadian Action | Jack W. Peach | 1,199 | 2.1 | – | $3,652 | |||
| Total valid votes | 56,853 | 100.0 | ||||||
| Total rejected ballots | 223 | 0.4 | +0.2 | |||||
| Turnout | 57,076 | 64.0 | +1.2 | |||||
Note: Canadian Alliance vote is compared to the Reform vote in 1997 election.
| 1997 Canadian federal election | ||||||||
|---|---|---|---|---|---|---|---|---|
| Party | Candidate | Votes | % | ±% | Expenditures | |||
| Reform | Werner Schmidt | 25,246 | 50.0 | – | $48,355 | |||
| Liberal | Janna Francis | 11,306 | 22.4 | – | $32,838 | |||
| Progressive Conservative | Al Horning | 8,477 | 16.8 | – | $47,498 | |||
| New Democratic | Fred Steele | 3,838 | 7.6 | – | $11,443 | |||
| Green | David Hughes | 1,612 | 3.2 | – | $1,014 | |||
| Total valid votes | 50,479 | 100.0 | ||||||
| Total rejected ballots | 123 | 0.2 | ||||||
| Turnout | 50,602 | 62.8 | ||||||
See also
- List of Canadian federal electoral districts
- Past Canadian electoral districts
References
- "(Code 59011) Census Profile". 2011 census. Statistics Canada. 2012. Retrieved 2011-03-06.
- Library of Parliament Riding Profile (1996–2003)
- Library of Parliament Riding Profile (2003–present)
- Campaign expense data from Elections Canada – 2008
- Expenditures - 2004
- Expenditures – 2000
- Expenditures – 1997
Notes
- Statistics Canada: 2011
- Final Report – British Columbia
- Timeline for the Redistribution of Federal Electoral Districts
- {{cite web|url=https://globalnews.ca/news/6067276/kelowna-lake-country-turns-blue-again-with-gray-victory/%7Ctitle=Kelowna-Lake Country turns blue again with Gray victory|last=Potenteau|first=Doyle|work=[[CHBC-DT|Global Okanagan|date=October 21, 2019|accessdate=October 25, 2019}}
- "List of confirmed candidates". Elections Canada. Retrieved October 4, 2019.
- "Election Night Results". Elections Canada. Retrieved November 16, 2019.
- Elections Canada – Confirmed candidates for Kelowna—Lake Country, 30 September 2015
- Official Voting Results - Kelowna—Lake Country
- "Elections Canada – Preliminary Election Expenses Limits for Candidates". Archived from the original on August 15, 2015.
- Pundits' Guide to Canadian Elections
External links
- Website of the Parliament of Canada