Vancouver Kingsway
Vancouver Kingsway is a federal electoral district in British Columbia, Canada that has been represented in the House of Commons of Canada from 1953 to 1988 and since 1997. It is located in Vancouver.
.svg.png) Vancouver Kingsway in relation to other electoral districts in the Vancouver area | |||
| Federal electoral district | |||
| Legislature | House of Commons | ||
| MP |
New Democratic | ||
| District created | 1996 | ||
| First contested | 1997 | ||
| Last contested | 2019 | ||
| District webpage | profile, map | ||
| Demographics | |||
| Population (2011)[1] | 102,003 | ||
| Electors (2015) | 69,812 | ||
| Area (km²)[1] | 15 | ||
| Pop. density (per km²) | 6,800.2 | ||
| Census divisions | Metro Vancouver | ||
| Census subdivisions | Vancouver | ||
Demographics
This riding's population is over 54% immigrants. The three largest ethnic groups include Chinese (36%), European (31.7%) and Filipino (12.5%). The service sector, retail trade and manufacturing are the major sources of employment in Vancouver Kingsway. The average family income is over $72,000. Unemployment is around 6.5%.[2]
9.9% of the population is Buddhist, the highest in Canada.[3] More generally, Vancouver Kingsway has the highest proportion of non-Christians, 62.8% in particular, of which: no religious affiliation: 43.5%, Buddhist: 9.9%, Sikh: 3.2% etc.[4][5]
| Ethnic groups in Vancouver Kingsway (2016) Source: | Population | % | |
|---|---|---|---|
| Ethnic group | Chinese | 37,355 | 36% |
| European | 32,905 | 31.7% | |
| Filipino | 12,975 | 12.5% | |
| South Asian | 7,085 | 6.8% | |
| Southeast Asian | 6,570 | 6.3% | |
| Aboriginal | 2,235 | 2.2% | |
| Latin American | 1,525 | 1.5% | |
| Japanese | 1,390 | 1.3% | |
| Korean | 930 | 0.9% | |
| Black | 915 | 0.9% | |
| West Asian | 415 | 0.4% | |
| Arab | 210 | 0.2% | |
| Multiple minorities | 2,805 | 2.7% | |
| Visible minority, n.i.e. | 160 | 0.2% | |
| Total population | 103,760 | 100% | |
History
The name "Vancouver Kingsway" has been used twice to describe federal ridings. It was first created in 1952, carved out of Vancouver South riding. In 1987, the riding was divided between Burnaby—Kingsway, Vancouver East, Vancouver Quadra and Vancouver South ridings. In 1996, a new Vancouver Kingsway was created out of these same four ridings.
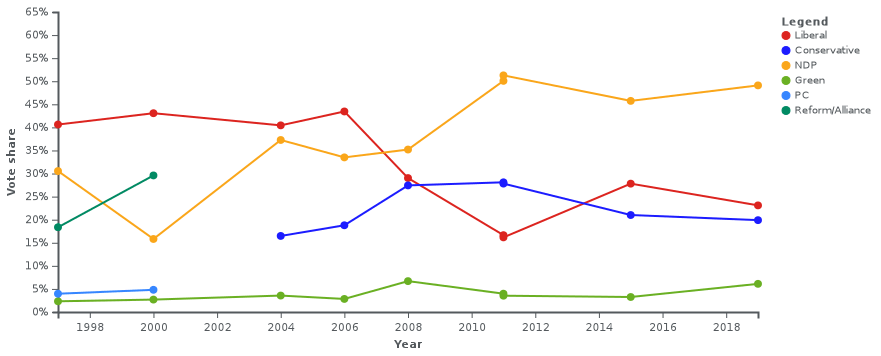
This riding has been held by the NDP and its precursor CCF for most of its history. The NDP has won 12 of the 18 elections held since the riding was formed in 1953, the Liberals have won five and the Conservatives one. The two candidates who topped the poll in the 2008 election ran again in 2011. The incumbent Member of Parliament, Vancouver lawyer Don Davies, represented the NDP,[6] and Vancouver businesswoman Wendy Yuan represented the Liberal Party again.[7] Davies won by approximately 3,000 votes in 2008. In 2011, Davies quintupled that margin, topping the Liberal candidate by over 15,000 votes, the Conservative candidate by over 10,000 votes, and winning over 50% of the votes cast.
The 2012 federal electoral boundaries redistribution concluded that the electoral boundaries of Vancouver Kingsway should be adjusted, and a modified electoral district of the same name was created.[8] The redefined Vancouver Kingsway lost its territory west of Main Street to the new district of Vancouver Granville, as well as a small area in its extreme southeast to Vancouver South. These new boundaries were legally defined in the 2013 representation order, which came into effect upon the call of the 2015 election.[9]
David Emerson controversy
David Emerson was first elected in 2004, for the Liberal Party of Canada, and served in the Cabinet as the Minister of Industry.
Emerson was re-elected as a Liberal in the 2006 election, but crossed the floor two weeks later on February 6, 2006 to become the new Minister of International Trade in Stephen Harper's Conservative government.
Emerson's floor-crossing was highly controversial. Then Prime Minister-designate Stephen Harper dispatched campaign co-chair John Douglas Reynolds, on the day after the election, to offer Emerson a cabinet post in a Conservative government. Emerson's acceptance of that offer made Canadian history, marking the first time a member of parliament, let alone a cabinet minister, had crossed the floor before a new government was even sworn in.
As a result of the controversy, a number of groups formed to fight for Emerson's resignation. Some groups also seek legislation that would prevent floor crossing altogether or restrict a member of parliament if they abandon their party's caucus. Groups that fought against Emerson's defection included the New Democratic Party-aligned Recall David Emerson Campaign, and the Liberal Party-aligned but eventually wholly citizen-driven De-Elect Emerson Campaign.
Members of Parliament
This riding has elected the following Members of Parliament:
| Parliament | Years | Member | Party | |
|---|---|---|---|---|
| Vancouver Kingsway Riding created from Vancouver South |
||||
| 22nd | 1953–1957 | Angus MacInnis | Co-operative Commonwealth | |
| 23rd | 1957–1958 | Alexander Macdonald | ||
| 24th | 1958–1962 | John Ferguson Browne | Progressive Conservative | |
| 25th | 1962–1963 | Arnold Webster | New Democratic | |
| 26th | 1963–1965 | |||
| 27th | 1965–1968 | Grace MacInnis | ||
| 28th | 1968–1972 | |||
| 29th | 1972–1974 | |||
| 30th | 1974–1979 | Simma Holt | Liberal | |
| 31st | 1979–1980 | Ian Waddell | New Democratic | |
| 32nd | 1980–1984 | |||
| 33rd | 1984–1988 | |||
| Riding dissolved into Burnaby—Kingsway, Vancouver East, Vancouver Quadra and Vancouver South |
||||
| Riding re-created from Burnaby—Kingsway, Vancouver East, Vancouver Quadra and Vancouver South |
||||
| 36th | 1997–2000 | Sophia Leung | Liberal | |
| 37th | 2000–2004 | |||
| 38th | 2004–2006 | David Emerson | ||
| 39th | 2006–2006 | |||
| 2006–2008 | Conservative | |||
| 40th | 2008–2011 | Don Davies | New Democratic | |
| 41st | 2011–2015 | |||
| 42nd | 2015–2019 | |||
| 43rd | 2019–present | |||
Election results
1997–present
| 2019 Canadian federal election | ||||||||
|---|---|---|---|---|---|---|---|---|
| Party | Candidate | Votes | % | ±% | Expenditures | |||
| New Democratic | Don Davies | 21,680 | 49.1 | +3.36 | $96,884.11 | |||
| Liberal | Tamara Taggart | 10,194 | 23.1 | -4.71 | ||||
| Conservative | Helen Quan | 8,804 | 19.9 | -1.11 | ||||
| Green | Lawrence Taylor | 2,675 | 6.1 | +2.85 | ||||
| People's | Ian Torn | 427 | 1.0 | – | $3,869.88 | |||
| Communist | Kimball Cariou | 292 | 0.7 | -0.28 | ||||
| Marxist–Leninist | Donna Peterson | 91 | 0.2 | +0.02 | $0.00 | |||
| Total valid votes/Expense limit | 44,163 | 100.0 | ||||||
| Total rejected ballots | 446 | |||||||
| Turnout | 44,609 | 59.4 | ||||||
| Eligible voters | 75,050 | |||||||
| New Democratic hold | Swing | +4.035 | ||||||
| Source: Elections Canada[10][11] | ||||||||
| 2015 Canadian federal election | ||||||||
|---|---|---|---|---|---|---|---|---|
| Party | Candidate | Votes | % | ±% | Expenditures | |||
| New Democratic | Don Davies | 20,763 | 45.74 | -5.53 | $113,476.84 | |||
| Liberal | Steven Kou | 12,625 | 27.81 | +11.64 | $93,120.16 | |||
| Conservative | Jojo Quimpo | 9,538 | 21.01 | -7.09 | – | |||
| Green | Catherine Moore | 1,476 | 3.25 | -0.28 | $1,663.13 | |||
| Libertarian | Matt Kadioglu | 468 | 1.03 | +0.44 | – | |||
| Communist | Kimball Cariou | 445 | 0.98 | +0.53 | – | |||
| Marxist–Leninist | Donna Petersen | 81 | 0.18 | +0.01 | – | |||
| Total valid votes/Expense limit | 45,396 | 100.00 | $204,392.06 | |||||
| Total rejected ballots | 471 | 1.03 | – | |||||
| Turnout | 45,867 | 64.41 | ||||||
| Eligible voters | 71,206 | |||||||
| New Democratic hold | Swing | -8.58 | ||||||
| Source: Elections Canada[12][13] | ||||||||
| 2011 federal election redistributed results[14] | |||
|---|---|---|---|
| Party | Vote | % | |
| New Democratic | 18,752 | 51.27 | |
| Conservative | 10,177 | 27.82 | |
| Liberal | 5,916 | 16.17 | |
| Green | 1,292 | 3.53 | |
| Others | 441 | 1.21 | |
| 2011 Canadian federal election | ||||||||
|---|---|---|---|---|---|---|---|---|
| Party | Candidate | Votes | % | ±% | ||||
| New Democratic | Don Davies | 23,452 | 50.08 | +14.88 | ||||
| Conservative | Trang Nguyen | 13,157 | 28.1 | +0.67 | ||||
| Liberal | Wendy Yuan | 7,796 | 16.65 | -12.37 | ||||
| Green | Louise Boutin | 1,860 | 3.97 | -2.72 | ||||
| Libertarian | Matt Kadioglu | 275 | 0.59 | -0.09 | ||||
| Communist | Kimball Cariou | 210 | 0.45 | -0.19 | ||||
| Marxist–Leninist | Donna Peterson | 78 | 0.17 | -0.16 | ||||
| Total valid votes | 46,828 | 100.0 | ||||||
| Total rejected ballots | 315 | 0.67 | -0.05 | |||||
| Turnout | 47,143 | 58.10 | +2 | |||||
| New Democratic hold | Swing | +7.10 | ||||||
| 2008 Canadian federal election | ||||||||
|---|---|---|---|---|---|---|---|---|
| Party | Candidate | Votes | % | ±% | Expenditures | |||
| New Democratic | Don Davies | 15,933 | 35.20 | +1.70 | $81,501 | |||
| Liberal | Wendy Yuan | 13,164 | 29.02 | -14.43 | $79,758 | |||
| Conservative | Salomon Rayek | 12,419 | 27.43 | +8.64 | $70,829 | |||
| Green | Doug Warkentin | 3,031 | 6.69 | +3.86 | $3,478 | |||
| Libertarian | Matt Kadioglu | 309 | 0.68 | +0.09 | ||||
| Communist | Kimball Cariou | 291 | 0.64 | +0.29 | $391 | |||
| Marxist–Leninist | Donna Peterson | 149 | 0.33 | +0.19 | ||||
| Total valid votes/Expense limit | 45,296 | 100.0 | $84,758 | |||||
| Total rejected ballots | 328 | 0.72 | +0.13 | |||||
| Turnout | 45,624 | 56 | -3 | |||||
| New Democratic gain from Liberal | Swing | +8.06 | ||||||
| 2006 Canadian federal election | ||||||||
|---|---|---|---|---|---|---|---|---|
| Party | Candidate | Votes | % | ±% | Expenditures | |||
| Liberal | David Emerson | 20,062 | 43.45 | +3.01 | $74,641 | |||
| New Democratic | Ian Waddell | 15,470 | 33.50 | -3.77 | $77,756 | |||
| Conservative | Kanman Wong | 8,679 | 18.79 | +2.31 | $77,756 | |||
| Green | Arno Schortinghuis | 1,307 | 2.83 | -0.73 | $803 | |||
| Libertarian | Matt Kadioglu | 277 | 0.59 | – | ||||
| Communist | Kimball Cariou | 162 | 0.35 | -0.05 | $297 | |||
| Canadian Action | Connie Fogal | 143 | 0.30 | -0.03 | $2,987 | |||
| Marxist–Leninist | Donna Peterson | 68 | 0.14 | -0.08 | ||||
| Total valid votes | 46,285 | 100.0 | ||||||
| Total rejected ballots | 274 | 0.59 | -0.43 | |||||
| Turnout | 46,442 | 59.2 | +1.2 | |||||
| Liberal hold | Swing | +3.39 | ||||||
| 2004 Canadian federal election | ||||||||
|---|---|---|---|---|---|---|---|---|
| Party | Candidate | Votes | % | ±% | Expenditures | |||
| Liberal | David Emerson | 17,267 | 40.44 | -2.82 | $63,734 | |||
| New Democratic | Ian Waddell | 15,916 | 37.27 | +21.36 | $55,150 | |||
| Conservative | Jesse Johl | 7,037 | 16.48 | -17.69 | $72,888 | |||
| Green | Tracey Jastinder Mann | 1,521 | 3.56 | +0.87 | ||||
| Independent | Jeannie Kwan | 548 | 1.28 | – | $7,229 | |||
| Communist | Jason Mann | 172 | 0.40 | -0.04 | $389 | |||
| Canadian Action | Jacob Rempel | 142 | 0.33 | -2.87 | $373 | |||
| Marxist–Leninist | Donna Peterson | 94 | 0.22 | -0.11 | $150 | |||
| Total valid votes | 42,697 | 100.0 | ||||||
| Total rejected ballots | 395 | 0.92 | +0.08 | |||||
| Turnout | 43,092 | 58.01 | +2.03 | |||||
| Liberal hold | Swing | -12.09 | ||||||
| Change is based on redistributed results from 2000. Conservative change is from the total of the Canadian Alliance and Progressive Conservative votes. | ||||||||
| 2000 Canadian federal election | ||||||||
|---|---|---|---|---|---|---|---|---|
| Party | Candidate | Votes | % | ±% | Expenditures | |||
| Liberal | Sophia Leung | 16,118 | 43.07 | +2.63 | $56,204 | |||
| Alliance | Alice Wong | 11,076 | 29.59 | +11.23 | $39,286 | |||
| New Democratic | Victor Wong | 5,921 | 15.82 | -14.72 | $7,654 | |||
| Progressive Conservative | Kanman Wong | 1,803 | 4.81 | +0.85 | $11,072 | |||
| Canadian Action | Connie Fogal | 1,200 | 3.20 | – | $54,962 | |||
| Green | Phillip Petrik | 1,009 | 2.69 | +0.37 | $134 | |||
| Communist | Elwyn Patterson | 168 | 0.44 | – | $189 | |||
| Marxist–Leninist | Donna Peterson | 126 | 0.33 | -0.13 | $22 | |||
| Total valid votes | 37,421 | 100.0 | ||||||
| Total rejected ballots | 316 | 0.84 | -0.37 | |||||
| Turnout | 37,737 | 55.98 | -7.39 | |||||
| Liberal hold | Swing | -4.30 | ||||||
| Change for the Canadian Alliance is based on the Reform Party. | ||||||||
| 1997 Canadian federal election | ||||||||
|---|---|---|---|---|---|---|---|---|
| Party | Candidate | Votes | % | Expenditures | ||||
| Liberal | Sophia Leung | 14,182 | 40.62 | $48,495 | ||||
| New Democratic | Victor Wong | 10,662 | 30.54 | $52,412 | ||||
| Reform | Raymond Leung | 6,412 | 18.36 | $15,532 | ||||
| Progressive Conservative | Kan Wong | 1,385 | 3.96 | $4,577 | ||||
| Independent | Gim Huey | 894 | 2.56 | $23,368 | ||||
| Green | Irene Louise Schmidt | 811 | 2.32 | |||||
| Natural Law | Steven Beck | 210 | 0.60 | |||||
| Marxist–Leninist | Donna Peterson | 161 | 0.46 | $699 | ||||
| Independent | Roger Annis | 116 | 0.33 | |||||
| Independent | David Tsai | 78 | 0.22 | $2,450 | ||||
| Total valid votes | 34,911 | 100.0 | ||||||
| Total rejected ballots | 426 | 1.21 | ||||||
| Turnout | 35,337 | 63.37 | ||||||
| This riding was re-created from parts of Burnaby—Kingsway, Vancouver East, Vancouver Quadra and Vancouver South, which elected three Liberals and one New Democrat (Burnaby—Kingsway) in the previous election. | ||||||||
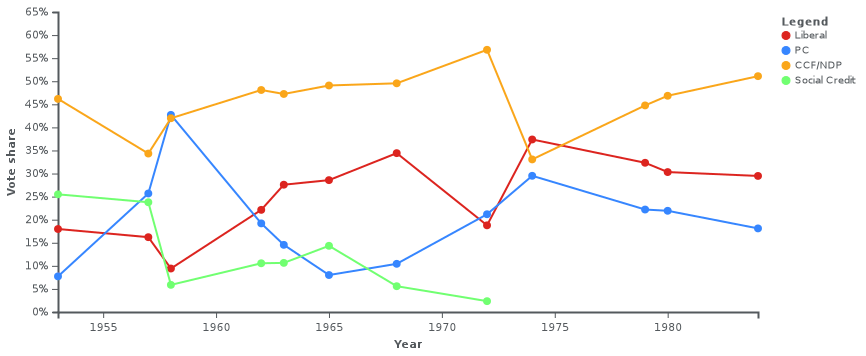
1953–1988
| 1984 Canadian federal election | ||||||||
|---|---|---|---|---|---|---|---|---|
| Party | Candidate | Votes | % | ±% | ||||
| New Democratic | Ian Waddell | 20,179 | 51.10 | +4.25 | ||||
| Liberal | Nancy Morrison | 11,640 | 29.48 | -0.84 | ||||
| Progressive Conservative | Collin Wong | 7,152 | 18.11 | -3.82 | ||||
| Green | Ted Mousseau | 305 | 0.77 | – | ||||
| Communist | Bert Ogden | 214 | 0.54 | +0.13 | ||||
| Total valid votes | 39,490 | 100.0 | ||||||
| New Democratic hold | Swing | +2.54 | ||||||
| 1980 Canadian federal election | ||||||||
|---|---|---|---|---|---|---|---|---|
| Party | Candidate | Votes | % | ±% | ||||
| New Democratic | Ian Waddell | 16,928 | 46.85 | +2.09 | ||||
| Liberal | Simma Holt | 10,954 | 30.32 | -2.01 | ||||
| Progressive Conservative | Drew Taylor | 7,924 | 21.93 | -0.27 | ||||
| Communist | Bert Ogden | 149 | 0.41 | ±0 | ||||
| Independent | Norm Baker | 113 | 0.31 | – | ||||
| Marxist–Leninist | Leanne Corcoran | 63 | 0.17 | -0.12 | ||||
| Total valid votes | 36,131 | 100.0 | ||||||
| New Democratic hold | Swing | +2.05 | ||||||
| 1979 Canadian federal election | ||||||||
|---|---|---|---|---|---|---|---|---|
| Party | Candidate | Votes | % | ±% | ||||
| New Democratic | Ian Waddell | 15,928 | 44.76 | +11.71 | ||||
| Liberal | Simma Holt | 11,503 | 32.33 | -5.05 | ||||
| Progressive Conservative | Cal Davis | 7,900 | 22.20 | -6.31 | ||||
| Communist | Jack Phillips | 147 | 0.41 | -0.29 | ||||
| Marxist–Leninist | Tarlochan S. Bains | 106 | 0.30 | -0.06 | ||||
| Total valid votes | 35,584 | 100.0 | ||||||
| New Democratic gain from Liberal | Swing | +8.38 | ||||||
| 1974 Canadian federal election | ||||||||
|---|---|---|---|---|---|---|---|---|
| Party | Candidate | Votes | % | ±% | ||||
| Liberal | Simma Holt | 12,002 | 37.38 | +18.60 | ||||
| New Democratic | Dennis F. Mulroney | 10,614 | 33.06 | -23.76 | ||||
| Progressive Conservative | John Taylor | 9,155 | 28.51 | +7.33 | ||||
| Communist | Fred Wilson | 225 | 0.70 | – | ||||
| Marxist–Leninist | Thomas J. Boylan | 114 | 0.36 | – | ||||
| Total valid votes | 32,110 | 100.0 | ||||||
| Liberal gain from New Democratic | Swing | +21.18 | ||||||
| 1972 Canadian federal election | ||||||||
|---|---|---|---|---|---|---|---|---|
| Party | Candidate | Votes | % | ±% | ||||
| New Democratic | Grace MacInnis | 18,108 | 56.81 | +7.26 | ||||
| Progressive Conservative | John A. Cherrington | 6,752 | 21.18 | +10.75 | ||||
| Liberal | Ed Bodnarchuk | 5,986 | 18.78 | -15.64 | ||||
| Social Credit | Faren Garner | 750 | 2.35 | -3.24 | ||||
| Independent | William John Turner | 211 | 0.66 | – | ||||
| Independent | Claire Alston | 66 | 0.21 | – | ||||
| Total valid votes | 31,873 | 100.0 | ||||||
| New Democratic hold | Swing | -1.74 | ||||||
| 1968 Canadian federal election | ||||||||
|---|---|---|---|---|---|---|---|---|
| Party | Candidate | Votes | % | ±% | ||||
| New Democratic | Grace MacInnis | 15,599 | 49.55 | +0.48 | ||||
| Liberal | Edward Bodnarchuk | 10,835 | 34.42 | +5.85 | ||||
| Progressive Conservative | Claude Britton | 3,285 | 10.44 | +2.43 | ||||
| Social Credit | Lorena T. Green | 1,760 | 5.59 | -8.75 | ||||
| Total valid votes | 31,479 | 100.0 | ||||||
| New Democratic hold | Swing | -2.68 | ||||||
| 1965 Canadian federal election | ||||||||
|---|---|---|---|---|---|---|---|---|
| Party | Candidate | Votes | % | ±% | ||||
| New Democratic | Grace MacInnis | 13,730 | 49.08 | +1.84 | ||||
| Liberal | Jack Austin | 7,994 | 28.57 | +1.00 | ||||
| Social Credit | Arthur Holmes | 4,012 | 14.34 | +3.70 | ||||
| Progressive Conservative | Garfield Milner | 2,240 | 8.01 | -6.54 | ||||
| Total valid votes | 27,976 | 100.0 | ||||||
| New Democratic hold | Swing | +0.42 | ||||||
| 1963 Canadian federal election | ||||||||
|---|---|---|---|---|---|---|---|---|
| Party | Candidate | Votes | % | ±% | ||||
| New Democratic | Arnold Alexander Webster | 13,966 | 47.24 | -0.87 | ||||
| Liberal | Douglas A. Walker | 8,154 | 27.58 | +5.45 | ||||
| Progressive Conservative | Gerald E. Klein | 4,301 | 14.55 | -4.65 | ||||
| Social Credit | Arthur Holmes | 3,145 | 10.64 | +0.07 | ||||
| Total valid votes | 29,566 | 100.0 | ||||||
| New Democratic hold | Swing | -3.16 | ||||||
| 1962 Canadian federal election | ||||||||
|---|---|---|---|---|---|---|---|---|
| Party | Candidate | Votes | % | ±% | ||||
| New Democratic | Arnold Alexander Webster | 13,837 | 48.10 | +6.12 | ||||
| Liberal | Douglas A. Walker | 6,366 | 22.13 | +12.71 | ||||
| Progressive Conservative | John Ferguson Browne | 5,523 | 19.20 | -23.51 | ||||
| Social Credit | Arthur Holmes | 3,039 | 10.56 | +4.68 | ||||
| Total valid votes | 28,765 | 100.0 | ||||||
| New Democratic gain from Progressive Conservative | Swing | -3.30 | ||||||
| Change for the New Democrats is based on the Co-operative Commonwealth. | ||||||||
| 1958 Canadian federal election | ||||||||
|---|---|---|---|---|---|---|---|---|
| Party | Candidate | Votes | % | ±% | ||||
| Progressive Conservative | John Ferguson Browne | 11,928 | 42.71 | +17.04 | ||||
| Co-operative Commonwealth | Alex B. Macdonald | 11,724 | 41.98 | +7.66 | ||||
| Liberal | Everet King | 2,631 | 9.42 | -6.79 | ||||
| Social Credit | Gus Froese | 1,642 | 5.88 | -17.90 | ||||
| Total valid votes | 27,925 | 100.0 | ||||||
| Progressive Conservative gain from Co-operative Commonwealth | Swing | +4.69 | ||||||
| 1957 Canadian federal election | ||||||||
|---|---|---|---|---|---|---|---|---|
| Party | Candidate | Votes | % | ±% | ||||
| Co-operative Commonwealth | Alex Macdonald | 9,040 | 34.33 | -11.85 | ||||
| Progressive Conservative | John Ferguson Browne | 6,762 | 25.68 | +17.95 | ||||
| Social Credit | Thomas Williamson | 6,262 | 23.78 | -1.71 | ||||
| Liberal | Everett Crowley | 4,270 | 16.21 | -1.77 | ||||
| Total valid votes | 26,334 | 100.0 | ||||||
| Co-operative Commonwealth hold | Swing | -14.90 | ||||||
| 1953 Canadian federal election | ||||||||
|---|---|---|---|---|---|---|---|---|
| Party | Candidate | Votes | % | |||||
| Co-operative Commonwealth | Angus MacInnis | 10,162 | 46.18 | |||||
| Social Credit | Nicholas James Bartman | 5,610 | 25.49 | |||||
| Liberal | Arthur Ralph Gordon Helps | 3,957 | 17.98 | |||||
| Progressive Conservative | Walter Redvers Dent | 1,700 | 7.72 | |||||
| Labor–Progressive | Mona Laufey Morgan | 578 | 2.63 | |||||
| Total valid votes | 22,007 | 100.0 | ||||||
| This riding was created from parts of Vancouver South, which elected a Liberal in the previous election. | ||||||||
See also
- List of Canadian federal electoral districts
- Past Canadian electoral districts
References
- "(Code 59032) Census Profile". 2011 census. Statistics Canada. 2012. Retrieved 2011-03-06.
- Expenditures – 2004
- Expenditures – 2000
- Expenditures – 1997
Notes
- Statistics Canada: 2012
- Vancouver Kingsway, CBC.ca, 2008.
- "Religion (13) and Age Groups (8) for Population, for Canada, Provinces, Territories and Federal Electoral Districts (2003 Representation Order), 2001 Census - 20% Sample Data". 2.statcan.gc.ca. Retrieved 2012-11-20.
- "2001 Census of Canada: Topic-based tabulations". 2.statcan.ca. 2012-07-04. Retrieved 2012-11-30.
- Candidate « Pundits' Guide to Canadian Federal Elections. Punditsguide.ca. Retrieved on 2014-04-12.
- Candidate « Pundits' Guide to Canadian Federal Elections. Punditsguide.ca. Retrieved on 2014-04-12.
- Final Report – British Columbia
- Timeline for the Redistribution of Federal Electoral Districts
- "List of confirmed candidates". Elections Canada. Retrieved October 4, 2019.
- "Election Night Results". Elections Canada. Retrieved November 15, 2019.
- Elections Canada – Confirmed candidates for Vancouver Kingsway, 30 September 2015
- Elections Canada – Preliminary Election Expenses Limits for Candidates
- Pundits' Guide to Canadian Elections
External links
- Website of the Parliament of Canada