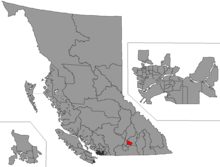
Kelowna-Lake Country (provincial electoral district)
Kelowna-Lake Country is a provincial electoral district for the Legislative Assembly of British Columbia, Canada. It should not be confused with the federal electoral district of Kelowna—Lake Country, which encompasses a somewhat larger area.
 | |||
| Provincial electoral district | |||
| Legislature | Legislative Assembly of British Columbia | ||
| MLA |
Liberal | ||
| Demographics | |||
| Population (2001) | 56,166 | ||
| Area (km²) | 1,408 | ||
| Pop. density (per km²) | 39.9 | ||
| Census divisions | Regional District of Central Okanagan | ||
| Census subdivisions | Kelowna | ||
Demographics
| Population, 2001 | 56,166 |
| Population Change, 1996–2001 | 9.5% |
| Area (km²) | 1,408 |
| Pop. Density (people per km²) | 40 |
History
1999 redistribution
Changes from Okanagan East to Kelowna-Lake Country include:
- removal of area south and southeast of Kelowna
- addition of area north of Kelowna
MLAs
History
| Assembly | Years | Member | Party | ||||
|---|---|---|---|---|---|---|---|
| South Okanagan | |||||||
| 14th | 1916–1920 | James William Jones | Conservative | ||||
| 15th | 1920–1924 | ||||||
| 16th | 1924–1928 | ||||||
| 17th | 1928–1933 | ||||||
| 18th | 1933–1937 | Joseph Allen Harris | Liberal | ||||
| 19th | 1937–1941 | Cecil Robert Bull | |||||
| 20th | 1941–1945 | William Andrew Cecil Bennett | Conservative | ||||
| 21st | 1945–1949 | Coalition | |||||
| 22nd | 1949–1951 | ||||||
| 1951–1952 | Social Credit | ||||||
| 23rd | 1952–1953 | ||||||
| 24th | 1953–1956 | ||||||
| 25th | 1956–1960 | ||||||
| 26th | 1960–1963 | ||||||
| 27th | 1963–1966 | ||||||
| 28th | 1966–1969 | ||||||
| 29th | 1969–1972 | ||||||
| 30th | 1972–1973 | ||||||
| 1973–1975 | William Richards Bennett | ||||||
| 31st | 1975–1979 | ||||||
| Okanagan South | |||||||
| 32nd | 1979–1983 | William Richards Bennett | Social Credit | ||||
| 33rd | 1983–1986 | ||||||
| Two Member District | |||||||
| 34th | 1986–1991 | Larry Chalmers | Social Credit | ||||
| Cliff Serwa | |||||||
| Okanagan East | |||||||
| 35th | 1991–1993 | Judi Tyabji | Liberal | ||||
| 1993–1996 | Independent | ||||||
| 1996 | Progressive Democratic Alliance | ||||||
| Kelowna-Lake Country | |||||||
| 36th | 1996–2001 | John Weisbeck | Liberal | ||||
| 37th | 2001–2005 | ||||||
| 38th | 2005–2009 | Al Horning | |||||
| 39th | 2009–2013 | Norm Letnick | |||||
| 40th | 2013–2017 | ||||||
| 41st | 2017–present | ||||||
Member of the Legislative Assembly
The Member of the Legislative Assembly (MLA) is Norm Letnick a former city councilor.
Election results
| 2017 British Columbia general election | ||||||||
|---|---|---|---|---|---|---|---|---|
| Party | Candidate | Votes | % | |||||
| Liberal | Norm Letnick | 13,834 | 60.14 | |||||
| New Democratic | Erik Olesen | 4,753 | 20.66 | |||||
| Green | Alison Shaw | 4,416 | 19.20 | |||||
| Total valid votes | 23,003 | 100.00 | ||||||
| Source: Elections BC[1] | ||||||||
| 2013 British Columbia general election | ||||||||
|---|---|---|---|---|---|---|---|---|
| Party | Candidate | Votes | % | |||||
| Liberal | Norm Letnick | 12,149 | 56.78 | |||||
| New Democratic | Mike Nuyens | 5,306 | 24.80 | |||||
| Conservative | Graeme James | 2,351 | 10.99 | |||||
| Green | Gary Adams | 1,591 | 7.44 | |||||
| Total valid votes | 21,397 | 100.00 | ||||||
| Total rejected ballots | 88 | 0.41 | ||||||
| Turnout | 21,485 | 47.71 | ||||||
| Source: Elections BC[2] | ||||||||
| 2009 British Columbia general election | ||||||||
|---|---|---|---|---|---|---|---|---|
| Party | Candidate | Votes | % | Expenditures | ||||
| Liberal | Norm Letnick | 10,281 | 52.11 | $119,561 | ||||
| New Democratic | Matthew Reed | 5,250 | 26.61 | $17,764 | ||||
| Conservative | Mary-Ann Graham | 2,253 | 11.42 | $21,044 | ||||
| Green | Ryan Fugger | 1,375 | 6.97 | $350 | ||||
| Independent | Alan Clarke | 571 | 2.89 | $8,830 | ||||
| Total valid votes | 19,730 | 100.00 | ||||||
| Total rejected ballots | 89 | 0.45 | ||||||
| Turnout | 19,819 | 47.25 | ||||||
| 2005 British Columbia general election | ||||||||
|---|---|---|---|---|---|---|---|---|
| Party | Candidate | Votes | % | Expenditures | ||||
| Liberal | Al Horning | 12,247 | 50.37 | $51, 907 | ||||
| New Democratic | John Pugsley | 7,390 | 30.40 | $18,967 | ||||
| Green | Kevin Ade | 2,541 | 10.45 | $4,735 | ||||
| Democratic Reform | Al Clarke | 1,793 | 7.37 | $31,253 | ||||
| Marijuana | David Hunter Thomson | 341 | 1.40 | $1,002 | ||||
| Total valid votes | 24,312 | 100.00 | ||||||
| Total rejected ballots | 147 | 0.60 | ||||||
| Turnout | 24,459 | 54.88 | ||||||
| 2001 British Columbia general election | ||||||||
|---|---|---|---|---|---|---|---|---|
| Party | Candidate | Votes | % | Expenditures | ||||
| Liberal | John Weisbeck | 14,093 | 63.19 | $38,373 | ||||
| New Democratic | Janet Elizabeth Scotland | 3,102 | 13.91 | $9,340 | ||||
| Green | Devra Lynn Rice | 2,606 | 11.68 | $1,098 | ||||
| Unity | Kevin Wendland | 1,496 | 6.71 | $1,493 | ||||
| Marijuana | Paul Halonen | 734 | 3.29 | $444 | ||||
| Action | David Thomson | 272 | 1.22 | $790 | ||||
| Total valid votes | 22,303 | 100.00 | ||||||
| Total rejected ballots | 104 | 0.47 | ||||||
| Turnout | 22,407 | 66.91 | ||||||
References
- "2017 Provincial General Election Preliminary Voting Results". Elections BC. Retrieved 11 May 2017.
- "Statement of Votes - 40th Provincial General Election" (PDF). Elections BC. Retrieved 17 May 2017.
- B.C. Votes 2017: Kelowna-Lake Country riding profile. CBC News. March 24, 2017. Retrieved April 25, 2017.
External links
This article is issued from Wikipedia. The text is licensed under Creative Commons - Attribution - Sharealike. Additional terms may apply for the media files.