Graphic organizer
A graphic organizer, also known as a knowledge map, concept map, story map, cognitive organizer, advance organizer, or concept diagram is a pedagogical tool that uses visual symbols to express knowledge and concepts through relationships between them.[1] The main purpose of a graphic organizer is to provide a visual aid to facilitate learning and instruction.[1][2]
Types of organizers
Graphic organizers take many forms:
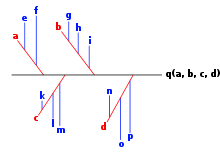
Ishikawa's cause and effect diagram (fishbone chart)
- Relational organizers
- Storyboard
- Fishbone - Ishikawa diagram
- Cause and effect web
- Chart
- Category/classification organizers
- Concept mapping
- KWL tables
- Mind mapping
- Sequence organizers
- Compare contrast organizers
- Concept development organizers
- Story web
- Word web
- Circle chart
- Flow chart
- Options and control device organizers
Enhancing students' skills
A review study concluded that using graphic organizers improves student performance in the following areas:[3]
- Retention
- Students remember information better and can better recall it when it is represented and learned both visually and verbally.[3]
- Reading comprehension
- The use of graphic organizers helps improving the reading comprehension of students.[3]
- Student achievement
- Students with and without learning disabilities improve achievement across content areas and grade levels.[3]
- Thinking and learning skills; critical thinking
- When students develop and use a graphic organizer their higher order thinking and critical thinking skills are enhanced.[3]
See also
- Four Square Writing Method
- KWL table
- Thinking Maps
- Visualization
References
- "Instructional Strategies". Olc.spsd.sk.ca. 1999-01-01. Archived from the original on 2013-03-10. Retrieved 2012-10-13.
- Compare: "50 Uses of Graphic Organizers and Rubric". University of Wisconsin Stout: School of Education. University of Wisconsin. Retrieved 2016-08-12.
- Graphic Organizers: A Review of Scientifically Based Research, The Institute for the Advancement of Research in Education at AEL
This article is issued from Wikipedia. The text is licensed under Creative Commons - Attribution - Sharealike. Additional terms may apply for the media files.