Ben Shneiderman
Ben Shneiderman (born August 21, 1947) is an American computer scientist, a Distinguished University Professor in the University of Maryland Department of Computer Science, which is part of the University of Maryland College of Computer, Mathematical, and Natural Sciences at the University of Maryland, College Park, and the founding director (1983-2000) of the University of Maryland Human-Computer Interaction Lab. He conducted fundamental research in the field of human–computer interaction, developing new ideas, methods, and tools such as the direct manipulation interface, and his eight rules of design.[1]
Ben Shneiderman | |
|---|---|
 | |
| Born | August 21, 1947 New York City, New York |
| Nationality | American |
| Alma mater | Stony Brook University |
| Known for | Nassi–Shneiderman diagram, treemap, Information Visualization, HyperLink, Touchscreen, Direct manipulation interface |
| Awards | Member National Academy of Engineering, ACM Fellow, AAAS Fellow, IEEE Fellow, IEEE Visualization Career Award, SIGCHI LifeTime Achievement, Miles Conrad Award, National Academy of Inventors Fellow |
| Scientific career | |
| Fields | Computer science, human–computer interaction, information visualization social media |
| Institutions | University of Maryland, College Park |
| Doctoral advisor | Jack Heller |
| Doctoral students | Andrew Sears |
Biography
Born in New York, Shneiderman, attended the Bronx High School of Science, and received a BS in Mathematics and Physics from the City College of New York in 1968. He then went on to study at the State University of New York at Stony Brook, where he received an MS in Computer Science in 1972 and graduated with a PhD in 1973.
Shneiderman started his academic career at the State University of New York at Farmingdale in 1968 as instructor at the Department of Data Processing. In the last year before his graduation he was instructor at the Department of Computer Science of Stony Brook University (then called State University of New York at Stony Brook). In 1973 he was appointed Assistant Professor at the Indiana University, Department of Computer Science. In 1976 he moved to the University of Maryland. He started out as Assistant Professor in its Department of Information Systems Management, and became Associate Professor in 1979. In 1983 he moved to its Department of Computer Science as Associate Professor, and was promoted to full professor in 1989. In 1983 he was the Founding Director of its Human-Computer Interaction Lab, which he directed until 2000.[2]
Shneiderman was inducted as a Fellow of the Association for Computing Machinery in 1997, a Fellow of the American Association for the Advancement of Science in 2001, a Member of the National Academy of Engineering in 2010, an IEEE Fellow in 2012[3] and a Fellow of the National Academy of Inventors in 2015.[4] He is an ACM CHI Academy Member and received their Lifetime Achievement Award in 2001.[5] He received the IEEE Visualization Career Award in 2012 and was inducted into the IEEE VIS Academy in 2019.
In 2002 his book Leonardo's Laptop: Human Needs and the New Computing Technologies was Winner of an IEEE-USA Award for Distinguished Contributions Furthering Public Understanding of the Profession. His 2016 book, The New ABCs of Research: Achieving Breakthrough Collaborations, encourages applied and basic research to be combined. In 2019, he published Encounters with HCI Pioneers: A Personal History and Photo Journal.
He received Honorary Doctorates from the University of Guelph (Canada) in 1995, the University of Castile-La Mancha (Spain) in 2010,[6] the Stony Brook University in 2015.,[7] the University of Melbourne in 2017, Swansea University (in Wales, UK) in 2018, and University of Pretoria (in South Africa) in 2018.
Work
Nassi–Shneiderman diagram
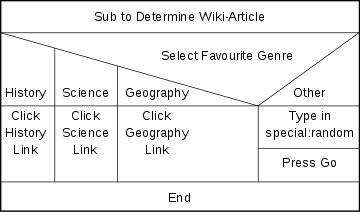
In the 1973 article "Flowchart techniques for structured programming" presented at a 1973 SIGPLAN meeting Isaac Nassi and Ben Shneiderman argued:
With the advent of structured programming and GOTO-less programming a method is needed to model computation in simply ordered structures, each representing a complete thought possibly defined in terms of other thoughts as yet undefined. A model is needed which prevents unrestricted transfers of control and has a control structure closer to languages amenable to structured programming. We present an attempt at such a model.[8]
The new model technique for structured programming they presented has become known as the Nassi–Shneiderman diagram; a graphical representation of the design of structured software.[9]
Flowchart research
In the 1970s Shneiderman continued to study programmers, and the use of flow charts. In the 1977 article "Experimental investigations of the utility of detailed flowcharts in programming" Shneiderman et al. summarized the origin and status quo of flowcharts in computer programming:
Flowcharts have been a part of computer programming since the introduction of computers in the 1940s. In 1947 Goldstein and von Neumann [7] presented a system of describing processes using operation, assertion, and alternative boxes. They felt that "coding begins with the drawing of flow diagram." Prior to coding, the algorithm had been identified and understood. The flowchart represented a high level definition of the solution to be implemented on a machine. Although they were working only with numerical algorithms, they proposed a programming methodology which has since become standard practice in the computer programming field. [10]
Furthermore, Shneiderman had conducted experiments which suggested that flowcharts were not helpful for writing, understanding, or modifying computer programs. At the end of their 1977 paper, Shneiderman et al. concluded:
Although our original intention was to ascertain under which conditions detailed flowcharts were most helpful, our repeated negative results have led us to a more skeptical opinion of the utility of detailed flowcharts under modern programming conditions. We repeatedly selected problems and tried to create test conditions which would favor the flowchart groups, but found no statistically significant differences between the flowchart and non-flowchart groups. In some cases the mean scores for the non-flowchart groups even surpassed the means for the flowchart groups. We conjecture that detailed flowcharts are merely a redundant presentation of the information contained in the programming language statements. The flowcharts may even be at a disadvantage because they are not as complete (omitting declarations, statement labels, and input/output formats) and require many more pages than do the concise programming language statements.[11]
Designing the User Interface, 1986
In 1986, he published the first edition (now on its sixth edition) of his book "Designing the User Interface: Strategies for Effective Human-Computer Interaction." Included in this book is his most popular list of "Eight Golden Rules of Interface Design," which read:
- Strive for consistency. Consistent sequences of actions should be required in similar situations ...
- Enable frequent users to use shortcuts. As the frequency of use increases, so do the user's desires to reduce the number of interactions ...
- Offer informative feedback. For every operator action, there should be some system feedback ...
- Design dialog to yield closure. Sequences of actions should be organized into groups with a beginning, middle, and end ...
- Offer simple error handling. As much as possible, design the system so the user cannot make a serious error ...
- Permit easy reversal of actions. This feature relieves anxiety, since the user knows that errors can be undone ...
- Support internal locus of control. Experienced operators strongly desire the sense that they are in charge of the system and that the system responds to their actions. Design the system to make users the initiators of actions rather than the responders.
- Reduce short-term memory load. The limitation of human information processing in short-term memory requires that displays be kept simple, multiple page displays be consolidated, window-motion frequency be reduced, and sufficient training time be allotted for codes, mnemonics, and sequences of actions.[12]
These guidelines are frequently taught in courses on Human-Computer Interaction.
The Craft of Information Visualization: Readings and Reflections, 2003
In 2003, Ben Bederson and Ben Shneiderman coauthored the book "The Craft of Information Visualization: Readings and Reflections". Included in Chapter 8: Theories for Understanding Information Visualization in this book are five goals of theories for HCI practitioners and researchers, which read:
The typical goals of theories are to enable practitioners and researchers to:
- Describe objects and actions in a consistent and clear manner to enable cooperation
- Explain processes to support education and training
- Predict performance in normal and novel situations so as to increase the chances of success
- Prescribe guidelines, recommend best practices, and caution about dangers
- Generate novel ideas to improve research and practice.[13]
These goals are frequently taught in courses on Human-Computer Interaction and cited in works by authors such as Yvonne Rogers, Victor Kaptelinin, and Bonnie Nardi.
Direct manipulation interface
Shneiderman's cognitive analysis of user needs led to principles of direct manipulation interface design in 1982: (1) continuous representation of the objects and actions, (2) rapid, incremental, and reversible actions, and (3) physical actions and gestures to replace typed commands, which enabled designers to craft more effective graphical user interfaces. He applied those principles to design innovative user interfaces such as the highlighted selectable phrases in text, that were used in the commercially successful Hyperties.[14] Hyperties was used to author the world's first electronic scientific journal issue, which was the July 1988 issue of the Communications of the ACM[15] with seven papers from the 1987 Hypertext conference. It was made available as a floppy disk accompanying the printed journal. Tim Berners-Lee cited this disk as the source for his "hot spots" in his Spring 1989 manifesto[16] for the World Wide Web. Hyperties was also used to create the world's first commercial electronic book, Hypertext Hands-On! in 1988.
Direct manipulation concepts led to touchscreen interfaces for home controls, finger-painting, and the now ubiquitous small touchscreen keyboards. The development of the "Lift-off strategy"[17] by University of Maryland Human–Computer Interaction Lab (HCIL) researchers enabled users to touch the screen, getting feedback as to what will be selected, adjust their finger position, and complete the selection by lifting the finger off the screen.
The HCIL team applied direct manipulation principles for touchscreen home automation systems, finger-painting programs,[18] and the double-box range sliders[19] that gained prominence by their inclusion in Spotfire. The visual presentation inherent in direct manipulation emphasized the opportunity for information visualization.
Information visualization
His major work in recent years has been on information visualization, originating the treemap concept for hierarchical data.[20] Treemaps are implemented in most information visualization tools including Spotfire, Tableau Software, QlikView, SAS, JMP, and Microsoft Excel. Treemaps are included in hard drive exploration tools, stock market data analysis, census systems, election data, gene expression, and data journalism. The artistic side of treemaps are on view in the Treemap Art Project.
He also developed dynamic queries sliders with multiple coordinated displays that are a key component of Spotfire, which was acquired by TIBCO in 2007. His work continued on visual analysis tools for time series data, TimeSearcher, high dimensional data, Hierarchical Clustering Explorer, and social network data, SocialAction.[21] Shneiderman contributed to the widely used social network analysis and visualization tool NodeXL.
Current work deals with visualization of temporal event sequences, such as found in Electronic Health Records, in systems such as LifeLines2[22] and EventFlow.[23] These tools visualize the categorical data that make up a single patient history and they present an aggregated view that enables analysts to find patterns in large patient history databases.
Taxonomy of interactive dynamics for visual analysis, 2012
In 2012, Jeffrey Heer and Ben Shneiderman coauthored the article “Interactive Dynamics for Visual Analysis” in Association for Computing Machinery Queue vol. 10, no. 2. Included in this article is a taxonomy of interactive dynamics to assist researchers, designers, analysts, educators, and students in evaluating and creating visual analysis tools. The taxonomy consists of 12 task types grouped into three high-level categories, as shown below.
| Data & View Specification | Visualize data by choosing visual encodings. Filter out data to focus on relevant items. |
|---|---|
| View Manipulation | Select items to highlight, filter, or manipulate them. Navigate to examine high-level patterns and low-level detail. |
| Process & Provenance | Record analysis histories for revisitation, review, and sharing. Annotate patterns to document findings. |
Universal usability
He also defined the research area of universal usability to encourage greater attention to diverse users, languages, cultures, screen sizes, network speeds, and technology platforms.
Publications
- List of his articles[25][26]
- Shneiderman, Ben. The New ABCs of Research: Achieving Breakthrough Collaborations; Oxford University Press, 2016 .
- Shneiderman, Ben. Software Psychology: Human Factors in Computer and Information Systems; Little, Brown and Co, 1980.
- Shneiderman, Ben. Designing the User Interface: Strategies for Effective Human–Computer Interaction, 1st edition. Addison-Wesley, 1986; 2nd ed. 1992; 3rd ed. 1998; 4th ed. 2005; 5th ed. 2010; 6th ed., 2016.
- Card, Stuart K., Jock D. Mackinlay, and Ben Shneiderman, eds. Readings in Information Visualization: Using Vision to Think. Morgan Kaufmann, 1999.
- Shneiderman, Ben. Leonardo's Laptop: Human Needs and the New Computing Technologies; MIT Press, 2002.
- Hansen, Derek, Ben Shneiderman, and Marc A. Smith. Analyzing social media networks with NodeXL: Insights from a connected world. Morgan Kaufmann, 2010.
- Johnson, Brian, and Ben Shneiderman. "Tree-maps: A space-filling approach to the visualization of hierarchical information structures." Visualization, 1991. Visualization'91, Proceedings., IEEE Conference on. IEEE, 1991.
- Shneiderman, Ben. "Tree visualization with tree-maps: 2-d space-filling approach." ACM Transactions on Graphics 11.1 (1992): 92–99.
- Ahlberg, Christopher, and Ben Shneiderman. "Visual information seeking: tight coupling of dynamic query filters with starfield displays." Proceedings of the SIGCHI conference on Human factors in computing systems. ACM, 1994.
- Shneiderman, Ben. "The eyes have it: A task by data type taxonomy for information visualizations." Visual Languages, 1996. Proceedings., IEEE Symposium on. IEEE, 1996.
- Bederson, B., Shneiderman, B. 2003. The Craft of Information Visualization: Readings and Reflections. Morgan Kaufmann.
- Heer, J., Shneiderman, B. 2012. Interactive Dynamics for Visual Analysis. ACM Queue, 10(2), Issue 2.
- Shneiderman, B. (2020). Human-Centered Artificial Intelligence: Reliable, Safe & Trustworthy. International Journal of Human–Computer Interaction, 1-10.
References
- "Shneiderman's Eight Golden Rules of Interface Design". Retrieved December 4, 2015.
- CURRICULUM VITAE (June 20, 2014) at cs.umd.edu. Accessed 14-04-2015.
- 2012 Newly Elevated Fellows Archived February 15, 2012, at the Wayback Machine, IEEE, accessed 2011-12-10.
- "Colwell Named a Fellow in the National Academy of Inventors | UMIACS".
- "Archived copy". Archived from the original on September 7, 2015. Retrieved December 4, 2015.CS1 maint: archived copy as title (link)
- Doctorado Honoris Causa de Ben Shneiderman Archived September 2, 2011, at the Wayback Machine (in Spanish)
- "Newsday | Long Island's & NYC's News Source | Newsday".
- Nassi, Isaac, and Ben Shneiderman. "Flowchart techniques for structured programming.|ACM SIGPLAN Notices 8.8 (1973): 12-26.
- Ben Shneiderman. "A short history of structured flowcharts (Nassi–Shneiderman diagram)," at www.cs.umd.edu. May 27, 2003.
- B. Shneiderman, R. Mayer, D. McKay, and P. Heller. "Experimental investigations of the utility of detailed flowcharts in programming," Communications of the ACM, Vol. 20, Iss. 6, June 1977.
- Shneiderman et al. (1977, p. 380)
- Shneiderman (1998, p. 75); as cited in: "Eight Golden Rules of Interface Design". at www.cs.umd.edu. Accessed 15.04.2015.
- Bederson, B., Shneiderman, B. 2003. The Craft of Information Visualization: Readings and Reflections. Morgan Kaufmann, p.349-351.
- "Hypertext Research: The Development of HyperTIES".
- "July 1988 Table of Contents | Communications of the ACM".
- "The original proposal of the WWW, HTMLized".
- Potter, R., Weldon, L., Shneiderman, B. Improving the accuracy of touch screens: an experimental evaluation of three strategies. Proc. of the Conference on Human Factors in Computing Systems, CHI '88. Washington, DC. pp. 27–32. doi:10.1145/57167.57171. Archived from the original on December 8, 2015.CS1 maint: uses authors parameter (link)
- "Dynamic queries, starfield displays, and the path to Spotfire".
- history page
- "SocialAction". University of Maryland. December 30, 2007. Retrieved December 30, 2007.
- "Lifelines2". umd.edu. Retrieved September 23, 2011.
- "EventFlow". umd.edu. Retrieved March 11, 2015.
- Heer, J., Shneiderman, B. 2012. Interactive Dynamics for Visual Analysis. ACM Queue, 10(2), Issue 2, 1-22.
- Ben Shneiderman at DBLP Bibliography Server

- Ben Shneiderman publications indexed by Google Scholar
External links
| Wikimedia Commons has media related to Ben Shneiderman. |
- Ben Shneiderman's home page
- Ben Shneiderman's channel on YouTube
- Treemap Art Project
- Interviewed by Alan Macfarlane 7 August 2009 (video)
| Authority control |
|
|---|