Genetics and archaeogenetics of South Asia
Genetics and archaeogenetics of South Asia is the study of the genetics and archaeogenetics of the ethnic groups of South Asia. It aims at uncovering these groups' genetic history. The geographic position of South Asia makes its biodiversity important for the study of the early dispersal of anatomically modern humans across Asia.
Studies based on Mitochondrial DNA (mtDNA) variations have reported genetic unity across various South Asian sub–populations.[1][2][3][4] Conclusions of studies based on Y Chromosome variation and Autosomal DNA variation have been varied, although many researchers argue that most of the ancestral nodes of the phylogenetic tree of all the mtDNA types originated in South Asia. Recent genome studies appear to show that most South Asians are descendants of two major ancestral components, one restricted to South Asia (Ancestral South Indian, deriving from IVC-people and a native South Asian population possibly distantly related to the Andamanese) and the other component (Ancestral North Indian) derived from IVC-people and Steppe-people, making it more closely related to those in Central Asia, West Asia and Europe.[5][6][7] Genomic studies have described the genetic landscape of South Asia as a composite of West Eurasian and East Asian exogenous components that mixed with the indigenous South Asian groups to create modern-day South Asians.[8] The East Asian ancestry component detected in South Asia is mainly restricted to specific populations in the Himalayan foothills and northeastern part of India.
It has been found that the ancestral node of the phylogenetic tree of all the mtDNA types (mitochondrial DNA haplogroups) typically found in Central Asia, the West Asia and Europe are also to be found in South Asia at relatively high frequencies. The inferred divergence of this common ancestral node is estimated to have occurred slightly less than 50,000 years ago.[9] In India, the major maternal lineages are various M subclades, followed by R and U sublineages. These mitochondrial haplogroups' coalescence times have been approximated to date to 50,000 BP.[9]
The major paternal lineages represented by Y chromosomes are haplogroups R1a1, R2, H, L and Haplogroup J2.[10] Some researchers have argued that Y-DNA Haplogroup R1a1 (M17) is of autochthonous South Asian origin.[11][12] However, proposals for a Central Asian origin for R1a1 are also quite common.[13][14]
Overview
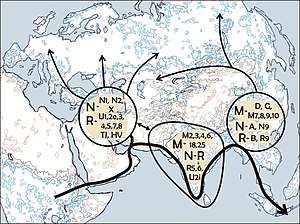
All the mtDNA and Y-chromosome lineages outside Africa descend from three founder lineages:
All these six founder haplogroups can be found in the present day populations of South Asia. Moreover, the mtDNA haplogroup M and the Y-chromosome haplogroups C and D are restricted to the area east of South Asia. All the West Eurasian populations derive from the N and R haplogroups of mtDNA and the F haplogroup of the Y-chromosome.[15]
Endicott et al. state that these facts are consistent with the hypothesis of a single exodus from East Africa 65,000 years ago via a southern coastal route, with the West Eurasian lineages separating from the South Asian lineages somewhere between East/Northeast Africa and South Asia.[16]
The predominant majority genome markers of South Asians are all closely related to West Eurasians and may have either originated in Western Asia or South Asia itself.[17]
mtDNA
The most frequent mtDNA haplogroups in South Asia are M, R and U (where U is a descendant of R).[10]
Arguing for the longer term "rival Y-Chromosome model",[11] Stephen Oppenheimer believes that it is highly suggestive that India is the origin of the Eurasian mtDNA haplogroups which he calls the "Eurasian Eves". According to Oppenheimer it is highly probable that nearly all human maternal lineages in Central Asia, the Middle East and Europe descended from only four mtDNA lines that originated in South Asia 50,000–100,000 years ago.[18]
Macrohaplogroup M
The macrohaplogroup M, which is considered as a cluster of the proto-Asian maternal lineages,[9] represents more than 60% of South Asian MtDNA.[19]
The M macrohaplotype in India includes many subgroups that differ profoundly from other sublineages in East Asia especially Mongoloid populations.[9] The deep roots of M phylogeny clearly ascertain the relic of South Asian lineages as compared to other M sub lineages (in East Asia and elsewhere) suggesting 'in-situ' origin of these sub-haplogroups in South Asia, most likely in India. These deep rooting lineages are not language specific and spread over all the language groups in India.[19]
Virtually all modern Central Asian MtDNA M lineages seem to belong to the Eastern Eurasian (Mongolian) rather than the South Asian subtypes of haplogroup M, which indicates that no large-scale migration from the present Turkic-speaking populations of Central Asia occurred to India. The absence of haplogroup M in Europeans, compared to its equally high frequency among South Asians, East Asians and in some Central Asian populations contrasts with the Western Eurasian leanings of South Asian paternal lineages.[9]
Most of the extant mtDNA boundaries in South and Southwest Asia were likely shaped during the initial settlement of Eurasia by anatomically modern humans.[20]
| Haplogroup | Important Sub clades | Populations |
|---|---|---|
| M2 | M2a, M2b | Throughout the continent with low presence in Northwest Peaking in Bangladesh, Andhra Pradesh, coastal Tamil Nadu and Sri Lanka |
| M3 | M3a | Concentrated into northwestern India Highest amongst the Parsees of Mumbai |
| M4 | M4a | Peaks in Pakistan, Kashmir and Andhra Pradesh |
| M6 | M6a, M6b | Kashmir and near the coasts of the Bay of Bengal, Sri Lanka |
| M18 | Throughout South Asia Peaking at Rajasthan and Andhra Pradesh | |
| M25 | Moderately frequent in Kerala and Maharashtra but rather infrequent elsewhere in India |
Macrohaplogroup R


The macrohaplogroup R (a very large and old subdivision of macrohaplogroup N) is also widely represented and accounts for the other 40% of South Asian MtDNA. A very old and most important subdivision of it is haplogroup U that, while also present in West Eurasia, has several subclades specific to South Asia.
Most important South Asian haplogroups within R:[20]
| Haplogroup | Populations |
|---|---|
| R2 | Distributed widely across the sub continent |
| R5 | widely distributed by most of India. Peaks in coastal SW India |
| R6 | widespread at low rates across India. Peaks among Tamils and Kashmiris |
| W | Found in northwestern states. Peaks in Gujarat, Punjab and Kashmir, frequency is low elsewhere. |
Haplogroup U
Haplogroup U is a sub-haplogroup of macrohaplogroup R.[20] The distribution of haplogroup U is a mirror image of that for haplogroup M: the former has not been described so far among eastern Asians but is frequent in European populations as well as among South Asians.[21] South Asian U lineages differ substantially from those in Europe and their coalescence to a common ancestor also dates back to about 50,000 years.[1]
| Haplogroup | Populations |
|---|---|
| U2* | (a parahaplogroup) is sparsely distributed specially in the northern half of the South Asia.
It is also found in SW Arabia. |
| U2a | shows relatively high density in Pakistan and NW India but also in Karnataka, where it reaches its higher density. |
| U2b | has highest concentration in Uttar Pradesh but is also found in many other places, specially in Kerala and Sri Lanka.
It is also found in Oman. |
| U2c | is specially important in Bangladesh and West Bengal. |
| U2l | is maybe the most important numerically among U subclades in South Asia, reaching specially high concentrations (over 10%) in Uttar Pradesh, Sri Lanka, Sindh and parts of Karnataka. It also has some importance in Oman. mtDNA haplogroup U2i is dubbed "Western Eurasian" in Bamshad et al. study but "Eastern Eurasian (mostly India specific)" in Kivisild et al. study. |
| U7 | this haplogroup has a significant presence in Gujarat, Punjab and Pakistan. The possible homeland of this haplogroup spans Gujarat (highest frequency, 12%) and Iran because from there its frequency declines steeply both to the east and to the west. |
Y chromosome
.PNG)
The major South Asian Y-chromosome DNA haplogroups are H, J2, L, R1a1 and R2.[10] Their geographical origins are listed as follows, according to the latest scholarship:
| Major South Asian Y-chromosomal lineages: | H | J2 | L | R1a | R2 |
|---|---|---|---|---|---|
| Basu et al. (2003) | no comment | no comment | no comment | Central Asia | no comment |
| Kivisild et al. (2003) | India | Western Asia | India | Southern and Western Asia | South-Central Asia |
| Cordaux et al. (2004) | India | West or Central Asia | Middle Eastern | Central Asia | South-Central Asia |
| Sengupta et al. (2006) | India | The Middle East and Central Asia | South India | North India | North India |
| Thanseem et al. (2006) | India | The Levant | The Middle East | Southern and Central Asia | Southern and Central Asia |
| Sahoo et al. (2006) | South Asia | The Near East | South Asia | South or West Asia | South Asia |
| Mirabal et al. (2009) | no comment | no comment | no comment | Northwestern India or Central Asia | no comment |
| Zhao et al. (2009) | India | The Middle East | The Middle East | Central Asia or West Eurasia | Central Asia or West Eurasia |
| Sharma et al. (2009) | no comment | no comment | no comment | South Asia | no comment |
| Thangaraj et al. (2010) | South Asia | The Near East | The Near East | South Asia | South Asia |
Haplogroup H
Haplogroup H (Y-DNA) is found at a high frequency in South Asia. H is today rarely found outside of the South Asia but is common among the Romanis, particularly the H-M82 subgroup. H was also quite common in ancient samples of Europe and is still found today at a low frequency in Europeans and Arabs of the Levant. Haplogroup H is frequently found among populations of India, Sri Lanka, Nepal, Pakistan and the Maldives. All three branches of Haplogroup H (Y-DNA) are found in South Asia.
It is a branch of Haplogroup F and descends from GHIJK family. Haplogroup H is believed to have arisen in South Asia between 30,000 and 40,000 years ago.[22] Its probable site of introduction is South Asia, since it is concentrated there. It seems to represent the main Y-Chromosome haplogroup of the paleolithic inhabitants of South Asia. Some individuals in South Asia have also been shown to belong to the much rarer subclade H3 (Z5857).[22] Haplogroup H is by no means restricted to specific populations. For example, H is possessed by about 28.8% of Indo-Aryan castes.[11][23] and in tribals about 25–35%.[13][23]
Haplogroup J2
Haplogroup J2 reflects presence from neolithic period in South Asia.[24] The frequency of J2 is higher among a few[25] South Indian castes (19% to 34%) than in North Indian castes (11% to 27%) which are higher in overall actual numbers or Pakistan (12% to 24%).[11] Haplogroup J2 frequency is higher south Indian middle castes at 21%, followed by upper castes at 18.6%, and lower castes 14%.[11] Among caste groups, the highest frequency of J2-M172 was observed among Tamil Vellalar's of South India, at 38.7%.[11] J2 is present in tribals too and has a frequency of 11% in Austro-Asiatic tribals. Among the Austro-Asiatic tribals, the predominant J2 occurs in the Lodha (35%).[11] J2 is also present in the South Indian hill tribe Toda at 38.46%,[26] in the Andh tribe of Telangana at 35.19%[13] and in the Kol tribe of Uttar Pradesh at a frequency of 33.34%.[27] Haplogroup J-P209 was found to be more common in India's Shia Muslims, of which 28.7% belong to haplogroup J, with 13.7% in J-M410, 10.6% in J-M267 and 4.4% in J2b (Eaaswarkhanth 2009).
In Pakistan, the highest frequencies of J2-M172 were observed among the Parsis at 38.89%, the Dravidian speaking Brahuis at 28.18% and the Makrani Balochs at 24%.[28] It also occurs at 18.18% in Makrani Siddis and at 3% in Karnataka Siddis.[28][29]
Overall, in India J2 is found at a much higher overall frequency in North India than the South.[25] J2-M172 is found at an overall frequency of 10.3% among the Sinhalese people of Sri Lanka.[30] In Maldives, 22% of Maldivian population were found to be haplogroup J2 positive.
Haplogroup L
According to Dr. Spencer Wells, L-M20 originated in the Pamir Knot region in Tajikistan and migrated into Pakistan and India ca. 30,000 years ago.[31][32][33] However, most other studies have proposed a West Asian origin for L-M20 and associated its expansion in the Indus valley (~7,000 YBP) to neolithic farmers.[28][34][13][23][35][36] There are three subbranches of haplogroup L: L1-M76 (L1a1), L2-M317 (L1b) and L3-M357 (L1a2), found at varying levels in South Asia.[11]
India
Haplogroup L shows time of neolithic expansion.[24] The clade is present in the Indian population at an overall frequency of ca. 7–15%.[11][13][37][23] Haplogroup L has higher frequency among south Indian castes (ca. 17–19%) and reaches up to 68% in some castes in Karnataka but is somewhat rarer in north Indian castes (ca. 5–6%).[11][11] The presence of haplogroup L is quite rare among tribal groups (ca. 5,6–7%),[11][13][23] however a moderate, 14.6% has been observed among the Chenchus.[30]
Among regional and social groups, moderate to high frequencies have been observed in Konkanastha Brahmins (18.6%), Punjabis (12.1%), Gujaratis (10.4%), Lambadis (17.1%), Jats (36.8%)[30][32]
Pakistan
In Pakistan, L1-M76 and L3-M357 subclades of L-M20 reaches overall frequencies of 5.1% and 6.8%, respectively.[11] Haplogroup L3 (M357) is found frequently among Burusho (approx. 12%[38]) and Pashtuns (approx. 7%[38]). Its highest frequency can be found in south western Balochistan province along the Makran coast (28%) to Indus River delta. L3a (PK3) is found in approximately 23% of Nuristani in northwest Pakistan.[38]
The clade is present in moderate distribution among the general Pakistani population (14% approx).[39][40]
Sri Lanka
In one study, 16% of the Sinhalese were found to be Haplogroup L-M20 positive.[41] In another study 18% were found to belong to L1.[30]
Haplogroup R1a1
In South Asia, R1a1 has been observed often with high frequency in a number of demographic groups,[12][42][43] as well as with highest STR diversity which lead some to see it as the locus of origin.[30][27][44]
While R1a originated ca. 22,000[27] to 25,000[45] years ago, its subclade M417 (R1a1a1) diversified ca. 5,800 years ago.[45] The distribution of M417-subclades R1-Z282 (including R1-Z280)[46] in Central- and Eastern Europe and R1-Z93 in Asia[46][45] suggests that R1a1a diversified within the Eurasian Steppes or the Middle East and Caucasus region.[46] The place of origin of these subclades plays a role in the debate about the origins of Indo-Europeans.
India
In India, high percentage of this haplogroup is observed in West Bengal Brahmins (72%)[42] to the east, Gujarat Lohanas (60%)[43] to the west, Khatris (67%)[43] in north, Iyengar Brahmins (31%) in the south.[42] It has also been found in several South Indian Dravidian-speaking tribals including the Kotas (41%) of Tamil Nadu[47] Chenchu (26%) and Valmikis of Andhra Pradesh[30] as well as the Yadav and Kallar of Tamil Nadu suggesting that M17 is widespread in these Southern Indians tribes.[30] Besides these, studies show high percentages in regionally diverse groups such as Manipuris (50%) [43] to the extreme North East and in among Punjabis (47%)[30] to the extreme North West.
Pakistan
In Pakistan, it is found at 71% among the Mohanna of Sindh Province to the south and 46% among the Baltis of Gilgit-Baltistan to the north.[43]
Sri Lanka
23% of the Sinhalese people out of a sample of 87 subjects were found to be R1a1a (R-SRY1532) positive according to a 2003 research.[41]
Maldives
In Maldives, 24% of the Maldivian people were found to be R1a1a (M17) positive.
Haplogroup R2
In South Asia, the frequency of R2 and R2a lineage is around 10–15% in India and Sri Lanka and 7–8% in Pakistan. At least 90% of R-M124 individuals are located in South Asia.[49] It is also reported in Caucasus and Central Asia at lower frequency. A genetic study by Mondal et al. 2017 concluded that haplogroup Haplogroup R2 originated in northern India and was already present before the Steppe migration.[50]
India
Among regional groups, it is found among West Bengalis (23%), New Delhi Hindus (20%), Punjabis (5%) and Gujaratis (3%).[30] Among tribal groups, Karmalis of West Bengal showed highest at 100%[12] followed by Lodhas (43%)[51] to the east, while Bhil of Gujarat in the west were at 18%,[27] Tharus of north showed it at 17%,[4] Chenchu and Pallan of south were at 20% and 14% respectively.[12][11] Among caste groups, high percentages are shown by Jaunpur Kshatriyas (87%), kamma (73%), Bihar Yadav (50%), Khandayat (46%)and Kallar (44%).[12]
It is also significantly high in many Brahmin groups including Punjabi Brahmins (25%), Bengali Brahmins (22%), Konkanastha Brahmins (20%), Chaturvedis (32%), Bhargavas (32%), Kashmiri Pandits (14%) and Lingayat Brahmins (30%).[27][14][4][12]
North Indian Muslims have a frequency of 19% (Sunni) and 13% (Shia),[14] while Dawoodi Bohra Muslim in the western state of Gujarat have a frequency of 16% and Mappila Muslims of South India have a frequency of 5%.[52]
Pakistan
The R2 haplogroup is found in 14% of the Burusho people.[38] Among the Hunza people it is found at 18% while the Parsis show it at 20%. It is also found in the northeastern part of Afghanistan.
Sri Lanka
38% of the Sinhalese of Sri Lanka were found to be R2 positive according to a 2003 research.[30]
Maldives
13% of the Maldivian people of Maldives are found to have R2
Reconstructing South Asian population history
The Indian Genome Variation Consortium (2008), divides the population of South Asia into four ethnolinguistic groups: Indo-European, Dravidian, Tibeto-Burman and Austro-Asiatic.[53][54][55][56][57] The molecular anthropology studies use three different type of markers: Mitochondrial DNA (mtDNA) variation which is maternally inherited and highly polymorphic, Y Chromosome variation which involves uniparental transmission along the male lines, and Autosomal DNA variation.[4]:04
mtDNA variation
Most of the studies based on mtDNA variation have reported genetic unity of South Asian populations across language, caste and tribal groups.[1][2][3] It is likely that haplogroup M was brought to Asia from East Africa along the southern route by earliest migration wave 78,000 years ago.[1]
According to Kivisild et al. (1999), "Minor overlaps with lineages described in other Eurasian populations clearly demonstrate that recent immigrations have had very little impact on the innate structure of the maternal gene pool of South Asians. Despite the variations found within India, these populations stem from a limited number of founder lineages. These lineages were most likely introduced to South Asia during the Middle Palaeolithic, before the peopling of Europe 48,000 years ago and perhaps the Old World in general."[1] Basu et al. (2003) also emphasises underlying unity of female lineages in India.[37]
Y Chromosome variation
Conclusions based on Y Chromosome variation have been more varied than those based on mtDNA variation. While Kivisild et al. (2003) proposes an ancient and shared genetic heritage of male lineages in South Asia, Bamshad et al. (2001) suggests an affinity between South Asian male lineages and west Eurasians proportionate to upper caste rank and places upper caste populations of southern Indian states closer to East Europeans.[58]
Basu et al. (2003) concludes that Austro–Asiatic tribal populations entered India first from the Northwest corridor and much later some of them through Northeastern corridor.[37] Whereas, Kumar et al. (2007) analysed 25 South Asian Austro-Asiatic tribes and found strong paternal genetic link among the sub-linguistic groups of the South Asian Austro-Asiatic populations.[51] Mukherjee et al. (2001) places Pakistanis and North Indians between west Asian and Central Asian populations,[59] whereas Cordaux et al. (2004) argues that the Indian caste populations are closer to Central Asian populations.[23] Sahoo et al. (2006) and Sengupata et al. (2006) suggest that Indian caste populations have not been subject to any recent admixtures.[11][12] Sanghamitra Sahoo concludes his study with:[12]
It is not necessary, based on the current evidence, to look beyond South Asia for the origins of the paternal heritage of the majority of Indians at the time of the onset of settled agriculture. The perennial concept of people, language, and agriculture arriving to India together through the northwest corridor does not hold up to close scrutiny. Recent claims for a linkage of haplogroups J2, L, R1a, and R2 with a contemporaneous origin for the majority of the Indian castes’ paternal lineages from outside the South Asia are rejected, although our findings do support a local origin of haplogroups F* and H. Of the others, only J2 indicates an unambiguous recent external contribution, from West Asia rather than Central Asia. The current distributions of haplogroup frequencies are, with the exception of the lineages, predominantly driven by geographical, rather than cultural determinants. Ironically, it is in the northeast of India, among the TB groups that there is clear-cut evidence for large-scale demic diffusion traceable by genes, culture, and language, but apparently not by agriculture.
Closest neighbor analysis done by Mondal et al. 2017 concluded that Indian Y-lineages are close to southern European populations and the time of divergence between the two predated Steppe migration.":[60]
These results suggest that the European-related ancestry in Indian populations might be much older and more complex than anticipated, and might originate from the first wave of agriculturists or even earlier
— Mondal et al. 2017
Autosomal DNA variation
AASI-ANI-ASI
Results of studies based upon autosomal DNA variation have also been varied. In a major study (2009) using over 500,000 biallelic autosomal markers, Reich hypothesized that the modern South Asian population was the result of admixture between two genetically divergent ancestral populations dating from the post-Holocene era. These two "reconstructed" ancient populations he termed "Ancestral South Indians" (ASI) and "Ancestral North Indians" (ANI). According to Reich: "ANI ancestry is significantly higher in Indo-European than Dravidian speakers, suggesting that the ancestral ASI may have spoken a Dravidian language before mixing with the ANI." While the ANI is genetically close to Middle Easterners, Central Asians and Europeans, the ASI is not closely related to groups outside of the subcontinent. As no "ASI" ancient DNA is available, the indigenous Andamanese Onge are used as an (imperfect) proxy of ASI, though nevertheless distinct from (according to Reich et al., the Andamanese, though distinct from them, are the closest living population to ASI). According to Reich et al., both ANI and ASI ancestry are found all over the subcontinent (in both northern and southern India) in varying proportions, and that “ANI ancestry ranges from 39-71% in India, and is higher in traditionally upper caste and Indo-European speakers."[61]
Moorjani et al. 2013 state that the ASI, though not closely related to any living group, are "related (distantly) to indigenous Andaman Islanders." Moorjani et al. also suggest possible gene flow into the Andamanese from a population related to the ASI. The study concluded that “almost all groups speaking Indo-European or Dravidian languages lie along a gradient of varying relatedness to West Eurasians in PCA (referred to as “Indian cline”)”.[62]
A 2013 study using the single-nucleotide polymorphism (SNP), shows that the genome of Andamanese people (Onge) is closer to those of other Oceanic Negrito groups than to that of South Asians.[63]
According to Basu et al. 2016, further analysis revealed that the genomic structure of mainland Indian populations is best explained by contributions from four ancestral components. In addition to the ANI and ASI, Basu et. al (2016) identified two ancestral components in mainland India that are major for the Austro-Asiatic-speaking tribals and the Tibeto-Burman speakers, which they denoted as AAA (for “Ancestral Austro-Asiatic”) and ATB (for "Ancestral Tibeto-Burman") respectively. The study also infers that the populations of the Andaman Islands archipelago form a distinct ancestry, which "was found to be coancestral to Oceanic populations".[64]
The cline of admixture between the ANI and ASI lineages is dated to the period of c. 4.2–1.9 kya by Moorjani et al. (2013), corresponding to the Indian Bronze Age, and associated by the authors with the process of deurbanisation of the Indus Valley Civilization and the population shift to the Gangetic system in the incipient Indian Iron Age.[6] Basu et al. (2003) suggests that "Dravidian tribals were possibly widespread throughout India before the arrival of the Indo-European-speaking nomads" and that "formation of populations by fission that resulted in founder and drift effects have left their imprints on the genetic structures of contemporary populations".[37] The geneticist PP Majumder (2010) has recently argued that the findings of Reich et al. (2009) are in remarkable concordance with previous research using mtDNA and Y-DNA:[65]
Central Asian populations are supposed to have been major contributors to the Indian gene pool, particularly to the northern Indian gene pool, and the migrants had supposedly moved into India through what is now Afghanistan and Pakistan. Using mitochondrial DNA variation data collated from various studies, we have shown that populations of Central Asia and Pakistan show the lowest coefficient of genetic differentiation with the north Indian populations, a higher differentiation with the south Indian populations, and the highest with the northeast Indian populations. Northern Indian populations are genetically closer to Central Asians than populations of other geographical regions of India... . Consistent with the above findings, a recent study using over 500,000 biallelic autosomal markers has found a north to south gradient of genetic proximity of Indian populations to western Eurasians. This feature is likely related to the proportions of ancestry derived from the western Eurasian gene pool, which, as this study has shown, is greater in populations inhabiting northern India than those inhabiting southern India.
Lazaridis et al. (2016) notes "The demographic impact of steppe related populations on South Asia was substantial, as the Mala, a south Indian Dalit population with minimal Ancestral North Indian (ANI) along the 'Indian Cline' of such ancestry is inferred to have ~ 18 % steppe-related ancestry, while the Kalash of Pakistan are inferred to have ~ 50 % steppe-related ancestry."[66] Lazaridis et al.'s 2016 study estimated (6.5–50.2 %) steppe related admixture in South Asians. Lazaridis et al. further notes that "A useful direction of future research is a more comprehensive sampling of ancient DNA from steppe populations, as well as populations of central Asia (east of Iran and south of the steppe), which may reveal more proximate sources of the ANI than the ones considered here, and of South Asia to determine the trajectory of population change in the area directly.
Pathak et al. 2018 concluded that the Indo-European speakers of Gangetic Plains and the Dravidian speakers have significant Yamnaya Early-Middle Bronze Age (Steppe_EMBA) ancestry but no Middle-Late Bronze Age Steppe (Steppe_MLBA) ancestry. On the other hand, the "North-Western Indian and Pakistani" populations (PNWI) showed significant Steppe_MLBA ancestry along with Yamnaya (Steppe_EMBA) ancestry. The study also noted that ancient South Asian samples had significantly higher Steppe_MLBA than Steppe_EMBA (or Yamnaya). The study also suggested that the Rors could be used as a proxy for the ANI.[67]
David Reich in his 2018 book Who We Are and How We Got Here states that the 2016 analyses found the ASI to have significant amounts of an ancestry component deriving from Iranian farmers (about 25% of their ancestry), with the remaining 75% of their ancestry deriving from native South Asian hunter-gatherers. He adds that ASI were unlikely the local hunter-gatherers of South Asia as previously established, but a population responsible for spreading agriculture throughout South Asia. In the case of the ANI, the Iranian farmer ancestry is 50%, with the rest being from steppe groups related to the Yamnaya.[68]
Narasimhan et al. (2018), similarly, conclude that ANI and ASI were formed in the 2nd millennium BCE.[69] They were preceded by a mixture of AASI (ancient ancestral south Indian, i.e. hunter-gatherers sharing a common root with the Andamanese); and Iranian agriculturalists who arrived in India ca. 4700–3000 BCE, and "must have reached the Indus Valley by the 4th millennium BCE".[69] According to Narasimhan et al., this mixed population, which probably was native to the Indus Valley Civilisation, "contributed in large proportions to both the ANI and ASI", which took shape during the 2nd millennium BCE. ANI formed out of a mixture of "Indus Periphery-related groups" and migrants from the steppe, while ASI was formed out of "Indus Periphery-related groups" who moved south and mixed further with local hunter-gatherers. The ancestry of the ASI population is suggested to have averaged about 73% from the AASI and 27% from Iranian-related farmers. Narasimhan et al. observe that samples from the Indus periphery group are always mixes of the same two proximal sources of AASI and Iranian agriculturalist-related ancestry; with "one of the Indus Periphery individuals having ~42% AASI ancestry and the other two individuals having ~14-18% AASI ancestry" (with the remainder of their ancestry being from the Iranian agriculturalist-related population).[69]
A genetic study by Yelmen et al. (2019) shows that modern South Asian populations are generally closest to West-Eurasians. They concluded that modern South Asians are basically a mixture of a native South Asian genetic component and a later-arriving West-Eurasian component (derived from both West Asia and the western Steppes). The authors also argue that the native South Asian genetic component is distinct from the Andamanese, and that the Andamanese are thus an imperfect proxy. This component (when represented by the Andamanese Onge) was not detected in the northern Indian Gujarati, and thus it is suggested that the South Indian tribal Paniya people (a group of predominantly ASI ancestry) would serve as a better proxy than the Andamanese (Onge) for the "native South Asian" component in modern South Asians, as the Paniya are directly derived from the natives of South Asia (rather than distantly related to them as the Onge are).[8]
Two genetic studies (Shinde et al. 2019 and Narasimhan et al. 2019,) analysing remains from the Indus Valley civilisation (of parts of Bronze Age Northwest India and East Pakistan), found them to have a mixture of ancestry: Shinde et al. found their samples to have about 50-98% of their genome from peoples related to early Iranian farmers, and from 2-50% of their genome from native South Asian hunter-gatherers sharing a common ancestry with the Andamanese, with the Iranian-related ancestry being on average predominant. The samples analyzed by Narasimhan et al. had 45–82% Iranian farmer-related ancestry and 11–50% AASI (or Andamanese-related hunter-gatherer ancestry). The analysed samples of both studies have little to none of the "Steppe ancestry" component associated with later Indo-European migrations into India. The authors found that the respective amounts of those ancestries varied significantly between individuals, and concluded that more samples are needed to get the full picture of Indian population history.[70][71]
Genetic distance between caste groups and tribes
Studies by Watkins et al. (2005) and Kivisild et al. (2003) based on autosomal markers conclude that Indian caste and tribal populations have a common ancestry.[30][72] Reddy et al. (2005) found fairly uniform allele frequency distributions across caste groups of southern Andhra Pradesh, but significantly larger genetic distance between caste groups and tribes indicating genetic isolation of the tribes and castes.[73]
Viswanathan et al. (2004) in a study on genetic structure and affinities among tribal populations of southern India concludes, "Genetic differentiation was high and genetic distances were not significantly correlated with geographic distances. Genetic drift therefore probably played a significant role in shaping the patterns of genetic variation observed in southern Indian tribal populations. Otherwise, analyses of population relationships showed that all Indian and South Asian populations are still similar to one another, regardless of phenotypic characteristics, and do not show any particular affinities to Africans. We conclude that the phenotypic similarities of some Indian groups to Africans do not reflect a close relationship between these groups, but are better explained by convergence."[74]
A 2011 study published in the American Journal of Human Genetics[5] indicates that Indian ancestral components are the result of a more complex demographic history than was previously thought. According to the researchers, South Asia harbours two major ancestral components, one of which is spread at comparable frequency and genetic diversity in populations of Central Asia, West Asia and Europe; the other component is more restricted to South Asia. However, if one were to rule out the possibility of a large-scale Indo-Aryan migration, these findings suggest that the genetic affinities of both Indian ancestral components are the result of multiple gene flows over the course of thousands of years.[5]
See also
References
- Kivisild T, Kaldma K, Metspalu M, Parik J, Papiha S, Villems R (1999). "The Place of the Indian Mitochondrial DNA Variants in the Global Network of Maternal Lineages and the Peopling of the Old World". Genomic Diversity. pp. 135–152. doi:10.1007/978-1-4615-4263-6_11. ISBN 978-1-4613-6914-1.CS1 maint: ref=harv (link)
- Baig MM, Khan AA, Kulkarni KM (September 2004). "Mitochondrial DNA diversity in tribal and caste groups of Maharashtra (India) and its implication on their genetic origins". Annals of Human Genetics. 68 (Pt 5): 453–60. doi:10.1046/j.1529-8817.2004.00108.x. PMID 15469422.
- Singh AK (2007). Science & Technology For Upsc. Tata McGraw-Hill Education. p. 595. ISBN 978-0-07-065548-5. Archived from the original on 3 January 2014. Retrieved 24 May 2016.
- Tripathy, Vikal; Nirmala, A.; Reddy, B. Mohan (4 September 2017). "Trends in Molecular Anthropological Studies in India". International Journal of Human Genetics. 8 (1–2): 1–20. doi:10.1080/09723757.2008.11886015.
- Metspalu M, Romero IG, Yunusbayev B, Chaubey G, Mallick CB, Hudjashov G, et al. (December 2011). "Shared and unique components of human population structure and genome-wide signals of positive selection in South Asia". American Journal of Human Genetics. 89 (6): 731–44. doi:10.1016/j.ajhg.2011.11.010. PMC 3234374. PMID 22152676.
- Moorjani P, Thangaraj K, Patterson N, Lipson M, Loh PR, Govindaraj P, et al. (September 2013). "Genetic evidence for recent population mixture in India". American Journal of Human Genetics. 93 (3): 422–38. doi:10.1016/j.ajhg.2013.07.006. PMC 3769933. PMID 23932107.
- Silva M, Oliveira M, Vieira D, Brandão A, Rito T, Pereira JB, et al. (March 2017). "A genetic chronology for the Indian Subcontinent points to heavily sex-biased dispersals". BMC Evolutionary Biology. 17 (1): 88. doi:10.1186/s12862-017-0936-9. PMC 5364613. PMID 28335724.
- Yelmen, Burak; Mondal, Mayukh; Marnetto, Davide; Pathak, Ajai K.; Montinaro, Francesco; Gallego Romero, Irene; Kivisild, Toomas; Metspalu, Mait; Pagani, Luca (1 August 2019). "Ancestry-Specific Analyses Reveal Differential Demographic Histories and Opposite Selective Pressures in Modern South Asian Populations". Molecular Biology and Evolution. 36 (8): 1628–1642. doi:10.1093/molbev/msz037. ISSN 0737-4038. PMC 6657728. PMID 30952160.
- Kivisild T, Papiha SS, Rootsi S, Parik J, Kaldma K, Reidla M, et al. (2000), An Indian Ancestry: a Key for Understanding Human Diversity in Europe and Beyond (PDF), McDonald Institute Monographs, archived (PDF) from the original on 19 February 2006, retrieved 11 November 2005
- "Y Haplogroups of the World, 2005, McDonald" (PDF). Archived from the original (PDF) on 28 July 2004. Retrieved 24 October 2006.
- Sengupta S, Zhivotovsky LA, King R, Mehdi SQ, Edmonds CA, Chow CE, et al. (February 2006). "Polarity and temporality of high-resolution y-chromosome distributions in India identify both indigenous and exogenous expansions and reveal minor genetic influence of Central Asian pastoralists". American Journal of Human Genetics. 78 (2): 202–21. doi:10.1086/499411. PMC 1380230. PMID 16400607.
- Sahoo S, Singh A, Himabindu G, Banerjee J, Sitalaximi T, Gaikwad S, et al. (January 2006). "A prehistory of Indian Y chromosomes: evaluating demic diffusion scenarios". Proceedings of the National Academy of Sciences of the United States of America. 103 (4): 843–8. Bibcode:2006PNAS..103..843S. doi:10.1073/pnas.0507714103. PMC 1347984. PMID 16415161.
- Thanseem I, Thangaraj K, Chaubey G, Singh VK, Bhaskar LV, Reddy BM, et al. (August 2006). "Genetic affinities among the lower castes and tribal groups of India: inference from Y chromosome and mitochondrial DNA". BMC Genetics. 7: 42. doi:10.1186/1471-2156-7-42. PMC 1569435. PMID 16893451.
- Zhao Z, Khan F, Borkar M, Herrera R, Agrawal S (2009). "Presence of three different paternal lineages among North Indians: a study of 560 Y chromosomes". Annals of Human Biology. 36 (1): 46–59. doi:10.1080/03014460802558522. PMC 2755252. PMID 19058044.
- Endicott, Metspalu & Kivisild 2007, p. 231.
- Endicott, Metspalu & Kivisild 2007, pp. 234–235.
- Das, Ranajit; Upadhyai, Priyanka (25 November 2016). "Tracing the biogeographical origin of South Asian populations using DNA SatNav". bioRxiv: 089466. doi:10.1101/089466.
Our hypothesis is supported by archaeological, linguistic and genetic evidences that suggest that there were two prominent waves of immigrations to India. A majority of the Early Caucasoids were proto-Dravidian language speakers that migrated to India putatively ~ 6000 YBP.
- Oppenheimer 2003
- Puente XS, Velasco G, Gutiérrez-Fernández A, Bertranpetit J, King MC, López-Otín C (January 2006). "Comparative analysis of cancer genes in the human and chimpanzee genomes". BMC Genomics. 7: 15. doi:10.1186/1471-2164-7-15. PMC 1382208. PMID 16438707.
- Metspalu M, Kivisild T, Metspalu E, Parik J, Hudjashov G, Kaldma K, et al. (August 2004). "Most of the extant mtDNA boundaries in south and southwest Asia were likely shaped during the initial settlement of Eurasia by anatomically modern humans". BMC Genetics. 5: 26. doi:10.1186/1471-2156-5-26. PMC 516768. PMID 15339343.
- Kivisild, T.; Bamshad, M.J.; Kaldma, K.; Metspalu, M.; Metspalu, E.; Reidla, M.; Laos, S.; Parik, J.; Watkins, W.S.; Dixon, M.E.; Papiha, S.S.; Mastana, S.S.; Mir, M.R.; Ferak, V.; Villems, R. (November 1999). "Deep common ancestry of Indian and western-Eurasian mitochondrial DNA lineages". Current Biology. 9 (22): 1331–1334. doi:10.1016/s0960-9822(00)80057-3. PMID 10574762.
- "Y-DNA Haplogroup H and its Subclades – 2015". Archived from the original on 1 November 2015. Retrieved 11 October 2015.
- Cordaux R, Aunger R, Bentley G, Nasidze I, Sirajuddin SM, Stoneking M (February 2004). "Independent origins of Indian caste and tribal paternal lineages". Current Biology. 14 (3): 231–5. doi:10.1016/j.cub.2004.01.024. PMID 14761656.
- Thangaraj K, Naidu BP, Crivellaro F, Tamang R, Upadhyay S, Sharma VK, et al. (December 2010). Cordaux R (ed.). "The influence of natural barriers in shaping the genetic structure of Maharashtra populations". PLOS ONE. 5 (12): e15283. Bibcode:2010PLoSO...515283T. doi:10.1371/journal.pone.0015283. PMC 3004917. PMID 21187967.
- Singh, Mugdha; Sarkar, Anujit; Nandineni, Madhusudan R. (18 October 2018). "A comprehensive portrait of Y-STR diversity of Indian populations and comparison with 129 worldwide populations". Scientific Reports. 8 (1): 15421. Bibcode:2018NatSR...815421S. doi:10.1038/s41598-018-33714-2. PMC 6194109. PMID 30337554.
- Arunkumar G, Soria-Hernanz DF, Kavitha VJ, Arun VS, Syama A, Ashokan KS, et al. (2012). "Population differentiation of southern Indian male lineages correlates with agricultural expansions predating the caste system". PLOS ONE. 7 (11): e50269. Bibcode:2012PLoSO...750269A. doi:10.1371/journal.pone.0050269. PMC 3508930. PMID 23209694.
- Sharma S, Rai E, Sharma P, Jena M, Singh S, Darvishi K, et al. (January 2009). "The Indian origin of paternal haplogroup R1a1* substantiates the autochthonous origin of Brahmins and the caste system". Journal of Human Genetics. 54 (1): 47–55. doi:10.1038/jhg.2008.2. PMID 19158816.
- Qamar R, Ayub Q, Mohyuddin A, Helgason A, Mazhar K, Mansoor A, et al. (May 2002). "Y-chromosomal DNA variation in Pakistan". American Journal of Human Genetics. 70 (5): 1107–24. doi:10.1086/339929. PMC 447589. PMID 11898125.
- Shah AM, Tamang R, Moorjani P, Rani DS, Govindaraj P, Kulkarni G, et al. (July 2011). "Indian Siddis: African descendants with Indian admixture". American Journal of Human Genetics. 89 (1): 154–61. doi:10.1016/j.ajhg.2011.05.030. PMC 3135801. PMID 21741027.
- Kivisild (2003)
- Wells, Spencer (2007). Deep ancestry : inside the Genographic project. Washington, D.C.: National Geographic. ISBN 978-1426201189.
- Mahal DG, Matsoukas IG (20 September 2017). "Y-STR Haplogroup Diversity in the Jat Population Reveals Several Different Ancient Origins". Frontiers in Genetics. 8: 121. doi:10.3389/fgene.2017.00121. PMC 5611447. PMID 28979290.
- Spencer Wells (2003), The Journey of Man. A Genetic Odyssey. New Delhi: Penguin Books India, p. 167
- Zhao Z, Khan F, Borkar M, Herrera R, Agrawal S (2009). "Presence of three different paternal lineages among North Indians: a study of 560 Y chromosomes". Annals of Human Biology. 36 (1): 46–59. doi:10.1080/03014460802558522. PMC 2755252. PMID 19058044.
- McElreavey K, Quintana-Murci L (2005). "A population genetics perspective of the Indus Valley through uniparentally-inherited markers". Annals of Human Biology. 32 (2): 154–62. doi:10.1080/03014460500076223. PMID 16096211.
- Thangaraj K, Naidu BP, Crivellaro F, Tamang R, Upadhyay S, Sharma VK, et al. (December 2010). "The influence of natural barriers in shaping the genetic structure of Maharashtra populations". PLOS ONE. 5 (12): e15283. Bibcode:2010PLoSO...515283T. doi:10.1371/journal.pone.0015283. PMC 3004917. PMID 21187967.
- Basu A, Mukherjee N, Roy S, Sengupta S, Banerjee S, Chakraborty M, et al. (October 2003). "Ethnic India: a genomic view, with special reference to peopling and structure". Genome Research. 13 (10): 2277–90. doi:10.1101/gr.1413403. PMC 403703. PMID 14525929.CS1 maint: ref=harv (link)
- Firasat S, Khaliq S, Mohyuddin A, Papaioannou M, Tyler-Smith C, Underhill PA, Ayub Q (January 2007). "Y-chromosomal evidence for a limited Greek contribution to the Pathan population of Pakistan". European Journal of Human Genetics. 15 (1): 121–6. doi:10.1038/sj.ejhg.5201726. PMC 2588664. PMID 17047675.CS1 maint: ref=harv (link)
- Qamar 2002.
- Mcelreavey 2005.
- Kivisild T, Rootsi S, Metspalu M, Metspalu E, Parik J, Kaldma K, Usanga E, Mastana S, Papiha SS, Villems R (2003). "The Genetics of Language and Farming Spread in India" (PDF). In Bellwood P, Renfrew C (ed.). Examining the farming/language dispersal hypothesis. McDonald Institute for Archaeological Research, Cambridge, United Kingdom. pp. 215–222.
- Sengupta et al. (2005)
- Underhill PA, Myres NM, Rootsi S, Metspalu M, Zhivotovsky LA, King RJ, et al. (April 2010). "Separating the post-Glacial coancestry of European and Asian Y chromosomes within haplogroup R1a". European Journal of Human Genetics. 18 (4): 479–84. doi:10.1038/ejhg.2009.194. PMC 2987245. PMID 19888303.CS1 maint: ref=harv (link)
- Mirabal S, Regueiro M, Cadenas AM, Cavalli-Sforza LL, Underhill PA, Verbenko DA, et al. (October 2009). "Y-chromosome distribution within the geo-linguistic landscape of northwestern Russia". European Journal of Human Genetics. 17 (10): 1260–73. doi:10.1038/ejhg.2009.6. PMC 2986641. PMID 19259129.
- Underhill 2014.
- Pamjav 2012.
- ArunkumarG 2012.
- Fornarino et al. (2009)
- Manoukian, Jean-Grégoire (2006), "A Synthesis of Haplogroup R2 – 2006 Archived 1 October 2015 at the Wayback Machine."
- Mondal, Mayukh; Bergström, Anders; Xue, Yali; Calafell, Francesc; Laayouni, Hafid; Casals, Ferran; Majumder, Partha P.; Tyler-Smith, Chris; Bertranpetit, Jaume (1 May 2017). "Y-chromosomal sequences of diverse Indian populations and the ancestry of the Andamanese". Human Genetics. 136 (5): 499–510. doi:10.1007/s00439-017-1800-0. hdl:10230/34399. ISSN 1432-1203. PMID 28444560.
- Kumar V, Reddy AN, Babu JP, Rao TN, Langstieh BT, Thangaraj K, et al. (March 2007). "Y-chromosome evidence suggests a common paternal heritage of Austro-Asiatic populations". BMC Evolutionary Biology. 7: 47. doi:10.1186/1471-2148-7-47. PMC 1851701. PMID 17389048.
- Eaaswarkhanth M, Haque I, Ravesh Z, Romero IG, Meganathan PR, Dubey B, et al. (March 2010). "Traces of sub-Saharan and Middle Eastern lineages in Indian Muslim populations". European Journal of Human Genetics. 18 (3): 354–63. doi:10.1038/ejhg.2009.168. PMC 2859343. PMID 19809480.
- "The Place of the Indian mtDNA Variants in the Global Network of Maternal Lineages and the Peopling of the Old World" (PDF). Archived (PDF) from the original on 8 March 2012. Retrieved 28 September 2011.
- "Ethnologue report for Indo-European". Ethnologue.com. Archived from the original on 15 October 2012. Retrieved 24 November 2015.
- Baldi P (1990). Linguistic Change and Reconstruction Methodology. Walter de Gruyter. p. 342. ISBN 978-3-11-011908-4.
- Burling (2003), pp. 174–178.
- Bradley (2012) notes, MK in the wider sense including the Munda languages of eastern South Asia is also known as Austroasiatic.Languages and Language Families in China Archived 30 April 2017 at the Wayback Machine
- Bamshad M, Kivisild T, Watkins WS, Dixon ME, Ricker CE, Rao BB, et al. (June 2001). "Genetic evidence on the origins of Indian caste populations". Genome Research. 11 (6): 994–1004. doi:10.1101/gr.GR-1733RR. PMC 311057. PMID 11381027.
- Mukherjee N, Nebel A, Oppenheim A, Majumder PP (December 2001). "High-resolution analysis of Y-chromosomal polymorphisms reveals signatures of population movements from Central Asia and West Asia into India". Journal of Genetics. 80 (3): 125–35. doi:10.1007/BF02717908. PMID 11988631.
- Mondal, Mayukh; Bergström, Anders; Xue, Yali; Calafell, Francesc; Laayouni, Hafid; Casals, Ferran; Majumder, Partha P.; Tyler-Smith, Chris; Bertranpetit, Jaume (25 April 2017). "Y-chromosomal sequences of diverse Indian populations and the ancestry of the Andamanese". Human Genetics. 136 (5): 499–510. doi:10.1007/s00439-017-1800-0. hdl:10230/34399. PMID 28444560.
- Reich D, Thangaraj K, Patterson N, Price AL, Singh L (September 2009). "Reconstructing Indian population history". Nature. 461 (7263): 489–94. Bibcode:2009Natur.461..489R. doi:10.1038/nature08365. PMC 2842210. PMID 19779445.
- Moorjani P, Thangaraj K, Patterson N, Lipson M, Loh PR, Govindaraj P, et al. (September 2013). "Genetic evidence for recent population mixture in India". American Journal of Human Genetics. 93 (3): 422–38. doi:10.1016/j.ajhg.2013.07.006. PMC 3769933. PMID 23932107.
- Chaubey, Gyaneshwer; Endicott, Phillip (June 2013). "The Andaman Islanders in a Regional Genetic Context: Reexamining the Evidence for an Early Peopling of the Archipelago from South Asia". Human Biology. 85 (1–3): 153–172. doi:10.3378/027.085.0307. PMID 24297224.
- Basu A, Sarkar-Roy N, Majumder PP (February 2016). "Genomic reconstruction of the history of extant populations of India reveals five distinct ancestral components and a complex structure". Proceedings of the National Academy of Sciences of the United States of America. 113 (6): 1594–9. Bibcode:2016PNAS..113.1594B. doi:10.1073/pnas.1513197113. PMC 4760789. PMID 26811443.
- Majumder PP (February 2010). "The human genetic history of South Asia". Current Biology. 20 (4): R184-7. doi:10.1016/j.cub.2009.11.053. PMID 20178765.
- Citation error. See inline comment how to fix.
- Pathak, Ajai K.; Kadian, Anurag; Kushniarevich, Alena; Montinaro, Francesco; Mondal, Mayukh; Ongaro, Linda; Singh, Manvendra; Kumar, Pramod; Rai, Niraj; Parik, Jüri; Metspalu, Ene; Rootsi, Siiri; Pagani, Luca; Kivisild, Toomas; Metspalu, Mait; Chaubey, Gyaneshwer; Villems, Richard (December 2018). "The Genetic Ancestry of Modern Indus Valley Populations from Northwest India". The American Journal of Human Genetics. 103 (6): 918–929. doi:10.1016/j.ajhg.2018.10.022. PMC 6288199. PMID 30526867.
- Reich, David (2018). Who We Are and How We Got Here: Ancient DNA and the new science of the human past. OUP Oxford. ISBN 978-0-19-257040-6. Retrieved 2 March 2020.
- Narasimhan et al. 2018, p. 15.
- Shinde V, Narasimhan VM, Rohland N, Mallick S, Mah M, Lipson M, Nakatsuka N, Adamski N, Broomandkhoshbacht N, Ferry M, Lawson AM, Michel M, Oppenheimer J, Stewardson K, Jadhav N, Kim YJ, Chatterjee M, Munshi A, Panyam A, Waghmare P, Yadav Y, Patel H, Kaushik A, Thangaraj K, Meyer M, Patterson N, Rai N, Reich D (September 2019). "An Ancient Harappan Genome Lacks Ancestry from Steppe Pastoralists or Iranian Farmers". Cell. 179 (3): 729–735.e10. doi:10.1016/j.cell.2019.08.048. PMC 6800651. PMID 31495572.
- Narasimhan VM, Patterson N, Moorjani P, Rohland N, Bernardos R, Mallick S, et al. (September 2019). "The formation of human populations in South and Central Asia". Science. 365 (6457): eaat7487. doi:10.1126/science.aat7487. PMC 6822619. PMID 31488661.
- Watkins WS, Prasad BV, Naidu JM, Rao BB, Bhanu BA, Ramachandran B, et al. (November 2005). "Diversity and divergence among the tribal populations of India". Annals of Human Genetics. 69 (Pt 6): 680–92. doi:10.1046/j.1529-8817.2005.00200.x. PMID 16266407.
- Reddy BM, Naidu VM, Madhavi VK, Thangaraj LK, Kumar V, Langstieh BT, et al. (December 2005). "Microsatellite diversity in Andhra Pradesh, India: genetic stratification versus social stratification". Human Biology. 77 (6): 803–23. doi:10.1353/hub.2006.0018. PMID 16715839.
- Vishwanathan H, Deepa E, Cordaux R, Stoneking M, Usha Rani MV, Majumder PP (March 2004). "Genetic structure and affinities among tribal populations of southern India: a study of 24 autosomal DNA markers". Annals of Human Genetics. 68 (Pt 2): 128–38. doi:10.1046/j.1529-8817.2003.00083.x. PMID 15008792. S2CID 24230856.
Further reading
- Allikas A, Ord D, Kurg R, Kivi S, Ustav M (June 2001). "Roles of the hinge region and the DNA binding domain of the bovine papillomavirus type 1 E2 protein in initiation of DNA replication". Virus Research. 75 (2): 95–106. doi:10.1016/S0168-1702(01)00219-2. PMID 11325464.CS1 maint: ref=harv (link)
- Behar DM, Garrigan D, Kaplan ME, Mobasher Z, Rosengarten D, Karafet TM, et al. (March 2004). "Contrasting patterns of Y chromosome variation in Ashkenazi Jewish and host non-Jewish European populations". Human Genetics. 114 (4): 354–65. doi:10.1007/s00439-003-1073-7. PMID 14740294.
- Bhattacharyya NP, Basu P, Das M, Pramanik S, Banerjee R, Roy B, et al. (August 1999). "Negligible male gene flow across ethnic boundaries in India, revealed by analysis of Y-chromosomal DNA polymorphisms". Genome Research. 9 (8): 711–9. doi:10.1101/gr.9.8.711 (inactive 7 June 2020). PMID 10447506.
- Cann RL (March 2001). "Genetic clues to dispersal in human populations: retracing the past from the present". Science. 291 (5509): 1742–8. Bibcode:2001Sci...291.1742C. doi:10.1126/science.1058948. PMID 11249820. S2CID 19367408.CS1 maint: ref=harv (link)
- Cinnioğlu C, King R, Kivisild T, Kalfoğlu E, Atasoy S, Cavalleri GL, et al. (January 2004). "Excavating Y-chromosome haplotype strata in Anatolia". Human Genetics. 114 (2): 127–48. doi:10.1007/s00439-003-1031-4. PMID 14586639.
- Das B, Chauhan PS, Seshadri M (October 2004). "Minimal sharing of Y-chromosome STR haplotypes among five endogamous population groups from western and southwestern India". Human Biology. 76 (5): 743–63. doi:10.1353/hub.2005.0003. PMID 15757245.
- Hemphill BE, Christensen AF (3 November 1994). The Oxus Civilization as a Link between East and West: A Non-Metric Analysis of Bronze Age Bactrain Biological Affinities. Madison, Wisconsin. p. 13.CS1 maint: ref=harv (link) (paper read at the South Asia Conference)
- Jobling MA, Tyler-Smith C (August 2003). "The human Y chromosome: an evolutionary marker comes of age". Nature Reviews. Genetics. 4 (8): 598–612. doi:10.1038/nrg1124. PMID 12897772.
- Kivisild T, Rootsi S, Metspalu M, Mastana S, Kaldma K, Parik J, et al. (February 2003). "The genetic heritage of the earliest settlers persists both in Indian tribal and caste populations". American Journal of Human Genetics. 72 (2): 313–32. doi:10.1086/346068. PMC 379225. PMID 12536373.CS1 maint: ref=harv (link)
- Metspalu M, Kivisild T, Metspalu E, Parik J, Hudjashov G, Kaldma K, et al. (August 2004). "Most of the extant mtDNA boundaries in south and southwest Asia were likely shaped during the initial settlement of Eurasia by anatomically modern humans". BMC Genetics. 5: 26. doi:10.1186/1471-2156-5-26. PMC 516768. PMID 15339343.
- Patowary A, Purkanti R, Singh M, Chauhan RK, Bhartiya D, Dwivedi OP, et al. (July 2012). "Systematic analysis and functional annotation of variations in the genome of an Indian individual". Human Mutation. 33 (7): 1133–40. doi:10.1002/humu.22091. PMID 22461382. S2CID 11466942.
- Rootsi S, Magri C, Kivisild T, Benuzzi G, Help H, Bermisheva M, et al. (July 2004). "Phylogeography of Y-chromosome haplogroup I reveals distinct domains of prehistoric gene flow in europe". American Journal of Human Genetics. 75 (1): 128–37. doi:10.1086/422196. PMC 1181996. PMID 15162323.
- Qamar R, Ayub Q, Mohyuddin A, Helgason A, Mazhar K, Mansoor A, et al. (May 2002). "Y-chromosomal DNA variation in Pakistan". American Journal of Human Genetics. 70 (5): 1107–24. doi:10.1086/339929. PMC 447589. PMID 11898125.
- Semino O, Magri C, Benuzzi G, Lin AA, Al-Zahery N, Battaglia V, et al. (May 2004). "Origin, diffusion, and differentiation of Y-chromosome haplogroups E and J: inferences on the neolithization of Europe and later migratory events in the Mediterranean area". American Journal of Human Genetics. 74 (5): 1023–34. doi:10.1086/386295. PMC 1181965. PMID 15069642.
Sources
- Indian Genome Variation Consortium (April 2008). "Genetic landscape of the people of India: a canvas for disease gene exploration". Journal of Genetics. 87 (1): 3–20. doi:10.1007/s12041-008-0002-x. PMID 18560169.
- Endicott P, Metspalu M, Kivisild T (2007). "Genetic evidence on modern human dispersals in South Asia: Y chromose and mitochondrial DNA perspectives". In Michael D. Petraglia, Bridget Allchin (eds.). The Evolution and History of Human Populations in South Asia. Springer. pp. 201–228. ISBN 978-1-4020-5561-4.
- Hemphill B, Lukacs J, Kennedy K (1991). "Biological Adaptations and Affinities of Bronze Age Harappans". In Meadow RH (ed.). Harappa excavations 1986–1990: a multidisciplinary approach to third millennium urbanism. pp. 137–82. ISBN 978-0-9629110-1-9.CS1 maint: ref=harv (link)
- Kennedy KA (1984). "A Reassessment of the Theories of Racial Origins of the People of the Indus Valley Civilization from Recent Anthropological Data". In Kennedy KA, Possehl GL (eds.). Studies in the Archaeology and Palaeoanthropology of South Asia. Atlantic Highlands, NJ: Humanities Press. pp. 99–107.CS1 maint: ref=harv (link)
- Kennedy KA (1995). "Have Aryans been identified in the prehistoric skeletal record from South Asia?". In George Erdosy (ed.). The Indo-Aryans of Ancient South Asia. Walter de Gruyter. pp. 49–54. ISBN 978-3-11-014447-5.
- Kivisild T (2000b). The origins of southern and western Eurasian populations: an mtDNA study (PDF). Tartu University, Estonia.CS1 maint: ref=harv (link) (PhD)
- Mascarenhas DD, Raina A, Aston CE, Sanghera DK (2015). "Genetic and Cultural Reconstruction of the Migration of an Ancient Lineage". BioMed Research International. 2015: 651415. doi:10.1155/2015/651415. PMC 4605215. PMID 26491681.
- Narasimhan VM, Anthony D, Mallory J, Reich D (2018). "The Genomic Formation of South and Central Asia". bioRxiv 10.1101/292581. doi:10.1101/292581. Cite journal requires
|journal=(help) - Oppenheimer S (2003). The Real Eve: Modern Man's Journey out of Africa. New York: Carroll and Graf Publishers. ISBN 978-0-7867-1192-5.CS1 maint: ref=harv (link)
- Pamjav (December 2012), "Brief communication: New Y-chromosome binary markers improve phylogenetic resolution within haplogroup R1a1", American Journal of Physical Anthropology, 149 (4): 611–615, doi:10.1002/ajpa.22167, PMID 23115110, S2CID 4820868
- Renfrew C, Boyle K, eds. (2000a). An Indian Ancestry: a Key for Understanding Human Diversity in Europe and Beyond (PDF). ISBN 978-1-902937-08-3.CS1 maint: ref=harv (link)
- Underhill PA (2003). "Inferring human history: clues from Y-chromosome haplotypes". Cold Spring Harbor Symposia on Quantitative Biology. 68: 487–93. doi:10.1101/sqb.2003.68.487. PMID 15338652. S2CID 15527457.
- Underhill PA, Poznik GD, Rootsi S, Järve M, Lin AA, Wang J, et al. (January 2015). "The phylogenetic and geographic structure of Y-chromosome haplogroup R1a". European Journal of Human Genetics. 23 (1): 124–31. doi:10.1038/ejhg.2014.50. PMC 4266736. PMID 24667786.
- Wells S (2003). The Journey of Man: A Genetic Odyssey. Princeton University Press.
External links
| Wikiquote has quotations related to: Genetics and archaeogenetics of South Asia |
- Introduction to Haplogroups and Haplotypes, Mark A. Jobling, University of Leicester.
- Journey of Man: Peopling of the World, Bradshaw Foundation, in association with Stephen Oppenheimer.
- Indian Genome Variation Database Institute of Genomics and Integrative Biology
- List of R2 frequency
- Maldives
| Sub-topics | |
|---|---|
| Genetic history by region |
|
| Population genetics by group | |
| |