Gaspésie—Les Îles-de-la-Madeleine
Gaspésie—Les Îles-de-la-Madeleine (French pronunciation: [gaspezi il də la madlɛn]) is a federal electoral district in Quebec, Canada, that has been represented in the House of Commons of Canada since 2004.
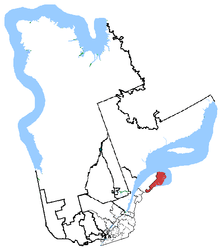 Gaspésie—Îles-de-la-Madeleine in relation to other Quebec federal electoral districts | |||
| Federal electoral district | |||
| Legislature | House of Commons | ||
| MP |
Liberal | ||
| District created | 2003 | ||
| First contested | 2004 | ||
| Last contested | 2019 | ||
| District webpage | profile, map | ||
| Demographics | |||
| Population (2011)[1] | 78,833 | ||
| Electors (2015) | 65,717 | ||
| Area (km²)[2] | 17,145 | ||
| Pop. density (per km²) | 4.6 | ||
| Census divisions | Bonaventure RCM, La Côte-de-Gaspé RCM, Les Îles-de-la-Madeleine, Rocher-Percé RCM | ||
| Census subdivisions | Bonaventure, Cap-Chat, Chandler, Gaspé, Grande-Rivière, Maria, New Richmond, Nouvelle, Paspébiac, Percé, Sainte-Anne-des-Monts | ||
It was created by the Representation Order of 2003 from parts of Bonaventure—Gaspé—Îles-de-la-Madeleine—Pabok and Matapédia—Matane ridings.
As per the 2012 federal electoral redistribution, the former riding of Gaspésie—Îles-de-la-Madeleine was dissolved, largely being replaced by Gaspésie—Les Îles-de-la-Madeleine, and the rest going to Avignon—La Mitis—Matane—Matapédia, while gaining territory from Haute-Gaspésie—La Mitis—Matane—Matapédia.
Geography
The riding occupies the eastern part of the Gaspé Peninsula, as well as the Magdalen Islands. The Magdalen Islands, being in the Atlantic time zone, report election results one hour earlier than the rest of the riding, which in the Eastern Time Zone with the rest of Quebec.
From 2004 to 2011 it consisted of:
(a) the regional county municipalities of Bonaventure, La Côte-de-Gaspé and Le Rocher-Percé; (b) the Regional County Municipality of Avignon, including Gesgapegiag and Listuguj Indian reserves; and (c) the Municipality of Les Îles-de-la-Madeleine.
Following the 2013 redistribution, the riding lost the RCM of Avignon but gained the RCM of La Haute-Gaspésie.
Demographics
- According to the Canada 2016 Census
- Languages: (2016) 91.5% French, 8.1% English, 0.1% Spanish[3]
Member of Parliament
This riding has elected the following Member of Parliament:
| Parliament | Years | Member | Party | |
|---|---|---|---|---|
| Gaspésie—Îles-de-la-Madeleine Riding created from Bonaventure—Gaspé—Îles-de-la-Madeleine—Pabok and Matapédia—Matane |
||||
| 38th | 2004–2006 | Raynald Blais | Bloc Québécois | |
| 39th | 2006–2008 | |||
| 40th | 2008–2011 | |||
| 41st | 2011–2015 | Philip Toone | New Democratic | |
| Gaspésie—Les Îles-de-la-Madeleine | ||||
| 42nd | 2015–2019 | Diane Lebouthillier | Liberal | |
| 43rd | 2019–present | |||
Election results
Gaspésie—Les Îles-de-la-Madeleine, 2013 Representation Order
| 2019 Canadian federal election | ||||||||
|---|---|---|---|---|---|---|---|---|
| Party | Candidate | Votes | % | ±% | Expenditures | |||
| Liberal | Diane Lebouthillier | 16,296 | 42.5 | +3.8 | ||||
| Bloc Québécois | Guy Bernatchez | 15,659 | 40.8 | +19.9 | ||||
| Conservative | Jean-Pierre Pigeon | 3,022 | 7.9 | +1.8 | ||||
| New Democratic | Lynn Beaulieu | 1,722 | 4.5 | -28.0 | ||||
| Green | Dennis Drainville | 1,130 | 2.9 | +1.9 | ||||
| Rhinoceros | Jay Cowboy | 353 | 0.9 | +0.1 | ||||
| People's | Eric Hébert | 198 | 0.5 | |||||
| Total valid votes/Expense limit | 38,380 | 100.0 | ||||||
| Total rejected ballots | 783 | |||||||
| Turnout | 39,163 | 60.5 | ||||||
| Eligible voters | 64,748 | |||||||
| Liberal hold | Swing | -8.05 | ||||||
| Source: Elections Canada[4][5] and CBC[6] | ||||||||
| 2015 Canadian federal election | ||||||||
|---|---|---|---|---|---|---|---|---|
| Party | Candidate | Votes | % | ±% | Expenditures | |||
| Liberal | Diane Lebouthillier | 15,345 | 38.73 | +21.69 | $34,217.07 | |||
| New Democratic | Philip Toone | 12,885 | 32.52 | +3.69 | $45,644.59 | |||
| Bloc Québécois | Nicholas Roussy | 8,289 | 20.92 | -12.15 | $51,177.09 | |||
| Conservative | Jean-Pierre Pigeon | 2,398 | 6.05 | -13.02 | $9,215.28 | |||
| Green | Jim Morrison | 400 | 1.01 | -0.98 | – | |||
| Rhinoceros | Max Boudreau | 300 | 0.76 | – | – | |||
| Total valid votes/Expense limit | 39,617 | 100.0 | $215,809.52 | |||||
| Total rejected ballots | 395 | – | – | |||||
| Turnout | 40,012 | 60.97 | – | |||||
| Eligible voters | 65,623 | |||||||
| Source: Elections Canada[7][8] | ||||||||
| 2011 federal election redistributed results[9] | |||
|---|---|---|---|
| Party | Vote | % | |
| Bloc Québécois | 11,684 | 33.07 | |
| New Democratic | 10,186 | 28.83 | |
| Conservative | 6,739 | 19.07 | |
| Liberal | 6,020 | 17.04 | |
| Green | 702 | 1.99 | |
Gaspésie—Îles-de-la-Madeleine, 2003 Representation Order
| 2011 Canadian federal election: Gaspésie—Îles-de-la-Madeleine | ||||||||
|---|---|---|---|---|---|---|---|---|
| Party | Candidate | Votes | % | ±% | Expenditures | |||
| New Democratic | Philip Toone | 12,427 | 33.76 | +26.78 | none listed | |||
| Bloc Québécois | Daniel Côté | 11,650 | 31.64 | −8.46 | $39,768.78 | |||
| Conservative | Régent Bastien | 6,292 | 17.09 | −5.75 | $48,704.71 | |||
| Liberal | Jules Duguay | 5,533 | 15.03 | −11.93 | none listed | |||
| Green | Julien Leblanc | 913 | 2.48 | −0.63 | $328.10 | |||
| Total valid votes/Expense limit | 36,815 | 100.0 | $90,208.08 | |||||
| Total rejected, unmarked and declined ballots | 571 | 1.53 | +0.33 | |||||
| Turnout | 37,386 | 53.85 | −0.26 | |||||
| Eligible voters | 69,429 | |||||||
| New Democratic gain from Bloc Québécois | Swing | +17.62 | ||||||
| Sources:[10][11] | ||||||||
| 2008 Canadian federal election | ||||||||
|---|---|---|---|---|---|---|---|---|
| Party | Candidate | Votes | % | ±% | Expenditures | |||
| Bloc Québécois | Raynald Blais | 14,636 | 40.10 | -2.59 | $35,057.79 | |||
| Liberal | Denis Gauvreau | 9,840 | 26.96 | +7.70 | $75,736.95 | |||
| Conservative | Darryl Gray | 8,334 | 22.84 | -9.39 | $61,592.38 | |||
| New Democratic | Gaston Langlais | 2,549 | 6.98 | +4.02 | $1,775.37 | |||
| Green | Julien Leblanc | 1,136 | 3.11 | +0.25 | $157.00 | |||
| Total valid votes/Expense limit | 36,495 | 100.0 | $86,955 | |||||
| Total rejected, unmarked and declined ballots | 445 | 1.20 | +0.07 | |||||
| Turnout | 36,940 | 54.11 | -7.04 | |||||
| Eligible voters | 68,270 | |||||||
| Bloc Québécois hold | Swing | -5.14 | ||||||
| 2006 Canadian federal election | ||||||||
|---|---|---|---|---|---|---|---|---|
| Party | Candidate | Votes | % | ±% | Expenditures | |||
| Bloc Québécois | Raynald Blais | 17,678 | 42.69 | -12.98 | $39,804.88 | |||
| Conservative | Gaston Langlais | 13,347 | 32.23 | +25.39 | $16,170.29 | |||
| Liberal | Mario Levesque | 7,977 | 19.26 | -13.39 | $27,785.44 | |||
| New Democratic | Sophie Dauphinais | 1,225 | 2.96 | +0.87 | $1,237.16 | |||
| Green | Bob Eichenberger | 1,183 | 2.86 | +0.11 | $325.71 | |||
| Total valid votes/Expense limit | 41,410 | 100.0 | $80,993 | |||||
| Total rejected, unmarked and declined ballots | 474 | 1.13 | -0.30 | |||||
| Turnout | 41,884 | 61.15 | +4.58 | |||||
| Eligible voters | 68,494 | |||||||
| Bloc Québécois hold | Swing | -19.18 | ||||||
| 2004 Canadian federal election: Gaspésie—Îles-de-la-Madeleine | ||||||||
|---|---|---|---|---|---|---|---|---|
| Party | Candidate | Votes | % | ±% | Expenditures | |||
| Bloc Québécois | Raynald Blais | 21,446 | 55.67 | +13.10 | $44,886.71 | |||
| Liberal | Georges Farrah | 12,579 | 32.65 | −20.15 | $44,503.86 | |||
| Conservative | Guy De Coste | 2,636 | 6.84 | +4.17 | $12,110.72 | |||
| Green | Bob Eichenberger | 1,060 | 2.75 | – | none listed | |||
| New Democratic | Philip Toone | 805 | 2.09 | +0.13 | $1,695.37 | |||
| Total valid votes/Expense limit | 38,526 | 100.00 | $79,194 | |||||
| Total rejected, unmarked and declined ballots | 559 | 1.43 | ||||||
| Turnout | 39,085 | 56.57 | −5.93 | |||||
| Eligible voters | 69,089 | |||||||
| Bloc Québécois notional gain from Liberal | Swing | +16.62 | ||||||
| 2000 federal election redistributed results | |||
|---|---|---|---|
| Party | Vote | % | |
| Liberal | 22,302 | 52.80 | |
| Bloc Québécois | 17,981 | 42.57 | |
| New Democratic | 827 | 1.96 | |
| Alliance | 741 | 1.75 | |
| Progressive Conservative | 388 | 0.92 | |
See also
- List of Canadian federal electoral districts
- Past Canadian electoral districts
References
- "(Code 24019) Census Profile". 2011 census. Statistics Canada. 2012. Retrieved 2011-03-07.
- Campaign expense data from Elections Canada
- 2011 Results from Elections Canada
- Riding history from the Library of Parliament
Notes
- Statistics Canada: 2012
- Statistics Canada: 2012
- https://www12.statcan.gc.ca/census-recensement/2016/dp-pd/dt-td/Rp-eng.cfm?LANG=E&APATH=3&DETAIL=0&DIM=0&FL=A&FREE=0&GC=0&GID=0&GK=0&GRP=1&PID=109979&PRID=10&PTYPE=109445&S=0&SHOWALL=0&SUB=888&Temporal=2016,2017&THEME=118&VID=0&VNAMEE=&VNAMEF=
- "List of confirmed candidates". Elections Canada. Retrieved October 3, 2019.
- "Election Night Results". Elections Canada. Retrieved November 12, 2019.
- "Federal election 2019 live results". CBC Canada Votes. Retrieved October 25, 2019.
- Elections Canada – Confirmed candidates for Gaspésie—Les Îles-de-la-Madeleine, 30 September 2015
- Elections Canada – Preliminary Election Expenses Limits for Candidates Archived August 15, 2015, at the Wayback Machine
- Pundits' Guide to Canadian Elections
- Elections Canada – Official voting results, Forty-first general election, 2011
- Elections Canada – Candidate's electoral campaign return, 41st general election