Compton—Stanstead
Compton—Stanstead is a federal electoral district in Quebec, Canada, that has been represented in the House of Commons of Canada since 1997.
 | |||
| Federal electoral district | |||
| Legislature | House of Commons | ||
| MP |
Liberal | ||
| District created | 1996 | ||
| First contested | 1997 | ||
| Last contested | 2019 | ||
| District webpage | profile, map | ||
| Demographics | |||
| Population (2011)[1] | 101,946 | ||
| Electors (2019) | 84,383 | ||
| Area (km²)[2] | 4,815 | ||
| Pop. density (per km²) | 21.2 | ||
| Census divisions | Coaticook RCM, Le Haut-Saint-François RCM, Memphrémagog RCM, Sherbrooke, Le Val-Saint-François RCM | ||
| Census subdivisions | Ascot Corner, Coaticook, Compton, Cookshire-Eaton, East Angus, Sherbrooke (part), Stanstead, Stoke, Weedon | ||
It was created in 1996 from Mégantic—Compton—Stanstead and Richmond—Wolfe ridings.
Geography
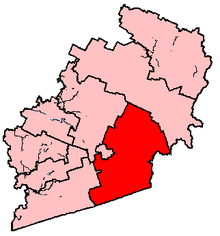
The southern Quebec riding on the US border southeast of Sherbrooke is located in the Quebec region of Estrie. It consists of the RCMs of Coaticook and Le Haut-Saint-François, the eastern half of Memphrémagog, and parts of Le Val-Saint-François and the city of Sherbrooke.
Main towns include Coaticook, Lennoxville (now part of Sherbrooke), North Hatley, Stanstead, and Ayer's Cliff.
Neighbouring ridings are Brome—Missisquoi, Richmond—Arthabaska, Sherbrooke, and Mégantic—L'Érable.
The 2012 electoral redistribution saw this riding lose and gain territories with Sherbrooke.
Members of Parliament
This riding has elected the following Members of Parliament:
| Parliament | Years | Member | Party | |
|---|---|---|---|---|
| Compton—Stanstead Riding created from Mégantic—Compton—Stanstead and Richmond—Wolfe |
||||
| 36th | 1997–2000 | David Price | Progressive Conservative | |
| 37th | 2000–2004 | Liberal | ||
| 38th | 2004–2006 | France Bonsant | Bloc Québécois | |
| 39th | 2006–2008 | |||
| 40th | 2008–2011 | |||
| 41st | 2011–2015 | Jean Rousseau | New Democratic | |
| 42nd | 2015–2019 | Marie-Claude Bibeau | Liberal | |
| 43rd | 2019–present | |||
Election results
| 2019 Canadian federal election | ||||||||
|---|---|---|---|---|---|---|---|---|
| Party | Candidate | Votes | % | ±% | Expenditures | |||
| Liberal | Marie-Claude Bibeau | 21,731 | 37.3 | +0.32 | ||||
| Bloc Québécois | David Benoît | 18,571 | 31.9 | |||||
| Conservative | Jessy Mc Neil | 8,446 | 14.5 | |||||
| New Democratic | Naomie Mathieu Chauvette | 5,607 | 9.6 | |||||
| Green | Jean Rousseau | 3,044 | 5.2 | |||||
| People's | Paul Reed | 586 | 1.0 | |||||
| Rhinoceros | Jonathan Therrien | 252 | 0.4 | |||||
| Total valid votes/Expense limit | 58,237 | 100.0 | ||||||
| Total rejected ballots | 988 | |||||||
| Turnout | 59,225 | 70.2 | ||||||
| Eligible voters | 84,383 | |||||||
| Source: Elections Canada[3][4] | ||||||||
| 2015 Canadian federal election | ||||||||
|---|---|---|---|---|---|---|---|---|
| Party | Candidate | Votes | % | ±% | Expenditures | |||
| Liberal | Marie-Claude Bibeau | 20,582 | 36.88 | +24.89 | $30,817.38 | |||
| New Democratic | Jean Rousseau | 15,300 | 27.41 | -19.86 | $22,398.05 | |||
| Bloc Québécois | France Bonsant | 11,551 | 20.70 | -5.73 | $41,452.44 | |||
| Conservative | Gustavo Labrador | 6,978 | 12.50 | +0.65 | $24,135.57 | |||
| Green | Korie Marshall | 1,085 | 1.94 | -0.49 | – | |||
| Rhinoceros | Kévin Côté | 315 | 0.56 | – | – | |||
| Total valid votes/Expense limit | 55,811 | 100.00 | $218,288.13 | |||||
| Total rejected ballots | 748 | 1.32 | – | |||||
| Turnout | 56,559 | 69.09 | – | |||||
| Eligible voters | 81,867 | |||||||
| Liberal gain from New Democratic | Swing | +22.37 | ||||||
| Source: Elections Canada[5][6] | ||||||||
| 2011 federal election redistributed results[7] | |||
|---|---|---|---|
| Party | Vote | % | |
| New Democratic | 23,529 | 47.27 | |
| Bloc Québécois | 13,155 | 26.43 | |
| Liberal | 5,970 | 11.99 | |
| Conservative | 5,901 | 11.86 | |
| Green | 1,211 | 2.43 | |
| Others | 5 | 0.01 | |
| 2011 Canadian federal election | ||||||||
|---|---|---|---|---|---|---|---|---|
| Party | Candidate | Votes | % | ±% | Expenditures | |||
| New Democratic | Jean Rousseau | 24,097 | 47.59 | +36.31 | ||||
| Bloc Québécois | France Bonsant | 13,179 | 26.03 | - 15.82 | ||||
| Liberal | William Hogg | 6,132 | 12.09 | -10.44 | ||||
| Conservative | Sandrine Gressard Bélanger | 5,982 | 11.72 | -7.72 | ||||
| Green | Gary Caldwell | 1,241 | 2.57 | -2.30 | ||||
| Total valid votes/Expense limit | 50,631 | 100.00 | ||||||
| Total rejected ballots | 580 | 1.13 | -0.03 | |||||
| Turnout | 51,211 | 64.59 | +2.61 | |||||
| Eligible voters | 80,382 | – | – | |||||
| 2008 Canadian federal election | ||||||||
|---|---|---|---|---|---|---|---|---|
| Party | Candidate | Votes | % | ±% | Expenditures | |||
| Bloc Québécois | France Bonsant | 20,332 | 41.85 | -0.9 | $42,534 | |||
| Liberal | William Hogg | 10,946 | 22.53 | +0.2 | $17,476 | |||
| Conservative | Michel Gagné | 9,445 | 19.44 | -4.9 | $57,862 | |||
| New Democratic | Jean Rousseau | 5,483 | 11.28 | +5.1 | $1,820 | |||
| Green | Gary Caldwell | 2,368 | 4.87 | +0.5 | $11,114 | |||
| Total valid votes/Expense limit | 48,574 | 100.00 | $84,153 | |||||
| Total rejected ballots | 572 | 1.16 | ||||||
| Turnout | 49,146 | 62.97 | ||||||
| 2006 Canadian federal election | ||||||||
|---|---|---|---|---|---|---|---|---|
| Party | Candidate | Votes | % | ±% | Expenditures | |||
| Bloc Québécois | France Bonsant | 21,316 | 42.8 | -3.9 | $38,909 | |||
| Conservative | Gary Caldwell | 12,131 | 24.3 | +13.9 | $44,452 | |||
| Liberal | David Price | 11,126 | 22.3 | -13.7 | $56,653 | |||
| New Democratic | Stéphane Bürgi | 3,099 | 6.2 | +2.9 | $1,674 | |||
| Green | Gaétan Perreault | 2,171 | 4.4 | +0.8 | $310 | |||
| Total valid votes/Expense limit | 49,843 | 100.0 | $77,428 | |||||
| 2004 Canadian federal election | ||||||||
|---|---|---|---|---|---|---|---|---|
| Party | Candidate | Votes | % | ±% | Expenditures | |||
| Bloc Québécois | France Bonsant | 20,450 | 46.7 | +7.8 | $36,450 | |||
| Liberal | David Price | 15,752 | 36.0 | -10.6 | $55,575 | |||
| Conservative | Gary Caldwell | 4,589 | 10.5 | -1.3 | $13,713 | |||
| Green | Laurier Busque | 1,546 | 3.5 | $540 | ||||
| New Democratic | Martin Baller | 1,451 | 3.3 | +1.8 | ||||
| Total valid votes/Expense limit | 43,788 | 100.0 | $75,354 | |||||
Note: Conservative vote is compared to the total of the Canadian Alliance vote and Progressive Conservative vote in the 2000 election.
| 2000 Canadian federal election | ||||||||
|---|---|---|---|---|---|---|---|---|
| Party | Candidate | Votes | % | ±% | ||||
| Liberal | David Price | 17,729 | 46.6 | +26.6 | ||||
| Bloc Québécois | Gaston Leroux | 14,808 | 38.9 | +6.0 | ||||
| Progressive Conservative | Mary Ann Dewey-Plante | 2,422 | 6.4 | -38.2 | ||||
| Alliance | Marc Carrier | 2,061 | 5.4 | |||||
| New Democratic | Christine Moore | 580 | 1.5 | +0.1 | ||||
| Natural Law | Marc Roy | 476 | 1.3 | +0.2 | ||||
| Total valid votes | 38,076 | 100.0 | ||||||
| 1997 Canadian federal election | ||||||||
|---|---|---|---|---|---|---|---|---|
| Party | Candidate | Votes | % | |||||
| Progressive Conservative | David Price | 18,125 | 44.6 | |||||
| Bloc Québécois | Maurice Bernier | 13,367 | 32.9 | |||||
| Liberal | Gaétan Grenier | 8,119 | 20.0 | |||||
| New Democratic | Christine Moore | 587 | 1.4 | |||||
| Natural Law | Lisette Proulx | 439 | 1.1 | |||||
| Total valid votes | 40,637 | 100.0 | ||||||
See also
- List of Canadian federal electoral districts
- Past Canadian electoral districts
References
- "(Code 24017) Census Profile". 2011 census. Statistics Canada. 2012. Retrieved 2011-03-07.
- 2011 Results from Elections Canada
- Riding history from the Library of Parliament
- Campaign expense data from Elections Canada
Notes
- Statistics Canada: 2012
- Statistics Canada: 2012
- "List of confirmed candidates". Elections Canada. Retrieved October 3, 2019.
- "Election Night Results". Elections Canada. Retrieved November 12, 2019.
- Elections Canada – Confirmed candidates for Compton—Stanstead, 30 September 2015
- Elections Canada – Preliminary Election Expenses Limits for Candidates Archived August 15, 2015, at the Wayback Machine
- Pundits' Guide to Canadian Elections