Terrebonne—Blainville
Terrebonne—Blainville was a federal electoral district in Quebec, Canada, that was represented in the House of Commons of Canada from 1997 until 2015.
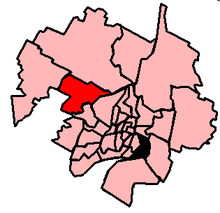 2003 boundaries | |
| Defunct federal electoral district | |
| Legislature | House of Commons |
| District created | 1996 |
| District abolished | 2012 |
| First contested | 1997 |
| Last contested | 2011 |
| District webpage | profile, map |
| Demographics | |
| Population (2011)[1] | 121,095 |
| Electors (2011) | 83,300 |
| Area (km²)[1] | 220.13 |
| Census divisions | Thérèse-De Blainville, Les Moulins |
| Census subdivisions | Terrebonne, Blainville, Sainte-Anne-des-Plaines |
It was created in 1996 out of parts of Blainville—Deux-Montagnes, Repentigny and Joliette ridings.
The 2012 federal electoral boundaries redistribution saw the riding abolished into Terrebonne, Thérèse-De Blainville and Mirabel.[2]
Geography
The riding contains the towns of Blainville et Sainte-Anne-des-Plaines in the region of Laurentides, and the town of Terrebonne in Lanaudière.
The neighbouring ridings are Argenteuil—Papineau—Mirabel, Rivière-du-Nord, Montcalm, Alfred-Pellan, and Marc-Aurèle-Fortin.
Members of Parliament
| Parliament | Years | Member | Party | |
|---|---|---|---|---|
| Terrebonne—Blainville Riding created from Blainville—Deux-Montagnes, Terrebonne and Joliette |
||||
| 36th | 1997–2000 | Paul Mercier | Bloc Québécois | |
| 37th | 2000–2004 | Diane Bourgeois | ||
| 38th | 2004–2006 | |||
| 39th | 2006–2008 | |||
| 40th | 2008–2011 | |||
| 41st | 2011–2015 | Charmaine Borg | New Democratic | |
| Riding dissolved into Terrebonne, Thérèse-De Blainville and Mirabel | ||||
Election results
Terrebonne—Blainville, 1997–2015
| 2011 Canadian federal election | ||||||||
|---|---|---|---|---|---|---|---|---|
| Party | Candidate | Votes | % | ±% | Expenditures | |||
| New Democratic | Charmaine Borg | 28,260 | 49.3 | +35.8 | ||||
| Bloc Québécois | Diane Bourgeois | 17,663 | 30.8 | -21.8 | ||||
| Conservative | Jean-Philippe Payment | 5,236 | 9.1 | -4.9 | ||||
| Liberal | Robert Frégeau | 4,893 | 8.5 | -8.0 | ||||
| Green | Michel Paulette | 1,219 | 2.1 | -1.1 | ||||
| Total valid votes/Expense limit | 57,271 | 100.0 | ||||||
| Total rejected ballots | 1,025 | 1.8 | +0.1 | |||||
| Turnout | 58,296 | 65.9 | -0.1 | |||||
| Eligible voters | 88,442 | – | – | |||||
| New Democratic gain from Bloc Québécois | Swing | +28.8 | ||||||
| 2008 Canadian federal election | ||||||||
|---|---|---|---|---|---|---|---|---|
| Party | Candidate | Votes | % | ±% | Expenditures | |||
| Bloc Québécois | Diane Bourgeois | 28,303 | 52.3 | -6.8 | $62,243 | |||
| Liberal | Eva Nassif | 8,937 | 16.5 | +7.6 | $14,566 | |||
| Conservative | Daniel Lebel | 7,551 | 14.0 | -6.0 | $36,447 | |||
| New Democratic | Michel Le Clair | 7,278 | 13.5 | +6.0 | $2,256 | |||
| Green | Martin Drapeau | 1,714 | 3.2 | -1.2 | $806 | |||
| Independent | M. Zamboni Cadieux | 283 | 0.5 | – | ||||
| Total valid votes/Expense limit | 54,066 | 100.0 | $87,417 | |||||
| Total rejected ballots | 911 | 1.7 | 0.0 | |||||
| Turnout | 54,977 | 66.0 | +3.7 | |||||
| 2006 Canadian federal election | ||||||||
|---|---|---|---|---|---|---|---|---|
| Party | Candidate | Votes | % | ±% | Expenditures | |||
| Bloc Québécois | Diane Bourgeois | 30,197 | 59.2 | -9.0 | $42,306 | |||
| Conservative | Daniel Lebel | 10,212 | 20.0 | +14.4 | $15,696 | |||
| Liberal | Maxime Thériault | 4,576 | 9.0 | -10.7 | $8,126 | |||
| New Democratic | Michel Leclair | 3,829 | 7.5 | +4.3 | $1,211 | |||
| Green | Martin Drapeau | 2,216 | 4.3 | +1.0 | $291 | |||
| Total valid votes/Expense limit | 51,030 | 100.0 | $78,841 | |||||
| Total rejected ballots | 886 | 1.7 | -1.0 | |||||
| Turnout | 51,916 | 62.3 | +5.7 | |||||
| 2004 Canadian federal election | ||||||||
|---|---|---|---|---|---|---|---|---|
| Party | Candidate | Votes | % | ±% | Expenditures | |||
| Bloc Québécois | Diane Bourgeois | 31,288 | 68.1 | +16.2 | $62,201 | |||
| Liberal | Pierre Gingras | 9,048 | 19.7 | -12.0 | $54,385 | |||
| Conservative | Patrick Légaré | 2,582 | 5.6 | -6.6 | $3,305 | |||
| Green | Martin Drapeau | 1,554 | 3.4 | – | ||||
| New Democratic | Normand Beaudet | 1,451 | 3.2 | +1.2 | ||||
| Total valid votes/Expense limit | 45,923 | 100.0 | $75,469 | |||||
| Total rejected ballots | 1,252 | 2.7 | ||||||
| Turnout | 47,175 | 56.6 | ||||||
Note: Conservative vote is compared to the total of the Canadian Alliance vote and Progressive Conservative vote in 2000 election.
| 2000 Canadian federal election | ||||||||
|---|---|---|---|---|---|---|---|---|
| Party | Candidate | Votes | % | ±% | ||||
| Bloc Québécois | Diane Bourgeois | 28,933 | 51.9 | +1.5 | ||||
| Liberal | François-Hugues Liberge | 17,668 | 31.7 | +5.3 | ||||
| Alliance | Guylaine St-Georges | 3,741 | 6.7 | |||||
| Progressive Conservative | Mélanie Gemme | 3,089 | 5.5 | -15.8 | ||||
| Natural Law | Pascale Levert | 1,193 | 2.1 | |||||
| New Democratic | Normand Beaudet | 1,111 | 2.0 | 0.0 | ||||
| Total valid votes | 55,735 | 100.0 | ||||||
| 1997 Canadian federal election | ||||||||
|---|---|---|---|---|---|---|---|---|
| Party | Candidate | Votes | % | ±% | ||||
| Bloc Québécois | Paul Mercier | 28,066 | 50.4 | -18.5 | ||||
| Liberal | Marcel Therrien | 14,687 | 26.4 | +8.5 | ||||
| Progressive Conservative | Dominic Dupuis | 11,883 | 21.3 | +9.7 | ||||
| New Democratic | Colette Bouchard | 1,090 | 2.0 | +0.9 | ||||
| Total valid votes | 55,726 | 100.0 | ||||||
See also
- List of Canadian federal electoral districts
- Past Canadian electoral districts