Factions in the Democratic Party (United States)
The Democratic Party of the United States is composed of various factions, with significant overlap and enough agreement between them to coexist in one party.
Centrist factions
Moderate wing
 United States Representative Suzan DelBene |
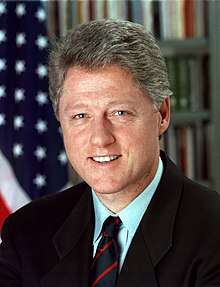 United States President Bill Clinton |
During the 1968 United States presidential election, pro-war moderate Hubert Humphrey took the Democratic presidential nomination over the winner of the popular vote, anti-war progressive Eugene McCarthy.[1]
In 1985, the Democratic Leadership Council, a moderate faction within the party, was created after the landslide victory of Republican Ronald Reagan over Democrat Walter Mondale at the 1984 presidential election.[2]
During the 1992 United States presidential election, Bill Clinton and Al Gore, both members of the Democratic Leadership Council, each ran as a New Democrat, a Democrat for more limited government. In 1994, Clinton signed the Violent Crime Control and Law Enforcement Act.[3]
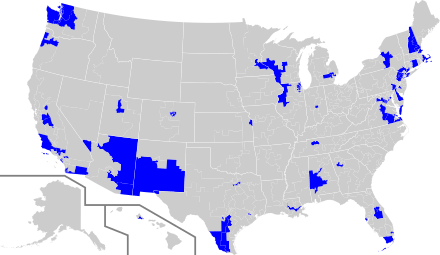
Most moderate Democrats in the House of Representatives are members of the New Democrat Coalition, although there is considerable overlap in the membership of New Democrats and Blue Dogs, with most Blue Dogs also being New Democrats.[4]
Conservative wing
From the 1860s to the 1940s, conservative Democrats came to mean opposition to the Radical Republicans who wanted to grant full citizenship rights to freed slaves and take political power away from the ex-Confederates. In the 1940s, the Democratic Party began to advocate against segregation.
The conservative coalition was an unofficial coalition in the United States Congress bringing together a conservative majority of the Republican Party and the conservative, mostly Southern wing of the Democratic Party. It was dominant in Congress from 1937 to 1963 and remained a political force until the mid-1980s, eventually dying out in the 1990s. In terms of Congressional roll call votes, it primarily appeared on votes affecting labor unions. The conservative coalition did not operate on civil rights bills, for the two wings had opposing viewpoints.[5] However, the coalition did have the power to prevent unwanted bills from even coming to a vote. The coalition included many committee chairmen from the South who blocked bills by not reporting them from their committees. Furthermore, Howard W. Smith, Chairman of the House Rules Committee, often could kill a bill simply by not reporting it out with a favorable rule and he lost some of that power in 1961.[6] The conservative coalition was not concerned with foreign policy as most of the Southern Democrats were internationalists, a position opposed by most Republicans.
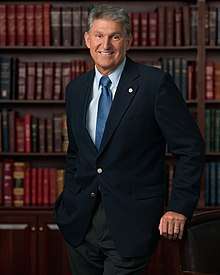
Today, conservative Democrats are generally regarded as members of the Democratic Party who are more conservative than the national political party as a whole. Today's conservative Democrats vary greatly in ideology. Some are fiscally conservative yet socially liberal, somewhat akin to the now rare Moderate Republicans, whereas others have a more communitarian ideology – that is, socially moderate but in favor of qualified economic intervention – reminiscent of Christian democrats in Europe and Latin America. On foreign policy, conservative Democrats are generally liberal internationalists. Conservative Democrats in the U.S. House of Representatives are usually members of the Blue Dog Coalition, although there is some overlap with the New Democrats. The Blue Dog Coalition prioritizes pragmatic solutions to critical issues, "pursuing fiscal responsibility, ensuring a strong national defense, and transcending party lines to get things done for the American people."[7]
Libertarian wing
Civil liberties advocates often support the Democratic Party because its positions on such issues as civil rights and separation of church and state are more closely aligned to their own than the positions of the Republican Party and because the Democrats' economic agenda may be more appealing to them than that of the Libertarian Party.[8] Some civil libertarians also support the party because of their opposition to torture, warrantless wiretapping, indefinite detention without trial or charge, the Patriot Act, and the Guantanamo Bay detention camp.[9][10]
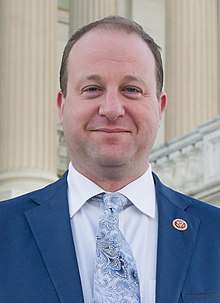
In the 2010s, following the revelations about National Security Agency (NSA) surveillance in 2013 and the advent of online decentralization and cryptocurrencies like Bitcoin, Democratic lawmakers such as Representative Jared Polis have worked alongside libertarian Republicans like Senator Rand Paul and Representative Justin Amash, earning plaudits from libertarian sources as Reason.[11][12][13] The growing political power of Silicon Valley, a longtime Democratic stronghold which is friendly to economic deregulation and strong civil liberties protections while maintaining traditionally liberal views on social issues, has had an impact on the libertarian leanings of young Democrats.[14][15][16]
Jared Polis, elected in 2018 as Governor of Colorado, has been described as a libertarian Democrat.[17] While he supports universal healthcare, paid parental leave, and renewable energy, he also wants to lower income taxes and said, "The less government intervention in our private lives, the better."[17]
The Democratic Freedom Caucus is an organized group of this faction.[18]
Center-left factions
Liberal wing
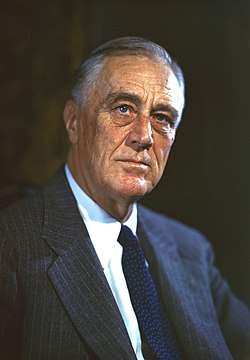
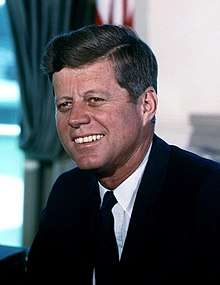
Modern liberalism in the Democratic Party began during the Progressive Era. From 1900 to 1920, liberals called themselves progressives and rallied behind Democrats such as William Jennings Bryan and Woodrow Wilson to fight corruption, waste, and big trusts. The Wilson administration saw the enactment of the New Freedom, a package of progressive social programs. The rise of the women's suffrage movement saw the passage of the Nineteenth Amendment to the United States Constitution and a push for civil rights legislation on the basis of gender. The first modern self-described liberal Democratic president was Franklin D. Roosevelt, who enacted the New Deal, a series of social liberal programs enacted in the United States between 1933 and 1938 and a few that came later. In the 1940s, liberal Democrats began pushing for desegregation and civil rights legislation for racial minorities, and in the 1960s, liberal Democrats began pushing for immigration reform and gun control. Beyond the New Deal, Democratic presidents advocated landmark liberal programs such as John F. Kennedy's New Frontier and Lyndon B. Johnson's Great Society, the latter of which established Medicare and Medicaid. During the Cold War, the liberal movement became anti-communist. Beginning in the 1970s, liberal Democrats emphasized civil rights for disabled people, consumer protection, environmentalism, LGBT rights, reproductive rights, and ending capital punishment.
The presidency of Barack Obama was comparatively further to the left than Bill Clinton's. The key legislative achievement of the Obama administration, the passage and enactment of the Patient Protection and Affordable Care Act (Obamacare), was generally supported among liberal Democrats.[19] On social progressivism, liberal Democrats achieved expansion of LGBT rights, federal hate crime laws, rescinding the Mexico City Policy, later reinstituted by President Donald Trump, rescinding the ban on federal taxpayer dollars to fund research on embryonic stem cells, Joint Comprehensive Plan of Action and the Cuban thaw. In the 2010s, Democratic liberals began pushing for the legalization of cannabis, succeeding in several states. Barack Obama did not crack down on states that legalized cannabis during his presidency.[20]
In 2011, the Democratic Leadership Council, which supported more centrist and Third Way positions, was dissolved. In 2016, Democratic presidential nominee Hillary Clinton eschewed her husband's "New Covenant" centrism for more liberal proposals such as rolling back mandatory minimum sentencing laws, a debt-free college tuition plan for public university students, and a pathway to citizenship for undocumented immigrants.[21][22]
A 2015 Gallup annual average based on January though December 2015 as part of Gallup's monthly Gallup Poll Social Series surveys found a record 45% of Democrats identify as liberals—a rise from 29% in 2000.[23] A 2015 Public Religion Research Institute found 82% of liberal Democrats opposed permitting small business owners to discriminate by refusing products and services to gay and lesbian people, while 15% supported allowing this.[24] A March 2015 Pew Research Center poll found 75% of liberal Democrats believed cannabis should be legal, while 22% were opposed.[25] A March 2016 Pew Research Center poll found 84% of liberal Democrats support same-sex marriage, while 12% oppose it, and 87% believe homosexuality should be accepted by society, while 8% believe it should be discouraged.[26] A May 2016 Gallup poll found that more Democrats identified as liberal on social issues (57%) than as liberal on economic issues (41%). The 57% of Democrats who said they were liberal on social issues is up from 35% in 2001.[27]
In 2019, the Pew Research Center found that 47% of Democratic and Democratic-leaning registered voters identify as liberal or very liberal, while 51% identify as moderate, conservative, or very conservative.[28]
Progressive wing
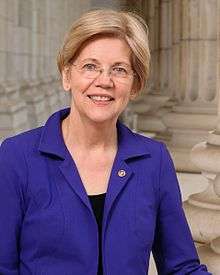 United States Senator Elizabeth Warren |

Today, progressives are often considered synonymous with liberals but are sometimes considered to be more left-leaning. They are regarded as social progressives. On economic issues, progressive Democrats generally promote Keynesian economics or a mixed economic system. The Congressional Progressive Caucus (CPC) is a caucus of progressive House Democrats, along with one independent in the Senate, in the Congress. It is the second largest Democratic caucus in the House of Representatives and its members have included Representatives Dennis Kucinich (OH), Alan Grayson (FL), John Conyers (MI), Barbara Lee (CA), Jim McDermott (WA), and John Lewis (GA).[29]
Many progressive Democrats are ideological descendants of the New Left of Democratic presidential candidate and Senator George McGovern of South Dakota, while others were involved in the presidential candidacies of Vermont Governor Howard Dean and U.S. Representative Dennis Kucinich of Ohio. Still others are former members of the Green Party. This group consists disproportionately of college-educated professionals.[30] A recent study by the Pew Research Center found that a plurality (41%) resided in mass affluent households and 49% were college graduates.[31]
Progressive Democratic candidates for public office have had popular support as candidates in metropolitan areas outside the South. Senators Paul Wellstone (MN),[32] Elizabeth Warren (MA),[33] Jeff Merkley (OR),[34] and Sherrod Brown (OH) have been described as progressive. Additionally, Senator Bernie Sanders (VT), although not a Democrat, is widely considered a progressive who caucuses with the Democrats. Other notable progressives include Henry A. Wallace,[35] Eugene McCarthy, Russ Feingold, and Ted Kennedy.[36]
The 2016 Democratic Party presidential primaries between Hillary Clinton and Bernie Sanders was largely a fight along ideological lines between the liberals and progressives. Clinton, who referred to herself as a "progressive who gets things done", received substantial support from African Americans, older Americans, women, LGBT Americans, Latino Americans, and Jewish Americans. Sanders, the first chair of the Congressional Progressive Caucus, instead received an overwhelming majority of support from millennials across the board.
In 2016, the Blue Collar Caucus, a pro-labor, anti-outsourcing Caucus was formed,[37][38][39][40] with significant overlap in members with the Progressive Caucus, although some moderates such as Dan Lipinski are members as well.
Left-wing factions
Social democratic and democratic socialist wings
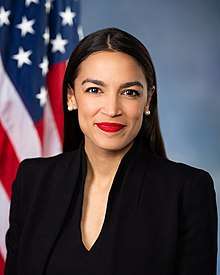 United States Representative Alexandria Ocasio-Cortez |
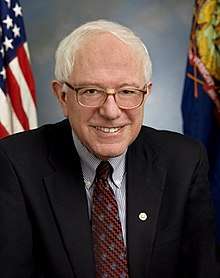 United States Senator Bernie Sanders |
In electoral politics, the Social Democrats, USA (SDUSA) National Co-Chairman Bayard Rustin stated in 1974 that the goal of SDUSA was to transform the Democratic Party into a social democratic party.[41] Since the Great Recession, Occupy Wall Street, and Bernie Sanders's presidential campaigns in 2016 and 2020, support for social democracy in the Democratic Party has increased.
There are three self-described democratic socialists in the United States Congress as of 2019: Senator Bernie Sanders of Vermont, Representative Alexandria Ocasio-Cortez of New York, and Representative Rashida Tlaib of Michigan; Ocasio-Cortez and Tlaib are members of the Democratic Party, while Sanders is an independent who caucuses with the Senate Democrats and has twice run for the Democratic Party's presidential nomination (2016, 2020). In all three of Sanders's elections to the Senate (2006, 2012, 2018) and three of his elections to the House (1994, 1998, 2002), Sanders won the Democratic nomination, either through write-ins or appearing on the Democratic primary ballot; in all instances, he declined the nomination to remain an independent. Former Representative Ron Dellums of California described himself as a democratic socialist, and served from 1971 to 1998 in the House of Representatives and from 2007 to 2011 as Mayor of Oakland.[42]
Voter base
African Americans


Originally, the Republican Party was favored by African Americans after the end of the civil war and emancipation of black slaves. This trend started to gradually change in the 1930s, with Franklin D. Roosevelt's New Deal programs that gave economic relief to all minorities including African Americans and Hispanics. Support for the civil rights movement in the 1960s by Democratic presidents John F. Kennedy and Lyndon B. Johnson helped give the Democrats even larger support among the African-American community, although their position also alienated the Southern white population. Today, African Americans have as strong support for the Democratic Party as any group has for either party, voting 90% Democratic in the 2000 presidential election,[43] 88% Democratic in the 2004 presidential election,[44] and 94% Democratic in the 2008 presidential election.[45]
Age
18–29-year-old Americans
30–44-year-old Americans

Asian Americans
The Democratic Party also has considerable support in the small yet growing Asian-American population. The Asian-American population had been a stronghold of the Republican Party until the United States presidential election of 1992 in which George H. W. Bush won 55% of the Asian-American vote, compared to Bill Clinton winning 31% and Ross Perot winning 15%. Originally, the majority of Asian Americans consisted of strongly anti-communist Vietnamese refugees, Chinese Americans, Taiwanese Americans, Korean Americans, and Filipino Americans. The Republican Party's socially conservative, fervently anti-communist position strongly resonated with this original demographic. The Democratic Party made gains among the Asian-American population starting in 1996 and in 2006 won 62% of the Asian-American vote. Exit polls after the 2008 presidential election indicated that Democrat Barack Obama had won 62% of the Asian-American vote.[76] In the 2012 presidential election, 73% of the Asian-American electorate voted for Obama's reelection.[77]
According to a survey taken by the Times of India, Obama had the support of 85% of Indian Americans, 68% of Chinese Americans, and 57% of Filipino Americans in 2012.[78] The Asian-American community's increasing number of young voters has also helped to erode traditionally Republican voting blocs such as Vietnamese Americans, making the community increasingly a Democratic stronghold. Prominent Asian-American Democrats include Senators Mazie Hirono and Tammy Duckworth, former Senators Daniel Inouye and Daniel Akaka, former Governor and Secretary of Commerce Gary Locke, and Representatives Judy Chu, Doris Matsui, and Andy Kim.
Christians
 United States President Jimmy Carter (Baptist) |
 United States Senator Debbie Stabenow (United Methodist Church) |
 United States Vice President Joe Biden (Roman Catholic) |
 United States Senator Catherine Cortez Masto (Roman Catholic) |
 United States Senator Harry Reid (The Church of Jesus Christ of Latter-day Saints) |
.jpg) Massachusetts Governor Michael Dukakis (Greek Orthodox) |
 United States Representative Dina Titus (Greek Orthodox) |
As of 2019, every Democratic United States President, Democratic United States Vice President, and Democratic presidential nominee has been a Christian. According to the Pew Research Center, 78.4% of Democrats in the 116th United States Congress were Christian.[79]
Education
Postgraduate education
.jpg)
Hispanic Americans

The Hispanic-American population, particularly the large Mexican-American population in the Southwest and the large Puerto Rican, Dominican, and South American populations in the Northeast, have been strongholds for the Democratic Party. Hispanic Democrats commonly favor liberal views on immigration. In the 1996 presidential election, Democratic president Bill Clinton received 72% of the Hispanic vote.
After a period of incremental gains under George W. Bush, the Republican Party's support among Hispanics seriously eroded after a heated and acrimonious debate within the party during the 109th Congress over immigration reform. Nationwide protests helped galvanize Hispanic political participation, and in the 2006 elections, Democrats increased their share of the Hispanic vote to 69%.[81] This trend continued in 2008, as Barack Obama carried the Latino vote with 67%.[45] Obama expanded his share of the Latino vote to 71% in the 2012 presidential election.
Income
Families with income less than $30,000
| Year | Branch | % of Democratic vote among families with income less than $30,000 | |
|---|---|---|---|
| 1992[55] | United States House of Representatives | 61 | |
| 1994[57] | United States House of Representatives | 55 | |
| 1996[58] | United States House of Representatives | 58 | |
| 1998[60] | United States House of Representatives | 56 | |
| 2000[61] | United States House of Representatives | 58 | |
| 2002[63] | United States House of Representatives | 60 | |
| 2004[64] | United States House of Representatives | 62 | |
| 2006[66] | United States House of Representatives | 65 | |
| 2008[67] | United States House of Representatives | 68 | |
| 2010[69] | United States House of Representatives | 57 | |
| 2012[70] | United States House of Representatives | 64 | |
| 2014[72] | United States House of Representatives | 60 | |
| 2016[73] | United States Presidency | 53 | |
| 2016[74] | United States House of Representatives | 57 | |
| 2018[75] | United States House of Representatives | 63 | |
Families with income $30,000–49,999
Irreligious Americans
.jpg)
The Democratic Party receives support from secular organizations such as the Secular Coalition for America[82] and many agnostic and atheist Americans. Exit polls from the 2008 election showed that although a religious affiliation of "none" accounted for 12% of the electorate, they overwhelmingly voted for Obama by a 75–25% margin.[83] In his inaugural address, Obama acknowledged atheists by saying that the United States is not just "Christians and Muslims, Jews and Hindus but non-believers as well".[84] In the 2012 election cycle, Obama had moderate to high rankings with the Secular Coalition for America, whereas the majority of the Republican candidates had ratings in the low-to-failing range.[85]
A Pew Research Center survey conducted between January and June 2016 found 28% of Democratic and Democratic-leaning registered voters were religiously unaffiliated. A Pew Research Center survey conducted in June 2016 found that 67% of religious "nones" supported Hillary Clinton and 23% supported Donald Trump.[86]
| Year | Branch | % of Democratic vote who self identify their religion as "None" | |
|---|---|---|---|
| 1996[87] | United States Presidency | 59 | |
| 2000[88] | United States Presidency | 61 | |
| 2004[89] | United States House of Representatives | 65 | |
| 2004[65] | United States Presidency | 67 | |
| 2006[90] | United States House of Representatives | 74 | |
| 2008[91] | United States House of Representatives | 72 | |
| 2008[92] | United States Presidency | 75 | |
| 2012[93] | United States House of Representatives | 71 | |
| 2012[71] | United States Presidency | 70 | |
| 2014[94] | United States House of Representatives | 69 | |
| 2016[73] | United States Presidency | 68 | |
| 2016[74] | United States House of Representatives | 72 | |
| 2018[75] | United States House of Representatives | 70 | |
Atheist and agnostic Americans
An October 2012 American Values Survey found that among atheist and agnostic American voters, 51% identified as politically independent, 39% Democratic, 9% Republican, and 1% other. Moreover, 57% in this group identified as liberal, and 81% supported Barack Obama in the 2012 presidential election.[95]
Jewish Americans


Jewish Americans are a stronghold for the Democratic Party, with more than 70% of Jewish voters having cast their ballots for the Democrats in the 1992 through 2016 presidential elections. Of the 29 Jewish Senators and Representatives who served in the 114th Congress, 27 were Democrats.[96] Among American Jews are people who consider themselves religious believers of one denomination or another as well as people who are explicitly or implicitly secular.
Labor
_(1).jpg)
Since the 1930s, a critical component of the Democratic Party coalition has been organized labor. Labor unions supply a great deal of the money, grassroots political organization, and voting base of support for the party. Union membership in the United States has declined from an all-time high in 1954 of 35% to a low of 11% in 2015. After the 1968 Democratic National Convention, the McGovern–Fraser Commission set up the modern system of primaries. It also removed organized labor from its structural position of power in the Democratic Party and opened it up democratically to the voters.
| Year | Branch | % of Democratic vote among union members | |
|---|---|---|---|
| 2000[80] | United States Presidency | 62 | |
| 2004[89] | United States House of Representatives | 65 | |
| 2004[65] | United States Presidency | 61 | |
| 2006[90] | United States House of Representatives | 68 | |
| 2008[99] | United States House of Representatives | 65 | |
| 2008[100] | United States Presidency | 61 | |
LGBT Americans
 United States Representative David Cicilline |
 United States Senator Tammy Baldwin |
Since the 1970s, LGBT Americans have been a key constituency in the Democratic Party. In 1971, the Alice B. Toklas LGBT Democratic Club was formed as the first organization for LGBT Democrats in the nation. During the 1980 Democratic Party presidential primaries, Ted Kennedy alleged that President Jimmy Carter was not doing enough for LGBT rights. LGBT voters contributed to Kennedy's victory in California's primary.
Presidents Bill Clinton and Barack Obama both heavily targeted LGBT voters. Exit polling from 1990 to the present shows that LGBT voters overwhelmingly prefer the Democratic Party over the Republican Party. In the 2012 election exit polls, Obama won 76% of LGBT voters. In the 2016 election exit polls, Hillary Clinton won 78% of LGBT voters. In the 2018 election exit polls, Democratic candidates for the House of Representatives won 82% of LGBT voters.
| Poll source | Date administered |
Sample size |
Hillary Clinton |
Barack Obama |
John Edwards |
Dennis Kucinich |
Bill Richardson |
Chris Dodd |
Joe Biden |
Refused |
|---|---|---|---|---|---|---|---|---|---|---|
| Hunter College | November 15–26, 2007 | 501 | 62.8% | 22.3% | 6.5% | 4.5% | 1.2% | 1.1% | 1.0% | 0.6% |
| Poll source | Date administered |
Sample size |
Hillary Clinton |
Bernie Sanders |
Undecided | Other |
|---|---|---|---|---|---|---|
| SCRUFF | February 2016 | 10,510 | 62.5% | 31.0% | 5.9% | 0.6% |
- Transgender Americans
At the 2000 Democratic National Convention, Jane Fee of Minnesota was the first transgender delegate to a Democratic National Convention. The 2008 national Democratic Party platform for the first time included "gender identity" in the party platform, the first explicit inclusion of transgender people in the national Democratic Party platform. In 2009, the Democratic National Committee (DNC) added gender identity to the DNC's non-discrimination policy and DNC Chair Tim Kaine appointed Barbra Casbar Siperstein the first openly transgender member of the DNC. In 2010, President Obama became the first president to appoint an openly transgender person to political positions in the United States federal government. In 2012, Trans United for Obama, the first partisan transgender issues group was formed to reelect President Barack Obama.[101] During the 2015 State of the Union Address, President Obama became the first U.S. president ever to use the term "transgender".[102] At the 2016 Democratic National Convention, Sarah McBride became the first openly transgender person to address a Democratic National Convention.[103] A 2015 United States Transgender Survey found 50% of transgender Americans identified as Democrats and 48% as independents. When asked about their political views, 55% described themselves as very liberal, 27% liberal, 15% moderate, 2% conservative, and 1% very conservative.[104]
Marital status
Unmarried

Ideology
Liberals
Moderates
Muslim Americans
Muslims make up about 0.6% of Americans and in the 2008 presidential election, 89% of Muslim Americans voted for Barack Obama.[105] Muslim Americans tend to be financially well off as many in the community are small businessmen and educated professionals. They also tend to be socially conservative, but the younger generation of Muslim Americans tends to be more socially liberal.[106]
After the September 11 attacks, many Muslim Americans experienced hostility and discrimination,[107] and many right-wing religious and political leaders attacked Islam both as a violent religion and as a threat to American values.[108][109] Furthermore, most Muslim Americans opposed the Iraq War, solidifying their shift to the Democratic Party.[110]
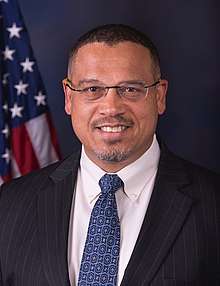
Islamic convert Keith Ellison was elected as the first Muslim member of Congress in 2006. He was elected as the U.S. Representative for Minnesota's 5th congressional district. In 2018, Ellison was elected as the Attorney General of Minnesota.[111]
According to exit polls for the 2018 midterm elections, 78% of Muslim voters supported Democratic candidates. 46% considered themselves liberal on social issues, while 35% considered themselves socially conservative. 40% considered themselves liberal on fiscal issues, while 43% considered themselves fiscally conservative.[112]
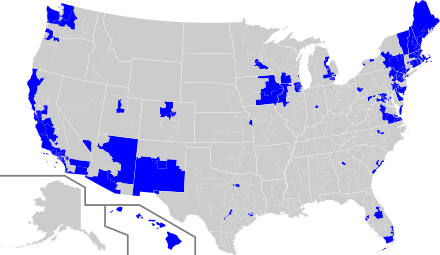
Native Americans
The Democratic Party also has strong support among the Native American population, particularly in Arizona, New Mexico, Montana, North Dakota, South Dakota, Washington, Alaska, Idaho, Minnesota, Wisconsin, Oklahoma,[113] and North Carolina. Though now a small percentage of the population (virtually non-existent in some regions), most Native American precincts vote Democratic in margins exceeded only by African Americans.[114]
Modern-day Democratic Native American politicians include former Congressman and former United States Under Secretary of the Army Brad Carson of Oklahoma, Lieutenant Governor Byron Mallott of Alaska, Principal Chief Bill John Baker of the Cherokee Nation, and Governor Bill Anoatubby of the Chickasaw Nation.
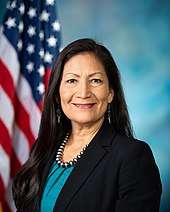
In 2018, Democrats Deb Haaland of New Mexico and Sharice Davids of Kansas became the first Native American women ever elected to Congress.[115] Democrat Peggy Flanagan was also elected in 2018 and currently serves as Lieutenant Governor of Minnesota. Flanagan is the second Native American woman to be elected to statewide executive office in U.S. history and the highest-ranking Native woman to be elected to executive office.[116]
Registered Democrats
_(cropped).jpg)
Women
Working class
.jpg)
The American working class remains a stronghold of the Democratic Party and continues to be an essential part of the Democratic base. Economic insecurity makes the majority of working class people left-of-center on economic issues. However, many working class Democrats differ from liberals in their more socially conservative views. Working class Democrats tend to be more religious and more likely to belong to an ethnic minority. The continued importance of the working class manifests itself in exit polls, which show that the majority of those with working class incomes and education vote for the Democratic Party.[117][118][118][119][119]
Since 1980,[120] there has been a decline in support for the Democratic Party among white working class voters.[121][122][123][124][125][126] In the 2008 presidential election, Barack Obama carried 40% of white voters without college degrees to John McCain carrying 58%.[127] In the 2012 presidential election, Obama carried 36% of white working class voters to Mitt Romney carrying 61%.[128]
See also
- Political positions of the Democratic Party
- Democratic Party (United States) organizations
- Unofficial organizations for Democrats
- Republican Party
- Libertarian Party
References
- Nathanson, Iric. "Two favorite sons: the Humphrey-McCarthy battle of 1968". MinnPost. Retrieved May 17, 2020.
- From, Al. "Recruiting Bill Clinton". The Atlantic. Retrieved May 17, 2020.
- Lussenhop, Jessica. "Clinton crime bill: Why is it so controversial?". BBC. Retrieved May 17, 2020.
- Skelley, Geoffrey. "The House Will Have Just As Many Moderate Democrats As Progressives Next Year". FiveThirtyEight. Retrieved May 17, 2020.
- Katznelson, 1993
- Bruce J. Dierenfield, Keeper of the Rules: Congressman Howard W. Smith of Virginia (1987)
- "Blue Dog Coalition". Blue Dog Coalition. Retrieved May 18, 2020.
- Polis, Jared (October 30, 2014). "Vote Democratic for Real Libertarian Values". Reason Magazine. Retrieved June 6, 2015.
- Moulitsas, Markos (July 7, 2006). "The Libertarian Dem". The Daily Kos. Retrieved June 6, 2015.
- Blake, Aaron (August 1, 2013). "Libertarian Democrats: A movement in search of a leader". The Washington Post. Retrieved June 6, 2015.
- Shackford, Scott (March 4, 2014). "Ban the Dollar!". Reason Magazine. Retrieved June 6, 2015.
- Voorhees, Josh (March 13, 2015). "Pot's Path Forward". Slate. Retrieved June 6, 2015.
- Kim, Seung Min (July 8, 2014). "Cory Booker and Rand Paul team up for justice". Politico. Retrieved June 6, 2015.
- Roose, Kevin (January 24, 2013). "Political Leanings of Silicon Valley". New York Magazine.
- Kotkin, Joel (January 9, 2014). "How Silicon Valley Could Destabilize the Democratic Party". Forbes. Retrieved June 6, 2015.
- Hamby, Peter (April 7, 2014). "Can Silicon Valley disrupt the Democratic Party?". CNN. Retrieved June 6, 2015.
- "Jared Polis, Colorado's governor, is an unusual breed: a libertarian Democrat". The Economist. Retrieved June 10, 2020.
- "Democratic Freedom Caucus, Platform".
- Clement, Scott. "Moderate Democrats are quitting on Obamacare". The Washington Post. Retrieved May 17, 2020.
- Ingraham, Christopher. "Obama says marijuana should be treated like 'cigarettes or alcohol'". The Washington Post. Retrieved May 17, 2020.
- Przybyla, Heidi. "Party of Clinton looks different than in 1992". USA Today.
- Enten, Harry. "Hillary Clinton Was Liberal. Hillary Clinton Is Liberal". FiveThirtyEight.
- "Conservatives Hang On to Ideology Lead by a Thread". January 11, 2016.
- "Beyond Same-sex Marriage: Attitudes on LGBT..." Retrieved May 18, 2020.
- "In Debate Over Legalizing Marijuana, Disagreement Over Drug's Dangers". people-press.org. April 14, 2015.
- "Support steady for same-sex marriage and acceptance of homosexuality". Pew Research. May 12, 2016.
- "Democrats More Liberal on Social Issues Than Economic Ones". May 20, 2016.
- Gilberstadt, Hannah; Daniller, Andrew. "Liberals make up the largest share of Democratic voters, but their growth has slowed in recent years". Pew Research Center. Retrieved June 12, 2020.
- "Congressional Progressive Caucus : Caucus Members". cpc-grijalva.house.gov. Retrieved May 18, 2020.
- "Judis, B. J. (11 July 2003). The trouble with Howard Dean. Salon.com". Archived from the original on July 8, 2012. Retrieved July 19, 2007.
- "Pew Research Center. (10 May 2005). Beyond Red vs. Blue". Retrieved July 12, 2007.
- Dreier, Peter (October 25, 2015). "Paul Wellstone's Ordinary Life and Extraordinary Legacy". HuffPost. Retrieved July 21, 2016.
- Roller, Emma (July 18, 2004). "Elizabeth Warren's 11 Commandments of Progressivism". The Atlantic. Retrieved July 21, 2016.
- "Jeff Merkley – the Progressive Wing".
- Peter Dreier (February 3, 2013). "Henry Wallace, America's Forgotten Visionary". TruthOut.
- Perrin, Dennis (September 26, 2009). "Ted Kennedy: The Last Progressive". HuffPost. Retrieved July 21, 2016.
- "It's time to rebuild the American Dream".
- "Boyle and Veasey form "Blue Collar Caucus" in Congress".
- "Democrats start a new caucus to reach Trump voters".
- "Can Democrats win back the blue-collar voters that flipped to Trump?".
- Fraser, C. Gerald (September 7, 1974). "Socialists seek to transform the Democratic Party" (PDF). The New York Times. p. 11.
- Judis, John (November 1976). "Our Democracy Is More Symbolic Than Real". Jacobin.
- "Election 2000 – Results". CNN. Archived from the original on June 30, 2007.
- "CNN.com Election 2004". CNN. Retrieved May 2, 2010.
- "Local Exit Polls - Election Center 2008 - Elections & Politics from CNN.com". CNN. Retrieved May 2, 2010.
- "How Groups Voted in 1976 – Roper Center". Retrieved May 18, 2020.
- "How Groups Voted in 1980 – Roper Center". Retrieved May 18, 2020.
- "1982".
- "1984".
- "How Groups Voted in 1984 – Roper Center". Retrieved May 18, 2020.
- "1986".
- "1988".
- "How Groups Voted in 1988 – Roper Center". Retrieved May 18, 2020.
- "1990".
- "1992".
- "How Groups Voted in 1992 – Roper Center". Retrieved May 18, 2020.
- "1994".
- "1996".
- "How Groups Voted in 1996 – Roper Center".
- "1998".
- "2000".
- "How Groups Voted in 2000 – Roper Center".
- "2002".
- "2004".
- "CNN.com Election 2004". www.cnn.com. Retrieved May 18, 2020.
- "2006".
- "2008".
- "Local Exit Polls - Election Center 2008 - Elections & Politics from CNN.com". www.cnn.com. Retrieved May 18, 2020.
- "2010".
- "2012".
- "Presidential Race - 2012 Election Center - Elections & Politics from CNN.com". CNN. Retrieved May 18, 2020.
- "2014".
- "2016 United States presidential exit polls CNN".
- "2016 United States House exit polls CNN".
- "2018 midterms: EXIT POLLING | CNN". www.cnn.com. Retrieved May 18, 2020.
- "Dissecting the 2008 Electorate: Most Diverse in U.S. History Archived 2012-06-18 at the Wayback Machine". Pew Research Center. April 30, 2009
- "Presidential Race – 2012 Election Center – President: Full Results – Exit Polls". CNN. November 15, 2012. Archived from the original on November 17, 2012. Retrieved November 18, 2012.
- "85% Indian-Americans support Obama for second term: Survey". The Times of India. May 6, 2012.
- "Faith on the Hill: The religious composition of the 116th Congress". Pew Research Center. January 3, 2019. Retrieved May 18, 2020.
- "CNN.com – Election 2000 – Results". September 12, 2001. Archived from the original on September 12, 2001.
- "CNN.com – Elections 2006". CNN. Retrieved May 2, 2010.
- "Secular Coalition Flunks U.S. House on Religious Freedom Issues". secular.org. Archived from the original on February 3, 2014. Retrieved January 27, 2012.
- "Local Exit Polls - Election Center 2008 - Elections & Politics from CNN.com". CNN.
- "An inaugural first: Obama acknowledges 'non-believers'". USA Today. January 22, 2009.
- "2012 Presidential Primary Candidate Scorecard". secular.org. Archived from the original on April 2, 2015. Retrieved January 27, 2012.
- "Evangelicals Rally to Trump, Religious 'Nones' Back Clinton".
- "AllPolitics - Presidential Election Exit Poll Results". www.cnn.com. Retrieved May 18, 2020.
- "People press" Archived April 29, 2013, at the Wayback Machine.
- "CNN.com Election 2004". www.cnn.com. Retrieved May 18, 2020.
- "CNN.com - Elections 2006". www.cnn.com. Retrieved May 18, 2020.
- "Local Exit Polls - Election Center 2008 - Elections & Politics from CNN.com". www.cnn.com. Retrieved May 18, 2020.
- "Local Exit Polls - Election Center 2008 - Elections & Politics from CNN.com". www.cnn.com. Retrieved May 18, 2020.
- "2012 House of Representatives Election Results – NBC News". December 2, 2011.
- "U.S. House results -- 2014 Election Center -- Elections and Politics from CNN.com". CNN. Retrieved May 18, 2020.
- "Pre-election-Report-for-Web" (PDF). Retrieved May 18, 2020.
- "Jewish Members of U.S. Congress: 114th Congress".
- "Presidential Vote Among Jews, 1972–2008".
- "Partisanship and Presidential Approval Among the Jewish Population". Gallup, Inc.
- "Local Exit Polls - Election Center 2008 - Elections & Politics from CNN.com". www.cnn.com. Retrieved May 18, 2020.
- "Local Exit Polls - Election Center 2008 - Elections & Politics from CNN.com". www.cnn.com. Retrieved May 18, 2020.
- "Minority Voting in the United States [2 volumes]".
- "Obama makes historic 'transgender' reference in SOTU".
- "Transgender Woman Sarah McBride Becomes First to Address a National Convention at DNC".
- "2015 United States Transgender Survey" (PDF).
- "Campaign 2008". Archived from the original on April 23, 2009. Retrieved June 1, 2009.
- Nisbet, Matthew C. "American Muslims: Politically left but socially conservative". Big Think. Archived from the original on August 17, 2016. Retrieved July 21, 2016.
- "Many minority groups were victims of hate crimes after 9-11". Bsu.edu. Archived from the original on June 5, 2010. Retrieved June 17, 2010.
- "McCain Pastor: Islam Is a 'Conspiracy of Spiritual Evil'". ABC News. Retrieved June 17, 2010.
- Swarns, Rachel L. (December 21, 2006). "Congressman Criticizes Election of Muslim". The New York Times. Retrieved May 2, 2010.
- "Poll Finds U.S. Muslims Oppose War, Distrust Political Parties – Kansas City infoZine". Archived from the original on July 27, 2011. Retrieved July 5, 2009.
- Weigel, David. "Keith Ellison wins attorney general race in Minnesota". The Washington Post. Retrieved June 10, 2020.
- "UPDATED: CAIR Releases Results of Midterm Election Exit Poll of Muslim Voters Showing High Turnout". PR Newswire. Retrieved June 16, 2020.
- "Paying Attention to the Native American Vote". PBS. Retrieved January 2, 2016.
- "Dems woo Native American vote".
- Watkins, Eli. "First Native American women elected to Congress: Sharice Davids and Deb Haaland". CNN. Retrieved June 10, 2020.
- Taylor, Rory. "Lieutenant Governor-Elect of Minnesota Peggy Flanagan Becomes the Highest-Ranking Native Woman Elected to Executive Office in the United States". Teen Vogue. Retrieved June 16, 2020.
- "CNN. (2000). Exit Poll". Archived from the original on June 30, 2007. Retrieved July 11, 2007.
- "CNN. (2004). Exit Poll". Retrieved July 11, 2007.
- "CNN. (2006). Exit Poll". Retrieved July 11, 2007.
- Tyson, Alec; Maniam, Shiva (November 9, 2016). "Behind Trump's victory: Divisions by race, gender and education". Pew Research Center. Retrieved July 9, 2017.
- Cohn, Nate (June 11, 2012). "Obama's Problem With White, Non-College Educated Voters is Getting Worse". The New Republic. Retrieved February 13, 2017.
- Edsall, Thomas B. (November 11, 2014). "The Demise of the White Democratic Voter". The New York Times. Retrieved May 5, 2015.
- Drum, Kevin (November 13, 2014). "Can We Talk? Here's Why the White Working Class Hates Democrats". Mother Jones. Retrieved May 5, 2015.
- Bouie, Jamelle (November 14, 2014). "Why Democrats Can't Win Over White Working-Class Voters". Slate. Retrieved May 5, 2015.
- Teixeira, Ruy (January 2, 2015). "Democrats' Problem: White, Working-Class Voters" (Interview). Interviewed by Steve Inskeep. NPR. Retrieved May 5, 2015.
- Judis, John B. (January 31, 2015). "The Emerging Republican Advantage". National Journal. Retrieved May 5, 2015.
- "Local Exit Polls 2008 - Election Center 2008 Elections & Politics from CNN.com". CNN. Retrieved February 13, 2017.
- Teixeira, Ruy; Halpin, John (December 2012). "The Obama Coalition in the 2012 Election and Beyond" (PDF). Center for American Progress. p. 5. Retrieved May 5, 2015.