Exploratory data analysis
In statistics, exploratory data analysis (EDA) is an approach to analyzing data sets to summarize their main characteristics, often with visual methods. A statistical model can be used or not, but primarily EDA is for seeing what the data can tell us beyond the formal modeling or hypothesis testing task. Exploratory data analysis was promoted by John Tukey to encourage statisticians to explore the data, and possibly formulate hypotheses that could lead to new data collection and experiments. EDA is different from initial data analysis (IDA),[1] which focuses more narrowly on checking assumptions required for model fitting and hypothesis testing, and handling missing values and making transformations of variables as needed. EDA encompasses IDA.
| Part of a series on Statistics |
| Data visualization |
|---|
|
Important figures
|
|
Information graphic types |
|
Related topics |
Overview
Tukey defined data analysis in 1961 as: "Procedures for analyzing data, techniques for interpreting the results of such procedures, ways of planning the gathering of data to make its analysis easier, more precise or more accurate, and all the machinery and results of (mathematical) statistics which apply to analyzing data."[2]
Tukey's championing of EDA encouraged the development of statistical computing packages, especially S at Bell Labs. The S programming language inspired the systems 'S'-PLUS and R. This family of statistical-computing environments featured vastly improved dynamic visualization capabilities, which allowed statisticians to identify outliers, trends and patterns in data that merited further study.
Tukey's EDA was related to two other developments in statistical theory: robust statistics and nonparametric statistics, both of which tried to reduce the sensitivity of statistical inferences to errors in formulating statistical models. Tukey promoted the use of five number summary of numerical data—the two extremes (maximum and minimum), the median, and the quartiles—because these median and quartiles, being functions of the empirical distribution are defined for all distributions, unlike the mean and standard deviation; moreover, the quartiles and median are more robust to skewed or heavy-tailed distributions than traditional summaries (the mean and standard deviation). The packages S, S-PLUS, and R included routines using resampling statistics, such as Quenouille and Tukey's jackknife and Efron's bootstrap, which are nonparametric and robust (for many problems).
Exploratory data analysis, robust statistics, nonparametric statistics, and the development of statistical programming languages facilitated statisticians' work on scientific and engineering problems. Such problems included the fabrication of semiconductors and the understanding of communications networks, which concerned Bell Labs. These statistical developments, all championed by Tukey, were designed to complement the analytic theory of testing statistical hypotheses, particularly the Laplacian tradition's emphasis on exponential families.[3]
Development
John W. Tukey wrote the book Exploratory Data Analysis in 1977.[4] Tukey held that too much emphasis in statistics was placed on statistical hypothesis testing (confirmatory data analysis); more emphasis needed to be placed on using data to suggest hypotheses to test. In particular, he held that confusing the two types of analyses and employing them on the same set of data can lead to systematic bias owing to the issues inherent in testing hypotheses suggested by the data.
The objectives of EDA are to:
- Suggest hypotheses about the causes of observed phenomena
- Assess assumptions on which statistical inference will be based
- Support the selection of appropriate statistical tools and techniques
- Provide a basis for further data collection through surveys or experiments[5]
Many EDA techniques have been adopted into data mining. They are also being taught to young students as a way to introduce them to statistical thinking.[6]
Techniques and tools
There are a number of tools that are useful for EDA, but EDA is characterized more by the attitude taken than by particular techniques.[7]
Typical graphical techniques used in EDA are:
- Box plot
- Histogram
- Multi-vari chart
- Run chart
- Pareto chart
- Scatter plot
- Stem-and-leaf plot
- Parallel coordinates
- Odds ratio
- Targeted projection pursuit
- Glyph-based visualization methods such as PhenoPlot[8] and Chernoff faces
- Projection methods such as grand tour, guided tour and manual tour
- Interactive versions of these plots
- Multidimensional scaling
- Principal component analysis (PCA)
- Multilinear PCA
- Nonlinear dimensionality reduction (NLDR)
Typical quantitative techniques are:
History
Many EDA ideas can be traced back to earlier authors, for example:
- Francis Galton emphasized order statistics and quantiles.
- Arthur Lyon Bowley used precursors of the stemplot and five-number summary (Bowley actually used a "seven-figure summary", including the extremes, deciles and quartiles, along with the median—see his Elementary Manual of Statistics (3rd edn., 1920), p. 62 [9]– he defines "the maximum and minimum, median, quartiles and two deciles" as the "seven positions").
- Andrew Ehrenberg articulated a philosophy of data reduction (see his book of the same name).
The Open University course Statistics in Society (MDST 242), took the above ideas and merged them with Gottfried Noether's work, which introduced statistical inference via coin-tossing and the median test.
Example
Findings from EDA are orthogonal to the primary analysis task. To illustrate, consider an example from Cook et al. where the analysis task is to find the variables which best predict the tip that a dining party will give to the waiter.[10] The variables available in the data collected for this task are: the tip amount, total bill, payer gender, smoking/non-smoking section, time of day, day of the week, and size of the party. The primary analysis task is approached by fitting a regression model where the tip rate is the response variable. The fitted model is
- (tip rate) = 0.18 - 0.01 × (party size)
which says that as the size of the dining party increases by one person (leading to a higher bill), the tip rate will decrease by 1%.
However, exploring the data reveals other interesting features not described by this model.
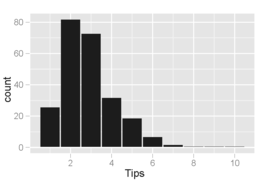 Histogram of tip amounts where the bins cover $1 increments. The distribution of values is skewed right and unimodal, as is common in distributions of small, non-negative quantities.
 Histogram of tip amounts where the bins cover $0.10 increments. An interesting phenomenon is visible: peaks occur at the whole-dollar and half-dollar amounts, which is caused by customers picking round numbers as tips. This behavior is common to other types of purchases too, like gasoline.
 Scatterplot of tips vs. bill. Points below the line correspond to tips that are lower than expected (for that bill amount), and points above the line are higher than expected. We might expect to see a tight, positive linear association, but instead see variation that increases with tip amount. In particular, there are more points far away from the line in the lower right than in the upper left, indicating that more customers are very cheap than very generous.
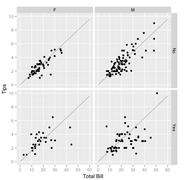 Scatterplot of tips vs. bill separated by payer gender and smoking section status. Smoking parties have a lot more variability in the tips that they give. Males tend to pay the (few) higher bills, and the female non-smokers tend to be very consistent tippers (with three conspicuous exceptions shown in the sample).
What is learned from the plots is different from what is illustrated by the regression model, even though the experiment was not designed to investigate any of these other trends. The patterns found by exploring the data suggest hypotheses about tipping that may not have been anticipated in advance, and which could lead to interesting follow-up experiments where the hypotheses are formally stated and tested by collecting new data.
Software
- JMP, an EDA package from SAS Institute.
- KNIME, Konstanz Information Miner – Open-Source data exploration platform based on Eclipse.
- Orange, an open-source data mining and machine learning software suite.
- Python, an open-source programming language widely used in data mining and machine learning.
- R, an open-source programming language for statistical computing and graphics. Together with Python one of the most popular languages for data science.
- TinkerPlots an EDA software for upper elementary and middle school students.
- Weka an open source data mining package that includes visualization and EDA tools such as targeted projection pursuit.
See also
- Anscombe's quartet, on importance of exploration
- Data dredging
- Predictive analytics
- Structured data analysis (statistics)
- Configural frequency analysis
- Descriptive statistics
References
- Chatfield, C. (1995). Problem Solving: A Statistician's Guide (2nd ed.). Chapman and Hall. ISBN 978-0412606304.
- John Tukey-The Future of Data Analysis-July 1961
- Morgenthaler, Stephan; Fernholz, Luisa T. (2000). "Conversation with John W. Tukey and Elizabeth Tukey, Luisa T. Fernholz and Stephan Morgenthaler". Statistical Science. 15 (1): 79–94. doi:10.1214/ss/1009212675.
- Tukey, John W. (1977). Exploratory Data Analysis. Pearson. ISBN 978-0201076165.
- Behrens-Principles and Procedures of Exploratory Data Analysis-American Psychological Association-1997
- Konold, C. (1999). "Statistics goes to school". Contemporary Psychology. 44 (1): 81–82. doi:10.1037/001949.
- Tukey, John W. (1980). "We need both exploratory and confirmatory". The American Statistician. 34 (1): 23–25. doi:10.1080/00031305.1980.10482706.
- Sailem, Heba Z.; Sero, Julia E.; Bakal, Chris (2015-01-08). "Visualizing cellular imaging data using PhenoPlot". Nature Communications. 6 (1): 5825. doi:10.1038/ncomms6825. ISSN 2041-1723. PMC 4354266. PMID 25569359.
- Elementary Manual of Statistics (3rd edn., 1920)https://archive.org/details/cu31924013702968/page/n5
- Cook, D. and Swayne, D.F. (with A. Buja, D. Temple Lang, H. Hofmann, H. Wickham, M. Lawrence) (2007) ″Interactive and Dynamic Graphics for Data Analysis: With R and GGobi″ Springer, 978-0387717616
Bibliography
- Andrienko, N & Andrienko, G (2005) Exploratory Analysis of Spatial and Temporal Data. A Systematic Approach. Springer. ISBN 3-540-25994-5
- Cook, D. and Swayne, D.F. (with A. Buja, D. Temple Lang, H. Hofmann, H. Wickham, M. Lawrence) (2007-12-12). Interactive and Dynamic Graphics for Data Analysis: With R and GGobi. Springer. ISBN 9780387717616.CS1 maint: multiple names: authors list (link)
- Hoaglin, D C; Mosteller, F & Tukey, John Wilder (Eds) (1985). Exploring Data Tables, Trends and Shapes. ISBN 978-0-471-09776-1.CS1 maint: multiple names: authors list (link) CS1 maint: extra text: authors list (link)
- Hoaglin, D C; Mosteller, F & Tukey, John Wilder (Eds) (1983). Understanding Robust and Exploratory Data Analysis. ISBN 978-0-471-09777-8.CS1 maint: multiple names: authors list (link) CS1 maint: extra text: authors list (link)
- Inselberg, Alfred (2009). Parallel Coordinates:Visual Multidimensional Geometry and its Applications. London New York: Springer. ISBN 978-0-387-68628-8.
- Leinhardt, G., Leinhardt, S., Exploratory Data Analysis: New Tools for the Analysis of Empirical Data, Review of Research in Education, Vol. 8, 1980 (1980), pp. 85–157.
- Martinez, W. L.; Martinez, A. R. & Solka, J. (2010). Exploratory Data Analysis with MATLAB, second edition. Chapman & Hall/CRC. ISBN 9781439812204.CS1 maint: ref=harv (link)
- Theus, M., Urbanek, S. (2008), Interactive Graphics for Data Analysis: Principles and Examples, CRC Press, Boca Raton, FL, ISBN 978-1-58488-594-8
- Tucker, L; MacCallum, R. (1993). Exploratory Factor Analysis. .
- Tukey, John Wilder (1977). Exploratory Data Analysis. Addison-Wesley. ISBN 978-0-201-07616-5.
- Velleman, P. F.; Hoaglin, D. C. (1981). Applications, Basics and Computing of Exploratory Data Analysis. ISBN 978-0-87150-409-8.CS1 maint: ref=harv (link)
- Young, F. W. Valero-Mora, P. and Friendly M. (2006) Visual Statistics: Seeing your data with Dynamic Interactive Graphics. Wiley ISBN 978-0-471-68160-1
- Jambu M. (1991) Exploratory and Multivariate Data Analysis. Academic Press ISBN 0123800900
- S. H. C. DuToit, A. G. W. Steyn, R. H. Stumpf (1986) Graphical Exploratory Data Analysis. Springer ISBN 978-1-4612-9371-2
External links
- Carnegie Mellon University – free online course on Probability and Statistics, with a module on EDA
- • Explanatory data analysis chapter: engineering statistics handbook
| Authority control |
|
|---|