Cartogram
A cartogram is a map in which some thematic mapping variable – such as travel time, population, or GNP – is substituted for land area or distance. The geometry or space of the map is distorted, sometimes extremely, in order to convey the information of this alternate variable. They are primarily used to display emphasis and for analysis as nomographs.[1]
Two common types of cartograms are area and distance cartograms. Cartograms have a fairly long history, with examples from the mid-1800s.[2]
Area cartograms
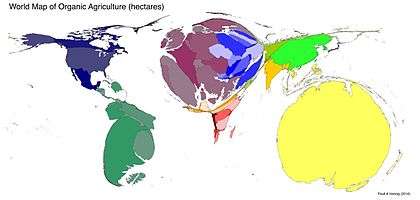
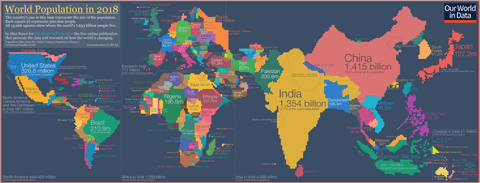
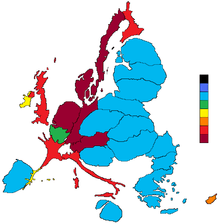
An area cartogram is sometimes referred to as a value-by-area map or an isodemographic map, the latter particularly for a population cartogram, which illustrates the relative sizes of the populations of the countries of the world by scaling the area of each country in proportion to its population; the shape and relative location of each country is retained to as large an extent as possible, but inevitably a large amount of distortion results. Other synonyms in use are anamorphic map, density-equalizing map and Gastner map.[4][5][6]
Area cartograms may be contiguous or noncontiguous. The area cartograms shown on this page are all contiguous, where all areas are connected together and continuously deformed, while a good example of a noncontiguous cartogram was published in The New York Times[7][8], where each area is disconnected from the rest, and is scaled while maintaining the area's shape. This method of cartogram creation is sometimes referred to as the projector method or scaled-down regions.
Cartograms may be classified also by the properties of shape and topology preservation. Classical area cartograms (shown on this page) are typically distorting the shape of spatial units to some degree, but they are strict at preserving correct neighborhood relationships between them. Scaled-down cartograms (from the NY Times example) are strictly shape-preserving. Another branch of cartograms introduced by Dorling, replaces actual shapes with circles scaled according to the mapped feature. Circles are distributed to resemble the original topology. Demers cartogram is a variation of Dorling cartogram, but it uses rectangles instead of circles, and attempts to retain visual cues at the expense of minimum distance. Schematic maps based on quad trees can be seen as non shape-preserving cartograms with some degree of neighborhood preservation.
A collection of contiguous area cartograms is available at Worldmapper,[9] which was started by a collaborative team of researchers at the Universities of Sheffield and Michigan.
Linear cartograms
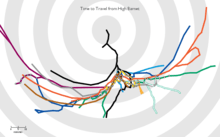
While an area cartogram manipulates the area of a polygon feature, a linear cartogram manipulates linear distance on a line feature. The spatial distortion allows the map reader to easily visualize intangible concepts such as travel time and connectivity on a network. Distance cartograms are also useful for comparing such concepts among different geographic features. A distance cartogram may also be called a central-point cartogram.
A common use of distance cartograms is to show the relative travel times and directions from vertices in a network. For example, on a distance cartogram showing travel time between cities, the less time required to get from one city to another, the shorter the distance on the cartogram will be. When it takes a longer time to travel between two cities, they will be shown as further apart in the cartogram, even if they are physically close together.
Distance cartograms are also used to show connectivity. This is common on subway and metro maps, where stations and stops are shown as being the same distance apart on the map even though the true distance varies. Though the exact time and distance from one location to another is distorted, these cartograms are still useful for travel and analysis.
Production
Net contributors
One of the first cartographers to generate cartograms with the aid of computer visualization was Waldo Tobler of UC Santa Barbara in the 1960s. Prior to Tobler's work, cartograms were created by hand (as they occasionally still are). The National Center for Geographic Information and Analysis located on the UCSB campus maintains an online Cartogram Central with resources regarding cartograms.
A number of software packages generate cartograms. Most of the available cartogram generation tools work in conjunction with other GIS software tools as add-ons or independently produce cartographic outputs from GIS data formatted to work with commonly used GIS products. Examples of cartogram software include ScapeToad,[10][11] Cart,[12] and the Cartogram Processing Tool (an ArcScript for ESRI's ArcGIS), which all use the Gastner-Newman algorithm.[13][14] An alternative algorithm, Carto3F,[15] is also implemented as an independent program for non-commercial use on Windows platforms.[16] This program also provides an optimization to the original Dougenik rubber-sheet algorithm.[17] [18] The CRAN package recmap provides an implementation of a rectangular cartogram algorithm.[19]
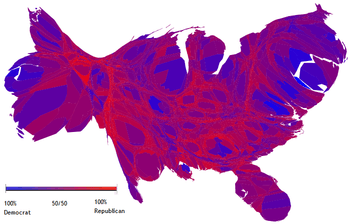
Cartograms can also be constructed manually, either by hand or in a computer-assisted environment. Block cartograms are constructed by arranging geometrically regular equal-sized blocks, with the number of blocks allocated to each district proportional to the population variable. Several examples of block cartograms were published during the 2016 U.S. presidential election season by The Washington Post,[20] the FiveThirtyEight blog,[21] and the Wall Street Journal,[22] among others.
Algorithms
| Year | Author | Algorithm | Type | Shape preservation | Topology preservation |
|---|---|---|---|---|---|
| 1973 | Tobler | Rubber map method | area contiguous | with distortion | Yes, but not guaranteed |
| 1976 | Olson | Projector method | area noncontiguous | yes | No |
| 1978 | Kadmon, Shlomi | Polyfocal projection | distance radial | Unknown | Unknown |
| 1984 | Selvin et al. | DEMP (Radial Expansion) method | area contiguous | with distortion | Unknown |
| 1985 | Dougenik et al. | Rubber Sheet Distortion method [18] | area contiguous | with distortion | Yes, but not guaranteed |
| 1986 | Tobler | Pseudo-Cartogram method | area contiguous | with distortion | Yes |
| 1987 | Snyder | Magnifying glass azimuthal map projections | distance radial | Unknown | Unknown |
| 1989 | Cauvin et al. | Piezopleth maps | area contiguous | with distortion | Unknown |
| 1990 | Torguson | Interactive polygon zipping method | area contiguous | with distortion | Unknown |
| 1990 | Dorling | Cellular Automata Machine method | area contiguous | with distortion | Yes |
| 1993 | Gusein-Zade, Tikunov | Line Integral method | area contiguous | with distortion | Yes |
| 1996 | Dorling | Circular cartogram | area noncontiguous | no (circles) | No |
| 1997 | Sarkar, Brown | Graphical fisheye views | distance radial | Unknown | Unknown |
| 1997 | Edelsbrunner, Waupotitsch | Combinatorial-based approach | area contiguous | with distortion | Unknown |
| 1998 | Kocmoud, House | Constraint-based approach | area contiguous | with distortion | Yes |
| 2001 | Keim, North, Panse | CartoDraw[23] | area contiguous | with distortion | Yes, algorithmically guaranteed |
| 2004 | Gastner, Newman | Diffusion-based method[4] | area contiguous | with distortion | Yes, algorithmically guaranteed |
| 2004 | Sluga | Lastna tehnika za izdelavo anamorfoz | area contiguous | with distortion | Unknown |
| 2004 | van Kreveld, Speckmann | Rectangular Cartogram[24] | area contiguous | no (rectangles) | No |
| 2004 | Heilmann, Keim et al. | RecMap[19] | area noncontiguous | no (rectangles) | No |
| 2005 | Keim, North, Panse | Medial-axis-based cartograms[25] | area contiguous | with distortion | Yes, algorithmically guaranteed |
| 2009 | Heriques, Bação, Lobo | Carto-SOM | area contiguous | with distortion | Yes |
| 2013 | Shipeng Sun | Opti-DCN[17] and Carto3F[15] | area contiguous | with distortion | Yes, algorithmically guaranteed |
| 2014 | B. S. Daya Sagar | Mathematical Morphology-Based Cartograms | area contiguous | with local distortion, but no global distortion | No |
| 2018 | Gastner, Seguy, More | Fast Flow-Based Method[26] | area contiguous | with distortion | Yes, algorithmically guaranteed |
See also
References
- Tobler, Waldo (March 2004). "Thirty-Five Years of Computer Cartograms". Annals of the Association of American Geographers. 94 (1): 58–73. CiteSeerX 10.1.1.551.7290. doi:10.1111/j.1467-8306.2004.09401004.x. JSTOR 3694068.
- Johnson (2008-12-08). "Early cartograms". indiemaps.com/blog. Retrieved 2012-08-17.
- Paull, John & Hennig, Benjamin (2016) Atlas of Organics: Four Maps of the World of Organic Agriculture Journal of Organics. 3(1): 25–32.
- Michael T. Gastner; Mark E. J. Newman (2004). "Diffusion-based method for producing density equalizing maps". Proceedings of the National Academy of Sciences. 101 (20): 7499–7504. arXiv:physics/0401102. Bibcode:2004PNAS..101.7499G. doi:10.1073/pnas.0400280101. PMC 419634. PMID 15136719.
- Gallery of Data Visualization – Bright Ideas
- "UNEP GRID Ardenal: Anamorphic Maps". Archived from the original on 2007-09-29. Retrieved 2007-05-25.
- Johnson (2011-02-22). "Noncontiguous cartograms in OpenLayers and Polymaps". indiemaps.com/blog. Retrieved 2012-08-17.
- Cowan, Sarah; Doyle, Stephen; Heffron, Drew (2008-11-02), "Op-Chart: How Much Is Your Vote Worth?", New York Times, retrieved 2012-08-17
- Worldmapper: Rediscover the world as you've never seen it before
- ScapeToad
- The Art of Software: Cartogram Crash Course
- Cart: Computer software for making cartograms
- Cartogram Geoprocessing Tool
- Hennig, Benjamin D.; Pritchard, John; Ramsden, Mark; Dorling, Danny, "Remapping the World's Population: Visualizing data using cartograms", ArcUser (Winter 2010): 66–69
- Sun, Shipeng (2013), "A Fast, Free-Form Rubber-Sheet Algorithm for Contiguous Area Cartograms", International Journal of Geographical Information Science, 27 (3): 567–93, doi:10.1080/13658816.2012.709247
- Personal Website of Shipeng Sun
- Sun, Shipeng (2013), "An Optimized Rubber-Sheet Algorithm for Continuous Area Cartograms", The Professional Geographer, 16 (1): 16–30, doi:10.1080/00330124.2011.639613
- Dougenik, James A.; Chrisman, Nicholas R.; Niemeyer, Duane R. (1985), "An Algorithm to Construct Continuous Area Cartograms", The Professional Geographer, 37 (1): 75–81, doi:10.1111/j.0033-0124.1985.00075.x
- Heilmann, Roland; Keim, Daniel; Panse, Christian; Sips, Mike (2004). RecMap : Rectangular Map Approximations. Proceedings of the 10th IEEE Symposium on Information Visualization. pp. 33–40. doi:10.1109/INFVIS.2004.57. ISBN 978-0-7803-8779-9.
- "Poll: Redrawing the Electoral Map". Washington Post. Retrieved 4 February 2018.
- "2016 Election Forecast". FiveThirtyEight blog. Retrieved 4 February 2018.
- "Draw the 2016 Electoral College Map". Wall Street Journal. Retrieved 4 February 2018.
- Keim, Daniel; North, Stephen; Panse, Christian (2004). "CartoDraw: a fast algorithm for generating contiguous cartograms". IEEE Trans Vis Comput Graph. 10 (1): 95–110. doi:10.1109/TVCG.2004.1260761. PMID 15382701.
- van Kreveld, Marc; Speckmann, Bettina (2004). On Rectangular Cartograms. In: Albers S., Radzik T. (Eds) Algorithms – ESA 2004. ESA 2004. Lecture Notes in Computer Science. Lecture Notes in Computer Science. 3221. pp. 724–735. doi:10.1007/978-3-540-30140-0_64. ISBN 978-3-540-23025-0.
- Keim, Daniel; Panse, Christian; North, Stephen (2005). "Medial-axis-based cartograms". IEEE Computer Graphics and Applications. 25 (3): 60–68. doi:10.1109/MCG.2005.64. PMID 15943089.
- Michael T. Gastner; Vivien Seguy; Pratyush More (2018). "Fast flow-based algorithm for creating density-equalizing map projections". Proceedings of the National Academy of Sciences. 115 (10): E2156–E2164. arXiv:1802.07625. Bibcode:2018arXiv180207625G. doi:10.1073/pnas.1712674115. PMC 5877977. PMID 29463721.
Further reading
- Campbell, John. Map Use and Analysis. New York: McGraw-Hill, 2001.
- Dorling, Daniel. "Area cartograms: Their use and creation." "Concepts and Techniques in Modern Geography series no. 59." Norwich: University of East Anglia, 1996.
- Gastner, Michael T. and Mark E. J. Newman, "Diffusion-based method for producing density-equalizing maps." Proceedings of the National Academy of Sciences 2004; 101: 7499–7504.
- Gillard, Quentin (1979). "Places in the News: The Use of Cartograms in Introductory Geography Courses". Journal of Geography. 78 (3): 114–115. doi:10.1080/00221347908979963.
- Hennig, Benjamin D. "Rediscovering the World: Map Transformations of Human and Physical Space." Berlin, Heidelberg: Springer, 2013.
- House, Donald H. and Christopher Kocmoud, "Continuous Cartogram Construction." Proceedings of the IEEE Conference on Visualization 1998
- Paull, John & Hennig, Benjamin (2016) Atlas of Organics: Four Maps of the World of Organic Agriculture Journal of Organics. 3(1): 25–32.
- Tobler, Waldo. "Thirty-Five Years of Computer Cartograms." Annals of the Association of American Geographers. 94 (2004): 58–73.
- Vescovo, Victor. "The Atlas of World Statistics." Dallas: Caladan Press, 2005.
External links
| Wikimedia Commons has media related to Cartograms. |
- Cartogram Central
- Worldmapper collection of world cartograms
- Classified Ads on the French Leboncoin social web site and their regional distribution
- Cartograms about Brazil
|