Electoral district of Black
Black is a single-member electoral district for the South Australian House of Assembly. It was created by the redistribution conducted in 2016, and was contested for the first time at the 2018 state election.[3]
| Black South Australia—House of Assembly | |||||||||||||||
|---|---|---|---|---|---|---|---|---|---|---|---|---|---|---|---|
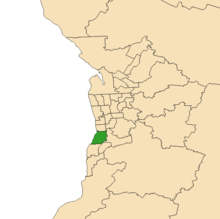 2018 boundaries shown in green in Adelaide region | |||||||||||||||
| State | South Australia | ||||||||||||||
| Created | 2018 | ||||||||||||||
| MP | David Speirs | ||||||||||||||
| Party | Liberal Party of Australia | ||||||||||||||
| Namesake | Dorrit Black | ||||||||||||||
| Electors | 27,870 (2018)[1] | ||||||||||||||
| Area | 35.03 km2 (13.5 sq mi) | ||||||||||||||
| Demographic | Metropolitan | ||||||||||||||
| Coordinates | 35.05°S 138.53°E | ||||||||||||||
| |||||||||||||||
| Footnotes | |||||||||||||||
| Electoral District map[2] | |||||||||||||||
Black is named after Dorrit Black (Dorothea Foster Black, 1891–1951), a South Australian modern artist, best known for linocuts, oil and watercolour paintings.[3]
Black lies south-west of the Adelaide city centre and includes the suburbs of Darlington, Hallett Cove, Kingston Park, Marino, O'Halloran Hill, Seacliff, Seacliff Park, Seacombe Heights, Seaview Downs, Sheidow Park and Trott Park.[4] At its creation, Black was projected to be notionally held by the Liberal Party with a swing of 2.6% required to lose it.[1]:Appendix 12 The 2018 creation of Black replaced the electorate of Mitchell that was disestablished at the 2018 state election.[3] Black does not extend as far north or south as Mitchell did, but extends west to the coast through part of what used to be Bright.
Members for Black
| Member | Party | Term | |
|---|---|---|---|
| David Speirs | Liberal | 2018–present | |
Election results
| Party | Candidate | Votes | % | ± | |
|---|---|---|---|---|---|
| Liberal | David Speirs | 12,538 | 50.6 | +8.2 | |
| Labor | Randall Wilson | 7,870 | 31.7 | −3.7 | |
| Greens | Dami Barnes | 1,702 | 6.9 | −0.8 | |
| Independent | Rob De Jonge | 1,422 | 5.7 | +5.7 | |
| Conservatives | Lionel Zschech | 698 | 2.8 | −1.6 | |
| Dignity | Anastasia Svetlichny | 561 | 2.3 | +2.3 | |
| Total formal votes | 24,791 | 96.1 | −1.3 | ||
| Informal votes | 1,001 | 3.9 | +1.3 | ||
| Turnout | 25,792 | 92.5 | +0.4 | ||
| Two-party-preferred result | |||||
| Liberal | David Speirs | 14,546 | 58.7 | +6.4 | |
| Labor | Randall Wilson | 10,245 | 41.3 | −6.4 | |
| Liberal hold | Swing | +6.4 | |||
Notes
- "Redistribution Report Appendices". 2016. p. Appendix 9. Retrieved 7 July 2017.
- Electoral District of Black (Map). Electoral Commission of South Australia. 2018. Retrieved 1 April 2018.
- "Final Redistribution Report". South Australian Electoral Districts Boundaries Commission. Retrieved 7 July 2017.
- Black (Map). South Australian Electoral Districts Boundaries Commission. 2016. Retrieved 7 July 2017.
- State Election Results - District Results for Black, ECSA.
References
| Politics and elections |
|
|---|---|
| People and culture | |
| Sports competitions | |
| Establishments and developments | |
| Disasters | |
| |