Electoral districts of South Australia
Since 1970, the South Australian House of Assembly (the "lower house") has consisted of 47 single-member electoral districts consisting of approximately the same number of enrolled voters. The district boundaries are regulated by the State Electoral Office, according to the requirements of the South Australian Constitution and are subject to mandatory redistributions by the State Electoral Office in order to respond to changing demographics.
Boundary adjustments
Electoral boundaries are adjusted after each election. The number of electors in each district must be within 10% of the average at the time of the redistribution order. Other issues that may be considered include economic, social and regional communities of interest.[1] From 1990 to 2018, it was also a requirement that each redistribution attempt to ensure that the party that obtains 50% or more of the overall vote at a general election would be able to form a government; this requiremnet has since been repealed.
| Election | 1970 | 1973 | 1975 | 1977 | 1979 | 1982 | 1985 | 1989 | 1993 | 1997 | 2002 | 2006 | 2010 | 2014 | 2018 |
|---|---|---|---|---|---|---|---|---|---|---|---|---|---|---|---|
| Govt | Labor | Labor | Labor | Labor | Liberal | Labor | Labor | Labor | Liberal | Liberal | Labor | Labor | Labor | Labor | Liberal |
| # of seats | 27 | 26 | 23 | 27 | 24 | 24 | 27 | 22 | 37 | 23 | 23 | 28 | 26 | 23 | 25 |
| % of seats | 57.4 | 55.3 | 48.9 | 57.4 | 51.1 | 51.1 | 57.4 | 46.8 | 78.7 | 48.9 | 48.9 | 59.6 | 55.3 | 48.9 | 53.2 |
| % of vote | 53.3 | 54.5 | 49.2 | 53.4 | 55.0 | 50.9 | 53.2 | 48.1 | 61.0 | 51.5 | 49.1 | 56.8 | 48.4 | 47.0 | 51.9 |
While South Australia's total population exceeds 1.7 million, Adelaide's population exceeds 1.3 million − uniquely highly centralised, over 75% of the state's population resides in the metropolitan area and has 72% of seats (34 of 47) alongside a lack of comparatively sized rural population centres, therefore the metropolitan area is crucial in deciding election outcomes. At the 2014 election for example, although the statewide two-party vote (2PP) was 47.0% Labor vs. 53.0% Liberal, the metropolitan area recorded a 2PP of 51.5% Labor v 48.5% Liberal.a
List of the current 47 electoral districts
- Adelaide
- Badcoe
- Black
- Bragg
- Chaffey
- Cheltenham
- Colton
- Croydon
- Davenport
- Dunstan
- Elder
- Elizabeth
- Enfield
- Finniss
- Flinders
- Florey
- Frome
- Gibson
- Giles
- Hammond
- Hartley
- Heysen
- Hurtle Vale
- Kaurna
- Kavel
- King
- Lee
- Light
- MacKillop
- Mawson
- Morialta
- Morphett
- Mount Gambier
- Narungga
- Newland
- Playford
- Port Adelaide
- Ramsay
- Reynell
- Schubert
- Stuart
- Taylor
- Torrens
- Unley
- Waite
- West Torrens
- Wright
Maps
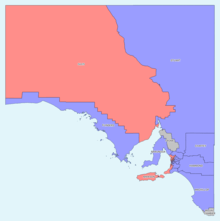 Map of outer rural electoral districts showing results from the 2018 election.
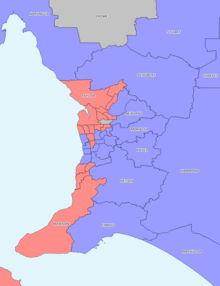 Map of metropolitan and inner rural electoral districts showing results from the 2018 election.
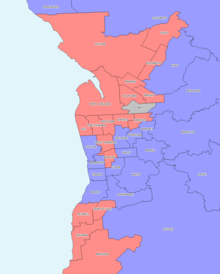 Map of metropolitan electoral districts showing results from the 2018 election.
Numbers of electorates and members
Since 1938, the South Australian House of Assembly has had single-member electoral districts. From 1938 to 1968 there were 39 districts. Since 1970 there have been 47 electoral districts. From 1857 to 1933, the number of districts varied between 12 (1912–1915) and 27 (1890–1901). Each district returned from 1-6 members.
| Parliaments | Years elected | Districts | Members |
|---|---|---|---|
| 1, 2 | 1857, 1860 | 17 | 36 |
| 3, 4, 5, 6, 7 | 1862, 1865, 1868, 1870, 1871 | 18 | 36 |
| 8, 9, 10 | 1875, 1878, 1881 | 22 | 46 |
| 11, 12 | 1884, 1887 | 26 | 52 |
| 13, 14, 15, 16 | 1890, 1893, 1896, 1899 | 27 | 54 |
| 17, 18, 19, 20 | 1902, 1905, 1906, 1910 | 13 | 42 |
| 21 | 1912 | 12 | 40 |
| 22, 23, 24, 25, 26, 27, 28 |
1915, 1918, 1921, 1924, 1927, 1930, 1933 |
19 | 46 |
| 29, 30, 31, 32, 33, 34, 35, 36, 37, 38, 39 |
1938, 1941, 1944, 1947, 1950, 1953, 1956, 1959, 1962, 1965, 1968 |
39 | 39 |
| 40, 41, 42, 43, 44, 45, 46, 47, 48, 49, 50, 51, 52, 53 |
1970, 1973, 1975, 1977, 1979, 1982, 1985, 1989, 1993, 1997, 2002, 2006, 2010, 2014, 2018 |
47 | 47 |
Electoral districts
This table gives the number of members returned by each electoral district at each election.
| 1857 -1862 |
1862 -1875 |
1875 -1884 |
1884 -1890 |
1890 -1902 |
1902 -1912 |
1912 -1915 |
1915 -1938 |
1938 -1956 |
1956 -1970 |
1970 -1985 |
1985 -1993 |
1993 -1997 |
1997 -2002 |
2002 -2014 |
2014 -2018 |
2018 -now | |||
|---|---|---|---|---|---|---|---|---|---|---|---|---|---|---|---|---|---|---|---|
| Districts | 17 | 18 | 22 | 26 | 27 | 13 | 12 | 19 | 39 | 39 | 47 | 47 | 47 | 47 | 47 | 47 | 47 | ||
| Members | 36 | 36 | 46 | 52 | 54 | 42 | 40 | 46 | 39 | 39 | 47 | 47 | 47 | 47 | 47 | 47 | 47 | ||
| District | |||||||||||||||||||
| Adelaide, City of | 6 | ||||||||||||||||||
| Adelaide | 4 | 4 | 3 | 1 | 1 | 1 | 1 | 1 | 1 | 1 | 1 | 1 | |||||||
| Albert | 2 | 2 | 2 | 2 | 1 | 1 | |||||||||||||
| Albert Park | 1 | 1 | |||||||||||||||||
| Alexandra | 4 | 4 | 3 | 1 | 1 | 1 | 1 | ||||||||||||
| Angas | 1 | 1 | |||||||||||||||||
| Ascot Park | 1 | 1 | |||||||||||||||||
| Ashford | 1 | 1 | |||||||||||||||||
| 57-62 | 62-75 | 75-84 | 84-90 | 90-02 | 02-12 | 12-15 | 15-38 | 38-56 | 56-70 | 70-85 | 85-93 | 93-97 | 97-02 | 02-14 | 14-18 | 2018+ | |||
| Badcoe | 1 | ||||||||||||||||||
| Barossa | 2 | 2 | 2 | 2 | 2 | 3 | 3 | 3 | 1 | ||||||||||
| Baudin | 1 | 1 | 1 | ||||||||||||||||
| Black | 1 | ||||||||||||||||||
| Bragg | 1 | 1 | 1 | 1 | 1 | 1 | 1 | ||||||||||||
| Briggs | 1 | ||||||||||||||||||
| Bright | 1 | 1 | 1 | 1 | |||||||||||||||
| Brighton | 1 | ||||||||||||||||||
| The Burra and Clare | 3 | ||||||||||||||||||
| The Burra | 2 | 2 | |||||||||||||||||
| Burra | 2 | 2 | 1 | 1 | |||||||||||||||
| Burra Burra | 3 | 3 | 3 | ||||||||||||||||
| Burnside | 1 | 1 | |||||||||||||||||
| 57-62 | 62-75 | 75-84 | 84-90 | 90-02 | 02-12 | 12-15 | 15-38 | 38-56 | 56-70 | 70-85 | 85-93 | 93-97 | 97-02 | 02-14 | 14-18 | 2018+ | |||
| Chaffey | 1 | 1 | 1 | 1 | 1 | 1 | 1 | 1 | 1 | ||||||||||
| Cheltenham | 1 | 1 | 1 | ||||||||||||||||
| Coles | 1 | 1 | 1 | 1 | |||||||||||||||
| Colton | 1 | 1 | 1 | 1 | 1 | ||||||||||||||
| Croydon | 1 | 1 | 1 | ||||||||||||||||
| Custance | 1 | 1 | |||||||||||||||||
| Davenport | 1 | 1 | 1 | 1 | 1 | 1 | 1 | ||||||||||||
| Dunstan | 1 | 1 | |||||||||||||||||
| East Adelaide | 2 | 2 | 2 | ||||||||||||||||
| East Torrens | 2 | 2 | 2 | 2 | 2 | 3 | |||||||||||||
| Edwardstown | 1 | ||||||||||||||||||
| Elder | 1 | 1 | 1 | 1 | 1 | ||||||||||||||
| Elizabeth | 1 | 1 | 1 | 1 | 1 | 1 | 1 | ||||||||||||
| Encounter Bay | 2 | 2 | 2 | 2 | 2 | ||||||||||||||
| Enfield | 1 | 1 | 1 | 1 | |||||||||||||||
| Eyre | 1 | 1 | 1 | ||||||||||||||||
| 57-62 | 62-75 | 75-84 | 84-90 | 90-02 | 02-12 | 12-15 | 15-38 | 38-56 | 56-70 | 70-85 | 85-93 | 93-97 | 97-02 | 02-14 | 14-18 | 2018+ | |||
| Finniss | 1 | 1 | 1 | 1 | 1 | ||||||||||||||
| Fisher | 1 | 1 | 1 | 1 | 1 | 1 | |||||||||||||
| Flinders | 1 | 2 | 3 | 2 | 2 | 3 | 3 | 2 | 1 | 1 | 1 | 1 | 1 | 1 | 1 | 1 | 1 | ||
| Florey | 1 | 1 | 1 | 1 | 1 | 1 | 1 | ||||||||||||
| Frome | 2 | 2 | 1 | 1 | 1 | 1 | 1 | 1 | 1 | 1 | |||||||||
| Gawler | 1 | 1 | |||||||||||||||||
| Gibson | 1 | ||||||||||||||||||
| Giles | 1 | 1 | 1 | 1 | 1 | ||||||||||||||
| Gilles | 1 | 1 | |||||||||||||||||
| Gladstone | 2 | 2 | |||||||||||||||||
| Glenelg | 1 | 1 | 1 | ||||||||||||||||
| Goodwood | 1 | ||||||||||||||||||
| Gouger | 1 | 1 | 1 | ||||||||||||||||
| Goyder | 1 | 1 | 1 | 1 | 1 | 1 | |||||||||||||
| Gumeracha | 2 | 2 | 2 | 2 | 2 | 1 | 1 | ||||||||||||
| 57-62 | 62-75 | 75-84 | 84-90 | 90-02 | 02-12 | 12-15 | 15-38 | 38-56 | 56-70 | 70-85 | 85-93 | 93-97 | 97-02 | 02-14 | 14-18 | 2018+ | |||
| Hammond | 1 | 1 | 1 | 1 | |||||||||||||||
| Hanson | 1 | 1 | 1 | 1 | |||||||||||||||
| Hart | 1 | 1 | |||||||||||||||||
| Hartley | 1 | 1 | 1 | 1 | 1 | 1 | 1 | ||||||||||||
| Hayward | 1 | ||||||||||||||||||
| Henley Beach | 1 | 1 | |||||||||||||||||
| Heysen | 1 | 1 | 1 | 1 | 1 | 1 | 1 | ||||||||||||
| Hindmarsh | 1 | 1 | |||||||||||||||||
| Hurtle Vale | 1 | ||||||||||||||||||
| Kaurna | 1 | 1 | 1 | 1 | 1 | ||||||||||||||
| Kavel | 1 | 1 | 1 | 1 | 1 | 1 | 1 | ||||||||||||
| King | 1 | ||||||||||||||||||
| Lee | 1 | 1 | 1 | 1 | 1 | ||||||||||||||
| Light | 2 | 2 | 3 | 2 | 2 | 1 | 1 | 1 | 1 | 1 | 1 | 1 | 1 | 1 | |||||
| Little Para | 1 | 1 | |||||||||||||||||
| 57-62 | 62-75 | 75-84 | 84-90 | 90-02 | 02-12 | 12-15 | 15-38 | 38-56 | 56-70 | 70-85 | 85-93 | 93-97 | 97-02 | 02-14 | 14-18 | 2018+ | |||
| MacKillop | 1 | 1 | 1 | 1 | 1 | ||||||||||||||
| Mallee | 1 | ||||||||||||||||||
| Mawson | 1 | 1 | 1 | 1 | 1 | 1 | 1 | ||||||||||||
| Millicent | 1 | 1 | |||||||||||||||||
| Mitcham | 1 | 1 | 1 | ||||||||||||||||
| Mitchell | 1 | 1 | 1 | 1 | 1 | 1 | |||||||||||||
| Morialta | 1 | 1 | 1 | ||||||||||||||||
| Morphett | 1 | 1 | 1 | 1 | 1 | 1 | 1 | ||||||||||||
| Mount Barker | 2 | 2 | 2 | 2 | 2 | ||||||||||||||
| Mount Gambier | 1 | 1 | 1 | 1 | 1 | 1 | 1 | 1 | |||||||||||
| The Murray | 1 | ||||||||||||||||||
| Murray | 3 | 3 | 3 | 1 | 1 | 1 | |||||||||||||
| Murray-Mallee | 1 | ||||||||||||||||||
| 57-62 | 62-75 | 75-84 | 84-90 | 90-02 | 02-12 | 12-15 | 15-38 | 38-56 | 56-70 | 70-85 | 85-93 | 93-97 | 97-02 | 02-14 | 14-18 | 2018+ | |||
| Napier | 1 | 1 | 1 | 1 | 1 | 1 | |||||||||||||
| Narungga | 1 | ||||||||||||||||||
| Newcastle | 2 | 2 | 2 | 1 | 1 | ||||||||||||||
| Newland | 1 | 1 | 1 | 1 | 1 | 1 | 1 | ||||||||||||
| Noarlunga | 2 | 2 | 2 | 2 | 2 | ||||||||||||||
| North Adelaide | 1 | 2 | 2 | 2 | |||||||||||||||
| Northern Territory | 2 | 2 | |||||||||||||||||
| Norwood | 1 | 1 | 1 | 1 | 1 | 1 | 1 | ||||||||||||
| Onkaparinga | 2 | 2 | 2 | 2 | 2 | 1 | 1 | ||||||||||||
| Peake | 1 | 1 | 1 | 1 | |||||||||||||||
| Pirie | 1 | ||||||||||||||||||
| Playford | 1 | 1 | 1 | 1 | 1 | 1 | 1 | ||||||||||||
| Port Adelaide | 2 | 2 | 2 | 2 | 2 | 3 | 3 | 2 | 1 | 1 | 1 | 1 | 1 | ||||||
| Port Pirie | 2 | 1 | 1 | ||||||||||||||||
| Price | 1 | 1 | 1 | ||||||||||||||||
| Prospect | 1 | ||||||||||||||||||
| 57-62 | 62-75 | 75-84 | 84-90 | 90-02 | 02-12 | 12-15 | 15-38 | 38-56 | 56-70 | 70-85 | 85-93 | 93-97 | 97-02 | 02-14 | 14-18 | 2018+ | |||
| Ramsay | 1 | 1 | 1 | 1 | 1 | 1 | |||||||||||||
| Reynell | 1 | 1 | 1 | 1 | 1 | ||||||||||||||
| Ridley | 1 | 1 | 1 | ||||||||||||||||
| Rocky River | 1 | 1 | 1 | ||||||||||||||||
| Ross Smith | 1 | 1 | 1 | 1 | |||||||||||||||
| Salisbury | 1 | ||||||||||||||||||
| Semaphore | 1 | 1 | 1 | 1 | |||||||||||||||
| Schubert | 1 | 1 | 1 | 1 | |||||||||||||||
| Spence | 1 | 1 | 1 | 1 | |||||||||||||||
| Stanley | 2 | 2 | 2 | 3 | 3 | 2 | 1 | ||||||||||||
| Stirling | 1 | 1 | |||||||||||||||||
| Stuart | 1 | 1 | 1 | 1 | 1 | 1 | 1 | 1 | |||||||||||
| Sturt, The | 2 | 2 | |||||||||||||||||
| Sturt | 2 | 2 | 2 | 3 | |||||||||||||||
| Taylor | 1 | 1 | 1 | 1 | 1 | ||||||||||||||
| Tea Tree Gully | 1 | ||||||||||||||||||
| Thebarton | 1 | ||||||||||||||||||
| Todd | 1 | 1 | |||||||||||||||||
| Torrens | 5 | 5 | 1 | 1 | 1 | 1 | 1 | 1 | 1 | 1 | |||||||||
| 57-62 | 62-75 | 75-84 | 84-90 | 90-02 | 02-12 | 12-15 | 15-38 | 38-56 | 56-70 | 70-85 | 85-93 | 93-97 | 97-02 | 02-14 | 14-18 | 2018+ | |||
| Unley | 1 | 1 | 1 | 1 | 1 | 1 | 1 | 1 | 1 | ||||||||||
| Victoria | 1 | 2 | 2 | 2 | 2 | 2 | 1 | 1 | 1 | 1 | |||||||||
| Victoria and Albert | 3 | 3 | |||||||||||||||||
| Waite | 1 | 1 | 1 | 1 | 1 | ||||||||||||||
| Wallaroo | 3 | 2 | 2 | 3 | 3 | 2 | 1 | 1 | |||||||||||
| Walsh | 1 | ||||||||||||||||||
| West Adelaide | 2 | 2 | 2 | 2 | |||||||||||||||
| West Torrens | 2 | 2 | 2 | 2 | 2 | 2 | 1 | 1 | 1 | 1 | |||||||||
| Whyalla | 1 | 1 | 1 | ||||||||||||||||
| Wooroora | 2 | 2 | 2 | 3 | 3 | 3 | |||||||||||||
| Wright | 1 | 1 | 1 | 1 | 1 | ||||||||||||||
| Yatala | 2 | 2 | 2 | 2 | 2 | ||||||||||||||
| Yorke Peninsula | 2 | 1 | 1 | ||||||||||||||||
| Young | 1 | ||||||||||||||||||
| 1857 -1862 |
1862 -1875 |
1875 -1884 |
1884 -1890 |
1890 -1902 |
1902 -1912 |
1912 -1915 |
1915 -1938 |
1938 -1956 |
1956 -1970 |
1970 -1985 |
1985 -1993 |
1993 -1997 |
1997 -2002 |
2002 -2014 |
2014 -2018 |
2018 -now | |||
Abolished electoral districts
These electoral districts no longer exist:
- Albert
- Albert Park
- Alexandra
- Angas
- Ashford
- Ascot Park
- Barossa
- Baudin
- Briggs
- Bright
- Brighton
- Burnside
- Burra
- Burra Burra
- City of Adelaide
- Coles
- Custance
- East Adelaide
- East Torrens
- Edwardstown
- Encounter Bay
- Eyre
- Fisher
- Gawler
- Gilles
- Gladstone
- Glenelg
- Goodwood
- Gordon
- Gouger
- Goyder
- Gumeracha
- Hanson
- Hart
- Hayward
- Henley Beach
- Hindmarsh
- Little Para
- Mallee
- Millicent
- Mitcham
- Mitchell
- Mount Barker
- Murray
- Murray-Mallee
- Napier
- Newcastle
- Noarlunga
- North Adelaide
- Northern Territory
- Norwood
- Onkaparinga
- Peake
- Pirie
- Port Pirie
- Price
- Prospect
- Ridley
- Rocky River
- Ross Smith
- Salisbury
- Semaphore
- Spence
- Stanley
- Stirling
- Sturt
- Tea Tree Gully
- The Burra
- The Burra and Clare
- The Murray
- Thebarton
- Todd
- Victoria
- Victoria and Albert
- Wallaroo
- Walsh
- West Adelaide
- Whyalla
- Wooroora
- Yatala
- Yorke Peninsula
- Young
See also
- Members of the South Australian House of Assembly
Notes
^a Metropolitan 2PP correctly calculated by adding raw metro 2PP vote numbers from the 34 metro seats, both Labor and Liberal, then dividing Labor's raw metro 2PP vote from the total, which revealed a Labor metropolitan 2PP of 51.54%.[2][3][4]
References
- "Electoral Questions & Answers" (PDF). State Electoral Office, South Australia. Archived from the original (PDF, page 11) on 2006-08-21. Retrieved 2006-11-08.
- "2014 election statistics". Electoral Commission of South Australia. Government of South Australia. 2014. Archived from the original on 2016-03-07.
- "2014 Heysen election". Electoral Commission of South Australia. Government of South Australia. 2014. Archived from the original on 2014-12-11.
- "2014 Fisher by-election". ABC News. Australia. 2014.
External links
- State Electoral Office
- Maps of South Australian Electoral Districts
- Statistical Record of the Legislature 1836–2007, Parliament of SA, www.parliament.sa.gov.au
- Former Members of the Parliament of South Australia
