East Orosi, California
East Orosi is a census-designated place (CDP) in Tulare County, California, United States. The population was 495 at the 2010 census, up from 426 in 2000.
East Orosi | |
|---|---|
 Location in Tulare County and the state of California | |
 East Orosi Location in the United States | |
| Coordinates: 36°32′51″N 119°15′40″W | |
| Country | |
| State | |
| County | Tulare |
| Area | |
| • Total | 0.248 sq mi (0.642 km2) |
| • Land | 0.248 sq mi (0.642 km2) |
| • Water | 0 sq mi (0 km2) 0% |
| Elevation | 394 ft (120 m) |
| Population (2010) | |
| • Total | 495 |
| • Density | 2,000/sq mi (770/km2) |
| Time zone | UTC-8 (Pacific (PST)) |
| • Summer (DST) | UTC-7 (PDT) |
| ZIP code | 93647 |
| Area code(s) | 559 |
| FIPS code | 06-20942 |
| GNIS feature ID | 1658460 |
Geography
East Orosi is located at 36°32′51″N 119°15′40″W (36.547572, -119.261243).[2]
According to the United States Census Bureau, the CDP has a total area of 0.2 square miles (0.52 km2), all land.
Demographics
| Historical population | |||
|---|---|---|---|
| Census | Pop. | %± | |
| U.S. Decennial Census[3] | |||
2010
At the 2010 census East Orosi had a population of 495. The population density was 1,996.2 people per square mile (770.7/km²). The racial makeup of East Orosi was 209 (42.2%) White, 0 (0.0%) African American, 5 (1.0%) Native American, 2 (0.4%) Asian, 1 (0.2%) Pacific Islander, 261 (52.7%) from other races, and 17 (3.4%) from two or more races. Hispanic or Latino of any race were 466 people (94.1%).[4]
The whole population lived in households, no one lived in non-institutionalized group quarters and no one was institutionalized.
There were 112 households, 73 (65.2%) had children under the age of 18 living in them, 57 (50.9%) were opposite-sex married couples living together, 19 (17.0%) had a female householder with no husband present, 17 (15.2%) had a male householder with no wife present. There were 16 (14.3%) unmarried opposite-sex partnerships, and 0 (0%) same-sex married couples or partnerships. 11 households (9.8%) were one person and 3 (2.7%) had someone living alone who was 65 or older. The average household size was 4.42. There were 93 families (83.0% of households); the average family size was 4.73.
The age distribution was 181 people (36.6%) under the age of 18, 72 people (14.5%) aged 18 to 24, 137 people (27.7%) aged 25 to 44, 74 people (14.9%) aged 45 to 64, and 31 people (6.3%) who were 65 or older. The median age was 24.2 years. For every 100 females, there were 126.0 males. For every 100 females age 18 and over, there were 130.9 males.
There were 116 housing units at an average density of 467.8 per square mile, of the occupied units 46 (41.1%) were owner-occupied and 66 (58.9%) were rented.The homeowner vacancy rate was 2.1%; the rental vacancy rate was 1.5%. 192 people (38.8% of the population) lived in owner-occupied housing units and 303 people (61.2%) lived in rental housing units.
2000
At the 2000 census there were 426 people, 102 households, and 89 families in the CDP. The population density was 1,719.3 people per square mile (657.9/km²). There were 105 housing units at an average density of 423.8 per square mile (162.2/km²). The racial makeup of the CDP was 49.06% White, 0.47% Native American, 2.82% Asian, 43.43% from other races, and 4.23% from two or more races. Hispanic or Latino of any race were 86.62%.[5]
Of the 102 households 56.9% had children under the age of 18 living with them, 53.9% were married couples living together, 23.5% had a female householder with no husband present, and 12.7% were non-families. 9.8% of households were one person and 2.9% were one person aged 65 or older. The average household size was 4.18 and the average family size was 4.33.
The age distribution was 38.7% under the age of 18, 12.9% from 18 to 24, 30.3% from 25 to 44, 11.7% from 45 to 64, and 6.3% 65 or older. The median age was 24 years. For every 100 females, there were 102.9 males. For every 100 females age 18 and over, there were 103.9 males.
The median household income was $26,071 and the median family income was $27,738. Males had a median income of $26,902 versus $9,500 for females. The per capita income for the CDP was $4,984. About 37.1% of families and 51.4% of the population were below the poverty line, including 65.7% of those under age 18 and none of those age 65 or over.
Government
In the California State Legislature, East Orosi is in the 14th Senate District, represented by Democrat Melissa Hurtado, and the 26th Assembly District, represented by Republican Devon Mathis.[6]
In the United States House of Representatives, East Orosi is in California's 22nd congressional district, represented by Republican Devin Nunes[7]
References
- "2010 Census U.S. Gazetteer Files – Places – California". United States Census Bureau.
- "US Gazetteer files: 2010, 2000, and 1990". United States Census Bureau. 2011-02-12. Retrieved 2011-04-23.
- "Census of Population and Housing". Census.gov. Retrieved June 4, 2016.
- "2010 Census Interactive Population Search: CA - East Orosi CDP". U.S. Census Bureau. Archived from the original on July 15, 2014. Retrieved July 12, 2014.
- "U.S. Census website". United States Census Bureau. Retrieved 2008-01-31.
- "Statewide Database". Regents of the University of California. Retrieved March 30, 2015.
- "California's 22nd Congressional District - Representatives & District Map". Civic Impulse, LLC. Retrieved October 6, 2014.
Municipalities and communities of Tulare County, California, United States | ||
|---|---|---|
| Cities | 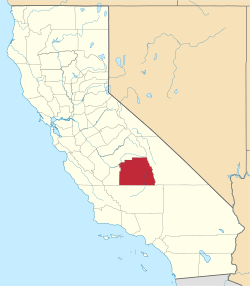 Tulare County map | |
| CDPs |
| |
| Unincorporated communities | ||
| Ghost towns |
| |
| Indian reservation | ||