Dindigul district
Dindigul district is an administrative region in the southwest of Tamil Nadu, India. Dindigul District is the biggest District in Tamil Nadu by Area. The district was carved out of Madurai District in 1985. It has an area of 6266.64 km2 and comprises three Revenue Divisions, ten Taluks, and 14 Panchayat Unions. The district is bound by Tirupur, Karur, and Trichy districts in the north, the Sivaganga and Tiruchi districts in the east, the Madurai district in the south, and the Theni district and the state of Kerala in the west. As of 2011, the district had a population of 2,159,775 with a sex-ratio of 998 females for every 1,000 males.
Dindigul city Ezhilmigu City, Lock City | |
|---|---|
District | |
 | |
| Nickname(s): ezhilMighu Dindigul | |
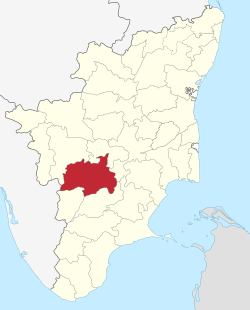 Location in Tamil Nadu, India | |
| Coordinates: 10°21′14.4″N 77°59′6″E | |
| Country | |
| State | |
| Municipal Corporations | Dindigul |
| Founded by | M.G.Ramachandran |
| Headquarters | Dindigul |
| Taluks | Attur, Dindigul East, Dindigul West, Gujiliamparai, Kodaikanal, Natham, Nilakkottai, Oddanchatram, Palani, Vedasandur |
| Government | |
| • District Collector | Tmt.M.Vijayalakshmi IAS, IAS[1] |
| • Superintendent of Police | R.Sakthivel, IPS[2] |
| Population (2011) | |
| • Total | 2,159,775 |
| Languages | |
| • Official | Tamil |
| Time zone | UTC+5:30 (IST) |
| PIN | 624xxx |
| Telephone code | 0451 |
| ISO 3166 code | ISO 3166-2:IN |
| Vehicle registration | TN-57,94[3] |
| Largest city | Dindigul |
| Central location: | 10°21′N 77°59′E |
| Website | dindigul |
Economy
In 2006, the Ministry of Panchayati Raj named Dindigul one of the country's 250 most backward districts (out of a total of 640).[4] It is one of the six districts in Tamil Nadu currently receiving funds from Backward Regions Grant Fund Programme (BRGF).[4]
Demographics
According to 2011 census, Dindigul district had a population of 2,159,775 with a sex-ratio of 998 females for every 1,000 males, much above the national average of 929.[5] A total of 216,576 were under the age of six, constituting 111,955 males and 104,621 females. Scheduled Castes and Scheduled Tribes accounted for 20.95% and 0.37% of the population respectively. The average literacy of the district was 68.61%, compared to the national average of 72.99%.[5] The district had a total of 560,773 households. There were a total of 1,105,155 workers, comprising 155,332 cultivators, 388,725 main agricultural labourers, 25,253 in house hold industries, 393,707 other workers, 142,138 marginal workers, 10,073 marginal cultivators, 79,234 marginal agricultural labourers, 5,576 marginal workers in household industries and 47,255 other marginal workers.[6]
| Historical population | ||
|---|---|---|
| Year | Pop. | ±% p.a. |
| 1901 | 714,098 | — |
| 1911 | 780,440 | +0.89% |
| 1921 | 813,581 | +0.42% |
| 1931 | 859,809 | +0.55% |
| 1941 | 974,794 | +1.26% |
| 1951 | 1,083,964 | +1.07% |
| 1961 | 1,178,363 | +0.84% |
| 1971 | 1,398,023 | +1.72% |
| 1981 | 1,564,448 | +1.13% |
| 1991 | 1,760,601 | +1.19% |
| 2001 | 1,923,014 | +0.89% |
| 2011 | 2,159,775 | +1.17% |
| source:[7] | ||
Places of interest
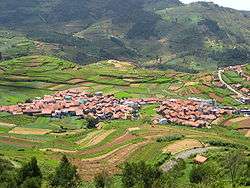
- Kodaikanal
- Palani
- Sirumalai
- Dindigul Fort
- Pachalur hills Oddanchatram
- Thalakuthu water falls
- Athoor Dam
See also
- Dharmathupatty.K, Dindigul
- Pithalai patty
References
- District Collector
- Superintendent of Police
- www.tn.gov.in
- Ministry of Panchayati Raj (8 September 2009). "A Note on the Backward Regions Grant Fund Programme" (PDF). National Institute of Rural Development. Archived from the original (PDF) on 5 April 2012. Retrieved 27 September 2011.
- "Census Info 2011 Final population totals". Office of The Registrar General and Census Commissioner, Ministry of Home Affairs, Government of India. 2013. Retrieved 26 January 2014.
- "Census Info 2011 Final population totals - Dindigul district". Office of The Registrar General and Census Commissioner, Ministry of Home Affairs, Government of India. 2013. Retrieved 26 January 2014.
- Decadal Variation In Population Since 1901
External links
| Wikimedia Commons has media related to Dindigul district. |
| State symbols |
| |
|---|---|---|
| Governance |
| |
| Topics | ||
| Major cities | ||
| Districts |
| |
| Lists | ||