Demographics of Crimea
As of 2014, the total population of the Republic of Crimea and Sevastopol was at 2,248,400 people (Republic of Crimea: 1,889,485, Sevastopol: 395,000).[1] This is down from the 2001 Ukrainian Census figure, which was 2,376,000 (Autonomous Republic of Crimea: 2,033,700, Sevastopol: 342,451).[2]
History
The Crimean interior has been ethnically diverse throughout its recorded history, changing hands numerous times, while the south coast was held continuously for most of the last two millennia by various Roman (and Eastern Roman) states. The interior was dominated by a succession of Scytho-Sarmatian, Gothic, Hunnic, Turkic, Mongol and Slavic conquests. Its south coast was Greek speaking first as Greek colonies (7th or 6th century BC and following), then under the Bosporan Kingdom (480 BC - 63 BC), Romans (47 BC -330 AD) and their successor states, the Byzantine Empire (330 AD - 1204 AD), the Empire of Trebizond (1204 AD - 1461 AD), and the independent Principality of Theodoro (1461 AD - 1475 AD). In 1475 the region was conquered by the Ottoman Turks. During the late Middle Ages a few coastal cities were ruled by Italian city states.
The Crimean Tatars emerged as a Turkic-speaking ethnic group native to Crimea in the early modern period, during the lifetime of the Crimean Khanate, and by the annexation of the Crimean Khanate by the Russian Empire in 1783, they formed the clear majority of Crimean population. The colonization "New Russia" (the Novorossiysk Governorate, of which the later Taurida Governorate formed a part) at the end of the 18th century was led by Prince Grigori Potemkin who was granted the powers of an absolute ruler over the area by Catherine the Great. The lands were generously given to the Russian dvoryanstvo (nobility), and the enserfed peasantry mostly from Ukraine and fewer from Russia were transferred to cultivate what was a sparsely populated steppe. Catherine the Great also invited European settlers to these newly conquered lands: Germans, Poles, Italians, and others. Crimea is geographically and demographically divided into three regions, the steppe interior, the mountains, and the coast. The Tatars were the predominant portion of the population in the mountainous area and about half of the steppe population, while Russians were concentrated most heavily in the Feodosiya district. Germans and Bulgarians settled in the Crimea at the beginning of the 19th century, receiving a large allotment and fertile land. Wealthy colonists later bought substantial portions of land, mainly in Perekopsky and Yevpatoria districts.
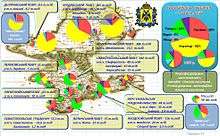
By the 1897 Russian Empire Census, Crimean Tatars continued to form a slight plurality (35%) of Crimea's still largely rural population, but there were large numbers of Russians (33%) and Ukrainians (11%), as well as smaller numbers of Germans, Jews (including Krymchaks and Crimean Karaites), Bulgarians, Belarusians, Turks, Armenians, and Greeks and Roma (gypsies).
The upheavals and ethnic cleansing of the 20th century vastly changed Crimea's ethnic situation. In 1944, 200,000 Crimean Tatars were deported from Crimea to Central Asia and Siberia, along with 70,000 Greeks and 14,000 Bulgarians and other nationalities.[3][4] By the latter 20th century, Russians and Ukrainians made up almost the entire population. However, with the fall of the Soviet Union, exiled Crimean Tatars began returning to their homeland and accounted for 10% of the population by the beginning of the 21st century.
Ethnicities and languages
According to the (2001 census), the ethnic makeup of Crimea's population consisted of the following self-reported groups: Russians:1.45 million (60.4%), Ukrainians: 577,000 (24.0%), Crimean Tatars: 245,000 (10.2%), Belarusians: 35,000 (1.4%), other Tatars: 13,500 (0.5%), Armenians: 10,000 (0.4%), and Jews: 5,500 (0.2%).[5]
| Ethnic group |
1897 census [6][7] | 1926 census [8] | 1939 census [9] | 1959 census | 1970 census | 1979 census [10] | 1989 census [11] | 2001 census1 | 2014 census2[12][13][14][15] | |||||||||
|---|---|---|---|---|---|---|---|---|---|---|---|---|---|---|---|---|---|---|
| Number | % | Number | % | Number | % | Number | % | Number | % | Number | % | Number | % | Number | % | Number | % | |
| Russians | 180,963 | 33.11% | 301,398 | 42.2% | 558,481 | 49.6% | 858,273 | 71.4% | 1,220,484 | 67.3% | 1,460,980 | 66.9% | 1,629,542 | 67.0% | 1,450,400 | 60.4% | 1,492,078 | 67.9% |
| Ukrainians | 64,703 | 11.84% | 77,405 | 10.6% | 154,123 | 13.7% | 267,659 | 22.3% | 480,733 | 26.5% | 547,336 | 25.1% | 625,919 | 25.8% | 576,600 | 24.0% | 344,515 | 15.7% |
| Crimean Tatars (+ Tatars) | 194,294 | 35.55% | 179,094 | 25.1% | 218,879 | 19.4% | 5,422 | 0.2% | 38,365 | 1.6% | 258,700 | 10.8% | 277,336 | 12.6% | ||||
| Belarusians | 2,058 | 0.38% | 3,842 | 0.5% | 6,726 | 0.6% | 21,672 | 1.8% | 39,793 | 2.2% | 45,000 (e) | 2.1% | 50,045 | 2.1% | 35,000 | 1.5% | 21,694 | 1.0% |
| Armenians | 8,317 | 1.52% | 10,713 | 1.5% | 12,923 | 1.1% | 3,091 | 0.2% | 2,794 | 0.1% | 10,000 | 0.4% | 11,030 | 0.5% | ||||
| Jews | 24,168 | 4.42% | 45,926 | 6.4% | 65,452 | 5.8% | 26,374 | 2.2% | 25,614 | 1.4% | 17,371 | 0.7% | 5,500 | 0.2% | 3,144 | 0.1% | ||
| Others | 72,089 | 13.19% | ||||||||||||||||
| Total population | 546,592 | 713,823 | 1,126,429 | 1,201,517 | 1,813,502 | 2,184,000 | 2,430,495 | 2,401,200 | 2,284,769 | |||||||||
| 1. For comparison with prior censuses the results of the Autonomous Republic of Crimea and Sevastopol were combined
2. The 2014 percentage is based on total number responding to the question on nationality (not total population). Census breakdown is Crimean Tatars 232,340 (10.6%), Tatars 44,996 (2.1%). | ||||||||||||||||||

Other minorities are Black Sea Germans, Roma, Bulgarians, Poles, Azerbaijanis, Koreans, Greeks and Italians. The number of Crimea Germans was 45,000 in 1941.[16] In 1944, 70,000 Greeks and 14,000 Bulgarians from the Crimea were deported to Central Asia and Siberia,[3] along with 200,000 Crimean Tatars and other nationalities.[4]
According to the 2001 census, 77% of Crimean inhabitants named Russian as their native language, 11.4% – Crimean Tatar, and 10.1% – Ukrainian.[17] Of the Ukrainians in Crimea, 40% gave Ukrainian as their native language, with 60% identifying as ethnic Ukrainians while giving Russian as their primary language. 93% of Crimean Tatars gave Crimean Tatar as their native language, 6% were Russophone.[18] In 2013, however, the Crimean Tatar language was estimated to be on the brink of extinction, being taught in Crimea only in around 15 schools at that point of time. Turkey has provided the greatest support to Ukraine, which has been unable to resolve the problem of education in the mother tongue in Crimea, by bringing the schools to a modern state.[19] Ukrainian was until 2014 the single official state language countrywide, but in Crimea government business was carried out mainly in Russian. Attempts to expand the usage of Ukrainian in education and government affairs have been less successful in Crimea than in other areas of the nation.[20]
Currently two thirds of migrants into Crimea are from other regions of Ukraine; every fifth migrant is from elsewhere in the former Soviet Union and every 40th from outside of it. Three quarters of those leaving Crimea move to other areas in Ukraine. Every 20th migrates to the West.[17]
The number of Crimean residents who consider Ukraine their motherland increased sharply from 32% to 71.3% from 2008 through 2011; according to a poll by Razumkov Center in March 2011,[21] although this is the lowest number in all Ukraine (93% on average across the country).[21] Surveys of regional identities in Ukraine have shown that around 30% of Crimean residents claim to have retained a self-identified "Soviet identity".[22]
Since the independence of Ukraine in 1991, 3.8 million former citizens of Russia have applied for Ukrainian citizenship.[23]
In 2014 after Russian annexation of Crimea new authorities conducted a census. According to the census result the population of the Crimean Federal District is 2.2844 million people. The ethnic composition is as follows: Russians: 1.49 million (65.3%), Ukrainians: 0.35 million (15.1%), Crimean Tatars: 0.24 million (12.0%).[15][24] Official Ukrainian authorities and Mejlis of the Crimean Tatar People claimed doubts that the results of population census in Crimea represent the facts.[25]
A survey in May 2013, asked respondents what language they spoke at home:[26]
- 82% Russian
- 10% Crimean Tatar
- 3% Russian and Ukrainian equally
- 3% Russian and another language equally
- 2% Ukrainian
Note that the proportion of people in the survey who gave their ethnicity as Ukrainian was 20%, Crimean Tatar 15%.[26]
Birth rate, Death rate and Total fertility rate
- Vital statistics for 2015
- Births: 29 422 (12.8 per 1000)[27]
- Deaths: 35 151 (15.3 per 1000)
- Fertility rate
| [28] | 2014 | 2015 | ||
|---|---|---|---|---|
| Republic of Crimea | 1.82 | 1.82 | ||
| Sevastopol | 1.65 | 1.82 | ||
| Crimean Federal District | 1.79 | 1.82 |
Education
The 2001 Ukrainian census for the Autonomous Republic of Crimea cites the following figures for the population of "able-to-work age" (men 16–59 years, women 16–54 years):[29]
- total population 1,203,789
- completed higher education: 175,838 (14.6%)
- higher education (partial or complete): 476,793 (39.6%)
- completed secondary education: 507,881 (49.7%)
- secondary education (partial or complete): 685,855 (57.0%)
- no primary education: 1,945 (0.16%)
- illiterate: 1,413 (0.11%)
Religion
The Crimean peninsula was Christianised at an early time, via Gothic Christianity, in the 4th century. In the 9th century, the Goths in Crimea turned to the Greek Orthodox Church, under the Metropolitanate of Gothia. In 988, Prince Vladimir I of Kiev also captured the Byzantine town of Chersonesos (presently part of Sevastopol) where he later converted to Christianity. Christianity was mostly swept away by the Mongol invasion of Rus' in the 1230s. Islam becomes the state religion of the Golden Horde in the early 14th century. The first mosque in Crimea was built by Ozbeg Khan in Eski Qırım in 1314. Christianity returned with the annexation of the Crimean Khanate by the Eastern Orthodox Russian Empire in 1783.
A survey of residents of the Autonomous Republic of Crimea in May 2013 found that:[26]
- 58% Orthodox
- 15% Muslim
- 13% Do not know, or not applicable
- 10% believed in God but did not belong to any religion
- 2% Atheist
- 2% Other
The proportion of the population in the survey who were Crimean Tatar was 15%.[26]
Respondents to the same survey said that they attended a religious service:[26]
- 3% Several times a week
- 7% Weekly
- 10% Monthly
- 37% Several times a year
- 43% Never
References
- "Archived copy". Archived from the original on 2015-11-04. Retrieved 2016-02-13.CS1 maint: archived copy as title (link)
- "Regions of Ukraine / Autonomous Republic of Crimea". 2001 Ukrainian Census. Retrieved December 16, 2006.
- "The Persecution of Pontic Greeks in the Soviet Union" (PDF)
- "Crimean Tatars Divide Ukraine and Russia". The Jamestown Foundation. June 24, 2009.
- This combines the figures for the Autonomous Republic of Crimea and Sevastopol, listing groups of more than 5,000 individuals. "Autonomous Republic of Crimea". 2001 Ukrainian Census. Retrieved 20 August 2018.; "Sevastopol". 2001 Ukrainian Census. Retrieved 20 August 2018.
- These numbers exclude the population numbers for Berdyansky, Dneprovsky and Melitopolsky Uyezds, which were on mainland. See the administrative divisions of the Taurida Governorate
- "The First General Census of the Russian Empire of 1897 - Taurida Governorate". demoscope.ru. Демоскоп. Retrieved 18 June 2014.
Taurida Governate Berdyansk District Dneiper District Melitopol District Crimea Russians 404,463 55,303 42,180 126,017 180,963 Ukrainians 611,121 179,177 156,151 211,090 64,703 Tatars 196,854 770 506 1,284 194,294 Belarusians 9,726 1,323 3,005 3,340 2,058 Armenians 8,938 201 47 373 8,317 Jews 55,418 8,889 6,298 16,063 24,168 Other 161,270 59,055 4,054 26,072 72,089 Total Population 1,447,790 304,718 212,241 384,239 546,592 - "Демоскоп Weekly - Приложение. Справочник статистических показателей". Demoscope.ru. Retrieved 2018-07-03.
- "Демоскоп Weekly - Приложение. Справочник статистических показателей". Demoscope.ru. Retrieved 2018-07-03.
- Crimea - Dynamics, challenges and prospects / edited by Maria Drohobycky. Page 73
- Crimea - Dynamics, challenges and prospects / edited by Maria Drohobycky. Page 72
- Итоги переписи населения в крымском федеральном округе [Results of the population census in the Crimean Federal District] (PDF). Moscow: Federal State Statistics Service of Russia. 2015. p. 108. ISBN 978-5-4269-0054-7.
- "Archived copy". Archived from the original on 2015-04-20. Retrieved 2016-01-07.CS1 maint: archived copy as title (link)
- "Катастрофический фактор | Все блоги | Блоги | Каспаров.Ru". Kasparov.ru. Retrieved 2018-07-03.
- "Archived copy". Archived from the original on 2015-04-27. Retrieved 2015-04-20.CS1 maint: archived copy as title (link)
- "A People on the Move: Germans in Russia and in the Former Soviet Union: 1763 – 1997". North Dakota State University Libraries.
- "Results / General results of the census / Linguistic composition of the population / Autonomous Republic of Crimea". 2001 Ukrainian Census. Archived from the original on February 27, 2008. Retrieved December 16, 2006.
- Linguistic composition of population Autonomous Republic of Crimea. 2001 Ukrainian census
- Crimean Tatar language in danger, Avrupa Times, 02/19/2013
- Bondaruk, Halyna (March 3, 2007). "Yushchenko Appeals to Crimean Authority Not to Speculate on Language". Ukrayinska Pravda. Archived from the original on September 14, 2007. Retrieved March 25, 2007.
- Poll: Most Crimean residents consider Ukraine their motherland, Kyiv Post (11 April 2011)
- Soviet conspiracy theories and political culture in Ukraine:Understanding Viktor Yanukovych and the Party of Region Archived 2014-05-16 at the Wayback Machine by Taras Kuzio (23 August 2011)
- "Ukrinform News". Ukrinform.ua. Retrieved 2018-07-03.
- "Crimea to Hold First Census Since Russian Annexation". Themoscowtimes.com. Retrieved 2018-07-03.
- "Mejlis doubts preliminary results of Crimean census | Crimean News Agency". Qha.com.ua. 2015-03-24. Retrieved 2018-07-03.
- "Public Opinion Survey Residents of the Autonomous Republic of Crimea May 16 – 30, 2013", Baltic Surveys Ltd. and The Gallup Organization, pp. 37, 39, 2013
- "Естественное движение населения в разрезе субъектов Российской Федерации". Gks.ru. 2016-01-29. Retrieved 2018-07-03.
- http://www.gks.ru/dbscripts/cbsd/dbinet.cgi?pl=2415002
- distribution of population by age and educational standard 2001.ukrcensus.gov.ua
Crimea articles | |||||||||||||
|---|---|---|---|---|---|---|---|---|---|---|---|---|---|
| History |
|  | |||||||||||
| Geography |
| ||||||||||||
| Politics | |||||||||||||
| Economy |
| ||||||||||||
| Society |
| ||||||||||||
| |||||||||||||