Circle diagram
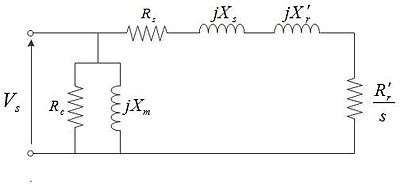
First conceived by A. Heyland in 1894 and B.A. Behrend in 1895, the circle diagram is the graphical representation of the performance of the electrical machine[1][2][3] drawn in terms of the locus of the machine's input voltage and current.[4] The circle diagram can be drawn for alternators, synchronous motors, transformers, induction motors. The Heyland diagram is an approximate representation of circle diagram applied to induction motors, which assumes that stator input voltage, rotor resistance and rotor reactance are constant and stator resistance and core loss are zero.[3][5][6] Another common circle diagram form is as described in the two constant air-gap induction motor images shown here,[7][8] where,
- Rs, Xs: Stator resistance and leakage reactance
- Rr', Xr', s: Rotor resistance and leakage reactance referred to the stator and rotor slip
- Rc, Xm, : Core and mechanical losses, magnetization reactance
- Vs, Impressed stator voltage
- I0 = OO', IBL = OA, I1 =OV: No load current, blocked rotor current, operating current
- Φ0, ΦBL : No load angle, blocked rotor angle
- Pmax, sPmax, PFmax, Tmax, sTmax: Maximum output power & related slip, maximum power factor, maximum torque & related slip
- η1, s1, PF1, Φ1,: Efficiency, slip, power factor, PF angle at operating current
- AB: Represents rotor power input, which divided by synchronous speed equals starting torque.
The circle diagram is drawn using the data obtained from no load and either short circuit or, in case of machines, blocked rotor tests by fitting a half-circle in points O' and A.
Beyond the error inherent in the constant air-gap assumption, the circle diagram introduces errors due to rotor reactance and rotor resistance variations caused by magnetic saturation and rotor frequency over the range from no-load to operating speed.

See also
References
- Behrend, B.A. (1921). The Induction Motor and Other Alternating Current Motors, their Theory and Principles of Design. McGraw-Hill. p. ix. OL 7033483M.
- Heyland, A. (1894). "A Graphical Method for the Prediction of Power Transformers and Polyphase Motors)". ETZ. 15: 561–564. Retrieved 4 January 2013.
- Terman, Frederick Emmons; Freedman, Cecil Louis; Lenzen, Theodore Louis; Rogers, Kenneth Alfred (Jan 1930). "The General Circle Diagram of Electrical Machinery". 49. American Institute of Electrical Engineers, Transactions of the. Cite journal requires
|journal=(help) - S.K.Bhattacharya (2008-08-27). Electrical Machines (2008 ed.). Tata McGraw-Hill Education. p. 359. ISBN 978-0-07-066921-5.
- Heyland, Alexander (1906). A Graphical Treatment of the Induction Motor. G.H. Rowe, R.E. Hellmund (trans.). McGraw Publishing Company. Retrieved 10 January 2013.
- Phase to Phase BV (2006). "The Asynchronous Motor Model" (PDF). pp. 5–6. Archived from the original (PDF) on 10 August 2014. Retrieved 10 January 2013.
- Alger, Philip L.; et al. (1949). "'Induction Machines' subsec. of sec. 7 - Alternating-Current Generators and Motors". In A.E. Knowlton (ed.). Standard Handbook for Electrical Engineers (8th ed.). McGraw-Hill. pp. 710–711.
- Fernandez, Francis M. "Construction of Circle Diagram" (PDF). College of Engineering Trivandrum. Archived from the original (PDF) on 8 August 2014. Retrieved 10 January 2013.