Bongabon, Nueva Ecija
Bongabon, officially the Municipality of Bongabon, is a 2nd class municipality in the province of Nueva Ecija, Philippines. According to the 2015 census, it has a population of 64,173 people.[3]
Bongabon | |
|---|---|
| Municipality of Bongabon | |
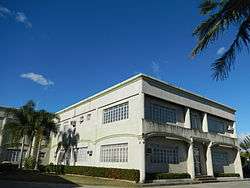 Municipal Hall | |
 Seal | |
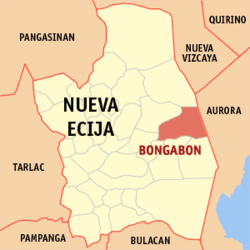 Map of Nueva Ecija with Bongabon highlighted | |
OpenStreetMap 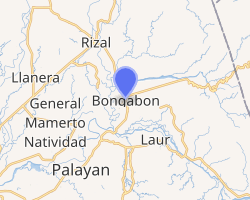
| |
.svg.png) Bongabon Location within the Philippines | |
| Coordinates: 15°37′56″N 121°08′41″E | |
| Country | |
| Region | Central Luzon (Region III) |
| Province | Nueva Ecija |
| District | 3rd District |
| Founded | 1760 |
| Barangays | 28 |
| Government | |
| • Type | Sangguniang Bayan |
| • Mayor | Allan Xystus A. Gamilla |
| • Vice Mayor | Hernan P. Andres |
| • Congressman | Rosanna V. Vergara |
| • Electorate | 43,697 voters (2019) |
| Area | |
| • Total | 286.95 km2 (110.79 sq mi) |
| Elevation | 72.0 m (236.2 ft) |
| Population (2015 census)[3] | |
| • Total | 64,173 |
| • Density | 220/km2 (580/sq mi) |
| • Households | 14,819 |
| Economy | |
| • Income class | 2nd municipal income class |
| • Poverty incidence | 14.8% (2015)[4] |
| • Revenue (₱) | 157,182,782.60 (2016) |
| Time zone | UTC+8 (PST) |
| ZIP code | 3128 |
| PSGC | |
| IDD : area code | +63 (0)44 |
| Climate type | tropical monsoon climate |
| Native languages | Ilocano Tagalog |
| Website | bongabon |
It has an area of 28,352.90 hectares (70,061.5 acres), and is the leading producer of onion in the Philippines and in Southeast Asia.
Each barangay in Bongabon has its own fiesta. The town fiesta, celebrated annually on the 1st to 2nd week of April, is known as the Sibuyasan Onion Festival.
History
The Augustinian missionaries who preached Catholicism in Pampanga extended their outposts into what is now the province of Nueva Ecija by following the Rio Grande dela Pampanga. Thus, Santol (present day Barangay Santor) was part of Pantabangan and established in 1659. In 1760, Bongabon was named as a town and parish under the patronage of St. Francis of Assisi.
Bongabon was the first capital of Nueva Ecija.
Philippine Revolution under the Spanish Colonial Period
When the Philippine Revolution began on 1896 to 1898 against Spain. The Philippine Revolutionary and Republican troops with the aid of Katipunero rebels invaded the municipal town of Bongabon and fought the Spanish Colonial forces and started the Siege of Bongabon. The Filipino revolutionary troops and Katipunero rebel fighters captured the municipal town after the siege forcing the Spanish troops to retreat.
Philippine-American War and the American Colonial Period
With the outbreak of the Philippine–American War on 1899 to 1902, the town saw the arrival of American troops which fought the Filipino revolutionary troops and Katipuneros in the Battle of Bongabon on 1899. In the ensuing battle, the town was captured by the American troops.
Barangays
Bongabon is politically subdivided into 28 barangays, listed here with their 2010 populations:
Poblacion barangays:
- Commercial - 333
- Kaingin - 2,714
- Magtanggol - 1,696
- Mantile - 1,118
- Palo Maria - 2,064
- Rizal - 2,796
- Sampalucan - 1,577
- San Roque - 2,344
- Sinipit - 2,398
- Sisilang - 657
- Social - 735
- Tulay na Bato (New Era) - 1,919
Rural barangays:
- Antipolo - 3,975
- Ariendo - 999
- Bantug - 913
- Calaanan - 2,047
- Cruz - 1,829
- Curva - 3,315
- Digmala - 1,118
- Labi - 1,302
- Larcon - 1,454
- Lusok - 2,002
- Macabaclay - 2,229
- Olivete - 1,872
- Pesa - 2,141
- Santor - 5,911
- Tugatug - 1,932
- Vega Grande - 5,953
Climate
| Climate data for Bongabon, Nueva Ecija | |||||||||||||
|---|---|---|---|---|---|---|---|---|---|---|---|---|---|
| Month | Jan | Feb | Mar | Apr | May | Jun | Jul | Aug | Sep | Oct | Nov | Dec | Year |
| Average high °C (°F) | 29 (84) |
30 (86) |
31 (88) |
33 (91) |
33 (91) |
31 (88) |
30 (86) |
29 (84) |
29 (84) |
30 (86) |
30 (86) |
29 (84) |
30 (87) |
| Average low °C (°F) | 19 (66) |
19 (66) |
20 (68) |
22 (72) |
23 (73) |
24 (75) |
24 (75) |
24 (75) |
23 (73) |
22 (72) |
21 (70) |
20 (68) |
22 (71) |
| Average precipitation mm (inches) | 4 (0.2) |
6 (0.2) |
7 (0.3) |
12 (0.5) |
61 (2.4) |
89 (3.5) |
96 (3.8) |
99 (3.9) |
81 (3.2) |
88 (3.5) |
37 (1.5) |
13 (0.5) |
593 (23.5) |
| Average rainy days | 2.5 | 3.0 | 4.1 | 6.3 | 15.8 | 19.4 | 22.5 | 21.6 | 20.1 | 17.5 | 9.6 | 4.0 | 146.4 |
| Source: Meteoblue [5] | |||||||||||||
Demographics
| Population census of Bongabon | |||||||||||||||||||||||||||||||||||||||||||||||||
|---|---|---|---|---|---|---|---|---|---|---|---|---|---|---|---|---|---|---|---|---|---|---|---|---|---|---|---|---|---|---|---|---|---|---|---|---|---|---|---|---|---|---|---|---|---|---|---|---|---|
|
| ||||||||||||||||||||||||||||||||||||||||||||||||
| Source: Philippine Statistics Authority[3][6][7][8] | |||||||||||||||||||||||||||||||||||||||||||||||||
Religion
The majority of the people of the municipality are Roman Catholic. The members of the Iglesia ni Cristo are growing in number and are second to the Catholics in membership. Other sects in the municipality are the Methodists, Iglesia ng Dios, Seventh-day Adventists, etc.
Tourism, art and culture
- Sibuyas Festival is celebrated as a form of thanksgiving every 10 April, and a way to promote and show their town as one of the largest producers of onion in Asia.
- Ilog Jordan at Barangay Olivete - This place is a popular Lenten destination for people seeking spiritual rejuvenation and healing.
- Falls Deepsap at Barangay Labi - A good place to visit during summer, the falls offers a cold shimmering water perfect to beat heatwaves. Its water comes from the untainted Sierra Madre Mountain.
- Mount Labi Peak at Barangay Labi
Health care
Bongabon District Hospital, a government hospital located at Barangay Curva, Bongabon, Nueva Ecija
Education
Most are public schools from primary to secondary. Bongabon National High School is located at Barangay Sinipit, Bongabon, Nueva Ecija, Philippines. Many of the students are going to Cabanatuan City to continue their college.
References
- "Municipality". Quezon City, Philippines: Department of the Interior and Local Government. Retrieved 31 May 2013.
- "Province: Nueva Ecija". PSGC Interactive. Quezon City, Philippines: Philippine Statistics Authority. Retrieved 12 November 2016.
- Census of Population (2015). "Region III (Central Luzon)". Total Population by Province, City, Municipality and Barangay. PSA. Retrieved 20 June 2016.
- "PSA releases the 2015 Municipal and City Level Poverty Estimates". Quezon City, Philippines. Retrieved 1 January 2020.
- "Bongabon: Average Temperatures and Rainfall". Meteoblue. Retrieved 4 May 2020.
- Census of Population and Housing (2010). "Region III (Central Luzon)". Total Population by Province, City, Municipality and Barangay. NSO. Retrieved 29 June 2016.
- Censuses of Population (1903–2007). "Region III (Central Luzon)". Table 1. Population Enumerated in Various Censuses by Province/Highly Urbanized City: 1903 to 2007. NSO.
- "Province of Nueva Ecija". Municipality Population Data. Local Water Utilities Administration Research Division. Retrieved 17 December 2016.
External links
| Wikimedia Commons has media related to Bongabon, Nueva Ecija. |
- Official website
- Bongabon Profile at PhilAtlas.com
- Pasyalan Nueva Ecija
- Bongabon Web Services - Nueva Ecija
- Philippine Standard Geographic Code
- Philippine Census Information
- Local Governance Performance Management System
Places adjacent to Bongabon, Nueva Ecija | ||||||||||
|---|---|---|---|---|---|---|---|---|---|---|
| ||||||||||
Palayan (capital) | |
| Municipalities | |
| Component cities | |