2014 Taiwanese local elections
The Taiwanese local elections of 2014,[2] commonly known as the nine-in-one elections (Chinese: 九合一選擧), were held on Saturday, 29 November 2014, to elect the Municipal Mayors, Municipal Councilors, Chiefs of indigenous districts in municipalities, Councilors of indigenous districts in municipalities, County Magistrates (City Mayors), County (City) Councilors, Township Chiefs, Township Councilors and chiefs of village (borough) in 6 municipalities and 16 counties (cities). Elected officials would serve a four-year term. Polling stations were open from 08:00 to 16:00 on the election day.[2]
| ||||||||||||||||||||||||||||||||||||||||
22 magistrates/mayors and others[lower-alpha 1] | ||||||||||||||||||||||||||||||||||||||||
|---|---|---|---|---|---|---|---|---|---|---|---|---|---|---|---|---|---|---|---|---|---|---|---|---|---|---|---|---|---|---|---|---|---|---|---|---|---|---|---|---|
| Registered | 18,511,356 | |||||||||||||||||||||||||||||||||||||||
| Turnout | 67.59% | |||||||||||||||||||||||||||||||||||||||
| ||||||||||||||||||||||||||||||||||||||||
 Elected magistrate/mayor party by seat | ||||||||||||||||||||||||||||||||||||||||
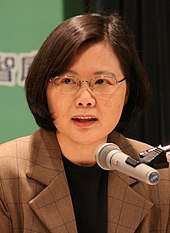

The elections resulted in a substantial defeat for the KMT. The KMT previously held 14 of 22 municipalities and counties, but won only 6 in this election due to widespread public distrust, a de facto vote of no confidence to President Ma's Administration, both politically (a reckless approach on the cross strait relations with Chinese Communist Party) and economically (social inequality on the income distribution).[3][4][5] The DPP gained executive control of 7 municipalities and counties from the KMT, while independent Ko Wen-je won the Taipei mayoral election.[6] Premier Jiang Yi-huah resigned after the election, forcing President Ma Ying-jeou to appoint Mao Chi-kuo to replace Jiang.[7] President Ma resigned from his post as Chairperson of the Chinese Nationalist Party (KMT) in the days following the election.[8]
As five elected leaders were incumbent legislators, a subsequent legislative by-election was held in March 2015, in which there were no party swings.
Results Summary

_(cropped).jpg)
.jpg)
(cropped).jpg)
.jpg)
.jpg)
.jpg)
%E9%AD%8F%E6%98%8E%E8%B0%B7_Congressman_of_Taiwan_from_ChangHua_County_Wei%2C_Ming_Ku.jpg)
.jpg)


.jpg)
.jpg)
.jpg)
.png)
.JPG)
.jpg)
.jpg)
Magistrate and mayor elections
| Subdivision | Electorate | Turnout (%) | Winner | Runner-up | Map | ||||||
|---|---|---|---|---|---|---|---|---|---|---|---|
| Name | Votes | % | Name | Votes | % | ||||||
| New Taipei City | 3,156,402 | 61.65 | Eric Chu | 959,302 | 50.06 | Yu Shyi-kun | 934,774 | 48.78 |  | ||
| Taipei City | 2,146,939 | 70.46 | Ko Wen-je | 853,983 | 57.16 | Sean Lien | 609,932 | 40.82 |  | ||
| Taoyuan City | 1,568,713 | 62.73 | Cheng Wen-tsan | 492,414 | 51.00 | John Wu | 463,133 | 47.97 |  | ||
| Taichung City | 2,093,689 | 71.93 | Lin Chia-lung | 847,284 | 57.06 | Jason Hu | 637,531 | 42.94 | 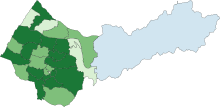 | ||
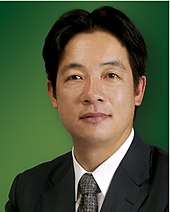
| Tainan City | 1,512,778 | 65.88 | Lai Ching-te | 711,557 | 72.90 | Huang Hsiu-shuang | 264,536 | 27.10 |  | ||
| Kaohsiung City | 2,231,225 | 66.44 | Chen Chu | 993,300 | 68.09 | Yang Chiu-hsing | 450,647 | 30.89 |  | ||
| Yilan County | 365,138 | 70.46 | Lin Tsung-hsien | 160,253 | 63.95 | Chiou Shu-ti | 90,320 | 36.05 |  | ||
| Hsinchu County | 403,173 | 68.76 | Chiu Ching-chun | 124,309 | 46.94 | Cheng Yung-chin | 118,698 | 44.82 |  | ||
| Miaoli County | 446,182 | 72.80 | Hsu Yao-chang | 147,547 | 46.59 | Wu Yi-chen | 89,838 | 28.37 |  | ||
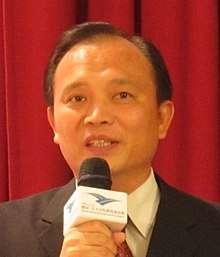
| Changhua County | 1,015,804 | 72.93 | Wei Ming-ku | 386,405 | 53.71 | Lin Tsang-min | 284,738 | 39.58 |  | ||
| Nantou County | 414,091 | 73.11 | Lin Ming-chen | 149,361 | 50.96 | Lee Wen-chung | 143,719 | 49.04 |  | ||
| Yunlin County | 565,557 | 74.09 | Lee Chin-yung | 232,900 | 56.98 | Chang Li-shan | 175,862 | 43.02 |  | ||
| Chiayi County | 430,505 | 74.19 | Helen Chang | 193,399 | 63.09 | Won Chung-chun | 104,488 | 34.09 |  | ||
| Pingtung County | 686,810 | 73.53 | Pan Men-an | 308,953 | 62.93 | Chien Tai-lang | 182,027 | 37.07 |  | ||
| Taitung County | 179,015 | 67.82 | Justin Huang | 64,272 | 54.41 | Liu Chao-hao | 53,860 | 45.59 |  | ||
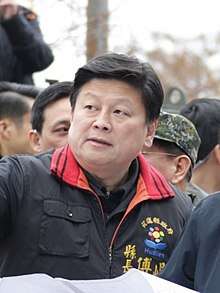
| Hualien County | 265,571 | 61.77 | Fu Kun-chi | 89,048 | 56.53 | Tsai Chi-ta | 43,504 | 27.62 |  | ||
| Penghu County | 82,269 | 66.27 | Chen Kuang-fu | 29,164 | 55.34 | Su Kun-hsiung | 23,533 | 44.66 | |||
| Keelung City | 303,329 | 63.92 | Lin Yu-chang | 101,010 | 53.15 | Hsieh Li-kung | 52,198 | 27.47 | |||
| Hsinchu City | 322,472 | 62.90 | Lin Chih-chien | 76,578 | 38.36 | Hsu Ming-tsai | 75,564 | 37.85 | |||
| Chiayi City | 208,099 | 70.96 | Twu Shiing-jer | 74,698 | 51.41 | Chen Yi-chen | 66,108 | 45.50 | |||
| Kinmen County | 103,555 | 45.15 | Chen Fu-hai | 23,965 | 52.77 | Lee Wo-shih | 15,146 | 33.35 | |||
| Lienchiang County | 10,040 | 67.05 | Liu Cheng-ying | 4,385 | 66.25 | Yang Sui-sheng | 2,234 | 33.75 | |||


New Taipei
| New Taipei | ||||||
|---|---|---|---|---|---|---|
| No. | Candidate | Party | Votes | Percentage | ||
| 1 | Yu Shyi-kun (游錫堃) | DPP | 934,774 | 48.78% | ||
| 2 | Li Chin-shun (李進順) | Independent | 22,207 | 1.16% | ||
| 3 | Eric Chu (朱立倫) | 959,302 | 50.06% | |||
Taipei
| Taipei | ||||||
|---|---|---|---|---|---|---|
| No. | Candidate | Party | Votes | Percentage | ||
| 1 | Chen Ju-pin (陳汝斌) | Self Help Party | 1,624 | 0.11% | ||
| 2 | Chao Yen-ching (趙衍慶) | Independent | 15,898 | 1.06% | ||
| 3 | Lee Hong-hsin (李宏信) | Independent | 2,621 | 0.18% | ||
| 4 | Yong C. Chen (陳永昌) | Independent | 1,908 | 0.13% | ||
| 5 | Neil Peng (馮光遠) | Independent | 8,080 | 0.54% | ||
| 6 | Sean Lien (連勝文) | 609,932 | 40.82% | |||
| 7 | Ko Wen-je (柯文哲) | Independent | 853,983 | 57.16% | ||
Taoyuan
| Taoyuan | ||||||
|---|---|---|---|---|---|---|
| No. | Candidate | Party | Votes | Percentage | ||
| 1 | Cheng Wen-tsan (鄭文燦) | DPP | 492,414 | 51.00% | ||
| 2 | John Wu (吳志揚) | 463,133 | 47.97% | |||
| 3 | Hsu Jiu-chih (許睿智) | Independent | 9,943 | 1.03% | ||
Taichung
| Taichung | ||||||
|---|---|---|---|---|---|---|
| No. | Candidate | Party | Votes | Percentage | ||
| 1 | Jason Hu (胡志強) | 637,531 | 42.94% | |||
| 2 | Lin Chia-lung (林佳龍) | DPP | 847,284 | 57.06% | ||
Tainan
| Tainan | ||||||
|---|---|---|---|---|---|---|
| No. | Candidate | Party | Votes | Percentage | ||
| 1 | William Lai (賴清德) | DPP | 711,557 | 72.90% | ||
| 2 | Huang Hsiu-shuang (黃秀霜) | 264,536 | 27.10% | |||
Kaohsiung
| Kaohsiung | ||||||
|---|---|---|---|---|---|---|
| No. | Candidate | Party | Votes | Percentage | ||
| 1 | Chou Ko-sheng (周可盛) | Independent | 14,925 | 1.02% | ||
| 2 | Chen Chu (陳菊) | DPP | 993,300 | 68.09% | ||
| 3 | Yang Chiu-hsing (楊秋興) | 450,647 | 30.89% | |||
Yilan County
| Yilan County | ||||||
|---|---|---|---|---|---|---|
| No. | Candidate | Party | Votes | Percentage | ||
| 1 | Lin Tsung-hsien (林聰賢) | DPP | 160,253 | 63.95% | ||
| 2 | Chiou Shu-ti (邱淑媞) | 90,320 | 36.05% | |||
Hsinchu County
| Hsinchu County | ||||||
|---|---|---|---|---|---|---|
| No. | Candidate | Party | Votes | Percentage | ||
| 1 | Yeh Fang-tung (葉芳棟) | Independent | 15,699 | 5.93% | ||
| 2 | Chiu Ching-chun (邱鏡淳) | 124,309 | 46.94% | |||
| 3 | Cheng Yung-chin (鄭永金) | Independent | 118,698 | 44.82% | ||
| 4 | Chuang Tso-bin (莊作兵) | Independent | 6,115 | 2.31% | ||
Miaoli County
| Miaoli County | ||||||
|---|---|---|---|---|---|---|
| No. | Candidate | Party | Votes | Percentage | ||
| 1 | Hsu Yao-chang (徐耀昌) | 147,547 | 46.59% | |||
| 2 | Kang Shi-ru (康世儒) | Independent | 60,356 | 19.06% | ||
| 3 | Jiang Ming-xiu (江明修) | Independent | 14,978 | 4.73% | ||
| 4 | Chen Shu-fen (陳淑芬) | Independent | 2,137 | 0.67% | ||
| 5 | Zeng Guo-liang (曾國良) | Independent | 1,807 | 0.57% | ||
| 6 | Wu Yi-chen (吳宜臻) | DPP | 89,838 | 28.37% | ||
Changhua County
| Changhua County | ||||||
|---|---|---|---|---|---|---|
| No. | Candidate | Party | Votes | Percentage | ||
| 1 | Huang Wen-ling (黃文玲) | Independent | 37,593 | 5.23% | ||
| 2 | Hung Min-hsiung (洪敏雄) | Independent | 10,674 | 1.48% | ||
| 3 | Wei Ming-ku (魏明谷) | DPP | 386,405 | 53.71% | ||
| 4 | Lin Tsang-min (林滄敏) | 284,738 | 39.58% | |||
Nantou County
| Nantou County | ||||||
|---|---|---|---|---|---|---|
| No. | Candidate | Party | Votes | Percentage | ||
| 1 | Lee Wen-chung (李文忠) | DPP | 143,719 | 49.04% | ||
| 2 | Lin Ming-chen (林明溱) | 149,361 | 50.96% | |||
Yunlin County
| Yunlin County | ||||||
|---|---|---|---|---|---|---|
| No. | Candidate | Party | Votes | Percentage | ||
| 1 | Chang Li-shan (張麗善) | 175,862 | 43.02% | |||
| 2 | Lee Chin-yung (李進勇) | DPP | 232,900 | 56.98% | ||
Chiayi County
| Chiayi County | ||||||
|---|---|---|---|---|---|---|
| No. | Candidate | Party | Votes | Percentage | ||
| 1 | Huang Hong-cheng (黃宏成) | Independent | 8,639 | 2.82% | ||
| 2 | Helen Chang (張花冠) | DPP | 193,399 | 63.09% | ||
| 3 | Won Chung-chun (翁重鈞) | 104,488 | 34.09% | |||
Taitung County
| Taitung County | ||||||
|---|---|---|---|---|---|---|
| No. | Candidate | Party | Votes | Percentage | ||
| 1 | Liu Chao-hao (劉櫂豪) | DPP | 53,860 | 45.59% | ||
| 2 | Justin Huang (黃健庭) | 64,272 | 54.41% | |||
Pingtung County
| Pingtung County | ||||||
|---|---|---|---|---|---|---|
| No. | Candidate | Party | Votes | Percentage | ||
| 1 | Chien Tai-lang (簡太郎) | 182,027 | 37.07% | |||
| 2 | Pan Men-an (潘孟安) | DPP | 308,953 | 62.93% | ||
Hualien County
| Hualien County | ||||||
|---|---|---|---|---|---|---|
| No. | Candidate | Party | Votes | Percentage | ||
| 1 | Fu Kun-chi (傅崐萁) | Independent | 89,048 | 56.53% | ||
| 2 | Hsu Chen-wei (徐榛蔚) | Independent | 5,436 | 3.45% | ||
| 3 | Huang Shih-peng (黄師鵬) | Independent | 2,369 | 1.50% | ||
| 4 | Ke Tsi-hai (柯賜海) | Independent | 14,954 | 9.49% | ||
| 5 | Chu Kuo-hua (朱國華) | Independent | 2,218 | 1.41% | ||
| 6 | Tsai Chi-ta (蔡啟塔) | 43,504 | 27.62% | |||
Penghu County
| Penghu County | ||||||
|---|---|---|---|---|---|---|
| No. | Candidate | Party | Votes | Percentage | ||
| 1 | Chen Kuang-fu (陳光復) | DPP | 29,164 | 55.34% | ||
| 2 | Su Kun-hsiung (蘇崑雄) | 23,533 | 44.66% | |||
Keelung
| Keelung | ||||||
|---|---|---|---|---|---|---|
| No. | Candidate | Party | Votes | Percentage | ||
| 1 | Hsieh Li-kung (謝立功) | 52,198 | 27.47% | |||
| 2 | Huang Ching-tai (黃景泰) | Independent | 30,914 | 16.27% | ||
| 3 | Lin Yu-chang (林右昌) | DPP | 101,010 | 53.15% | ||
| 4 | Ho Yen-tang (何燕堂) | People's Democratic Front | 1,376 | 0.72% | ||
| 5 | Wu Woo-min (吳武明) | Independent | 2,023 | 1.06% | ||
| 6 | Jiang Jian-yu (江鑒育) | Independent | 2,517 | 1.32% | ||
Hsinchu
| Hsinchu | ||||||
|---|---|---|---|---|---|---|
| No. | Candidate | Party | Votes | Percentage | ||
| 1 | Liu Cheng-hsing (劉正幸) | Independent | 1,914 | 0.96% | ||
| 2 | Hsu Ming-tsai (許明財) | 75,564 | 37.85% | |||
| 3 | Tsai Jen-chien (蔡仁堅) | Independent | 40,480 | 20.28% | ||
| 4 | Lin Chih-chien (林智堅) | DPP | 76,578 | 38.36% | ||
| 5 | Wu Shu-min (吳淑敏) | Independent | 5,101 | 2.56% | ||
Chiayi
| Chiayi | ||||||
|---|---|---|---|---|---|---|
| No. | Candidate | Party | Votes | Percentage | ||
| 1 | Chen Xiu-li (陳秀麗) | Independent | 633 | 0.44% | ||
| 2 | Chen Tai-shan (陳泰山) | Independent | 786 | 0.54% | ||
| 3 | Chen Yi-chen (陳以真) | 66,108 | 45.50% | |||
| 4 | Twu Shiing-jer (涂醒哲) | DPP | 74,698 | 51.41% | ||
| 5 | Sheu Jia-ming (許文建) | Independent | 330 | 0.23% | ||
| 6 | Lin Shi-han (林詩涵) | People Democratic Front | 2,747 | 1.89% | ||
Kinmen County
| Kinmen County | ||||||
|---|---|---|---|---|---|---|
| No. | Candidate | Party | Votes | Percentage | ||
| 1 | Su Long-ke (蘇龍科) | Independent | 470 | 1.03% | ||
| 2 | Lei You-jing (雷由靖) | Independent | 132 | 0.29% | ||
| 3 | Chen Fu-hai (陳福海) | Independent | 23,965 | 52.77% | ||
| 4 | Lee Wo-shih (李沃士) | 15,146 | 33.35% | |||
| 5 | Wang Cheng-hua (汪成華) | The Guarantee of Educational, Scientific and Cultural Budget e-Union | 403 | 0.89% | ||
| 6 | Hong Zhi-heng (洪志恒) | Independent | 636 | 1.40% | ||
| 7 | Zhuang Yu-min (莊育民) | Independent | 236 | 0.52% | ||
| 8 | Lin Suei-Chuan (林水泉) | Independent | 240 | 0.53% | ||
| 9 | Shiu Nai-chiuan (許乃權) | Independent | 3,834 | 8.44% | ||
| 10 | Yang Rong-xiang (楊榮祥) | Independent | 354 | 0.78% | ||
Lienchiang County
| Lienchiang County | ||||||
|---|---|---|---|---|---|---|
| No. | Candidate | Party | Votes | Percentage | ||
| 1 | Liu Cheng-ying (劉增應) | 4,385 | 66.25% | |||
| 2 | Yang Sui-sheng (楊綏生) | 2,234 | 33.75% | |||
Councillor elections

| Division | DPP | TSU | Total | ||||
|---|---|---|---|---|---|---|---|
| Seats | Seats | Seats | Seats | Seats | Seats | ||
| Taipei | 28 | 27 | 1 | 2 | 2 | 3 | 63 |
| New Taipei | 26 | 32 | 1 | 7 | 66 | ||
| Taoyuan | 29 | 20 | 1 | 10 | 60 | ||
| Keelung | 14 | 10 | 3 | 4 | 31 | ||
| Yilan County | 11 | 12 | 1 | 9 | 34 | ||
| Hsinchu | 15 | 7 | 1 | 10 | 33 | ||
| Hsinchu County | 23 | 2 | 9 | 36 | |||
| Miaoli County | 19 | 4 | 15 | 38 | |||
| Taichung | 28 | 27 | 2 | 6 | 63 | ||
| Changhua County | 24 | 17 | 13 | 54 | |||
| Nantou County | 17 | 8 | 11 | 37 | |||
| Yunlin County | 7 | 13 | 1 | 22 | 43 | ||
| Chiayi | 6 | 5 | 1 | 12 | 24 | ||
| Chiayi County | 9 | 18 | 10 | 37 | |||
| Tainan | 16 | 28 | 1 | 12 | 57 | ||
| Kaohsiung | 24 | 33 | 1 | 1 | 7 | 66 | |
| Taitung County | 22 | 1 | 7 | 30 | |||
| Pingtung County | 19 | 18 | 1 | 7 | 55 | ||
| Penghu County | 8 | 2 | 9 | 19 | |||
| Kinmen County | 15 | 1 | 3 | 19 | |||
| Lienchiang County | 6 | 3 | 9 | ||||
| Total | 386 | 291 | 9 | 9 | 2 | 208 | 907 |
Township/city mayor elections

- Including Municipal Mayors, Aboriginal Rural District Chiefs, Township Chiefs
| Division | DPP | Total | ||
|---|---|---|---|---|
| Seats | Seats | Seats | ||
| Changhua County | 8 | 8 | 10 | 26 |
| Chiayi City | none | |||
| Chiayi County | 1 | 13 | 4 | 18 |
| Hsinchu City | none | |||
| Hsinchu County | 8 | 1 | 4 | 13 |
| Hualien County | 9 | 1 | 3 | 13 |
| Kaohsiung City (Maolin, Taoyuan, Namasia) | 2 | 1 | 3 | |
| Keelung City | none | |||
| Kinmen County | 6 | 6 | ||
| Lienchiang County | 4 | 4 | ||
| Miaoli County | 11 | 7 | 18 | |
| Nantou County | 4 | 2 | 7 | 13 |
| New Taipei (Wulai) | 1 | 1 | ||
| Penghu County | 2 | 4 | 6 | |
| Pingtung County | 7 | 10 | 16 | 33 |
| Taichung City (Heping) | 1 | 1 | ||
| Tainan City | none | |||
| Taipei City | none | |||
| Taitung County | 12 | 1 | 3 | 13 |
| Taoyuan City (Fuxing) | 1 | 1 | ||
| Yilan County | 4 | 6 | 2 | 12 |
| Yunlin County | 1 | 12 | 7 | 20 |
| Total | 82 | 54 | 70 | 200 |
Township/city council elections
| Division | DPP | Total | ||
|---|---|---|---|---|
| Seats | Seats | Seats | ||
| Changhua County | 41 | 47 | 224 | 317 |
| Chiayi City | none | |||
| Chiayi County | 18 | 27 | 148 | 193 |
| Hsinchu City | none | |||
| Hsinchu County | 75 | 2 | 65 | 141 |
| Hualien County | 90 | 4 | 48 | 142 |
| Kaohsiung City (Maolin, Taoyuan, Namasia) | 5 | 16 | 21 | |
| Keelung City | none | |||
| Kinmen County | 32 | 13 | 45 | |
| Lienchiang County | 17 | 5 | 22 | |
| Miaoli County | 49 | 7 | 137 | 193 |
| Nantou County | 36 | 3 | 124 | 163 |
| New Taipei City (Wulai) | 1 | 6 | 7 | |
| Pingtung County | 44 | 45 | 245 | 334 |
| Penghu County | 5 | 1 | 45 | 51 |
| Taichung City (Heping) | 5 | 6 | 11 | |
| Taipei City | none | |||
| Tainan City | none | |||
| Taitung County | 63 | 72 | 136 | |
| Taoyuan City (Fuxing) | 6 | 5 | 11 | |
| Yilan County | 40 | 33 | 58 | 131 |
| Yunlin County | 12 | 25 | 194 | 228 |
| Total | 539 | 194 | 1411 | 2146 |
Village chief elections
| Division | DPP | TSU | Total | |||
|---|---|---|---|---|---|---|
| Seats | Seats | Seats | Seats | Seats | ||
| Changhua County | 60 | 7 | 521 | |||
| Chiayi City | 23 | 2 | 59 | 84 | ||
| Chiayi County | 18 | 11 | 328 | 357 | ||
| Hsinchu City | 29 | 93 | 122 | |||
| Hsinchu County | 91 | 100 | 191 | |||
| Hualien County | 106 | 1 | 70 | 177 | ||
| Kaohsiung City | 148 | 147 | 596 | 891 | ||
| Keelung City | 55 | 1 | 101 | 157 | ||
| Kinmen County | 34 | 3 | 37 | |||
| Lienchiang County | 19 | 3 | 22 | |||
| Miaoli County | 62 | 212 | 274 | |||
| Nantou County | 60 | 3 | 199 | 262 | ||
| New Taipei City | 279 | 36 | 1 | 715 | 1032 | |
| Pingtung County | 51 | 6 | 407 | 464 | ||
| Penghu County | 29 | 67 | 96 | |||
| Taichung City | 174 | 31 | 420 | 625 | ||
| Tainan City | 71 | 76 | 605 | 752 | ||
| Taipei City | 229 | 50 | 1 | 175 | 456 | |
| Taitung County | 73 | 74 | 147 | |||
| Taoyuan City | 142 | 2 | 351 | 495 | ||
| Yilan County | 29 | 11 | 193 | 233 | ||
| Yunlin County | 12 | 6 | 370 | 288 | ||
| Total | 1794 | 390 | 1 | 1 | 5659 | 7849 |
See also
| Wikimedia Commons has media related to Republic of China local elections, 2014. |
- 2016 Taiwan general election
Notes
- Figures in this infobox are for magistrate/mayor elections unless otherwise noted. Special municipalities are counted with counties/cities despite being counted separately in official statistics
- 907 councillors
- 204 township/city mayors and indigenous district chief administrators
- 2,146 township/city council representatives
- 7,849 village chiefs
- Bold figures indicate majority
References
- "中選會選舉資料庫網站". cec.gov.tw (in Chinese). Retrieved 16 January 2020.
- "Taiwan Local Elections of 2014 - Central Election Commission". cec.gov.tw. Archived from the original on 2014-11-19. Retrieved 2014-11-25.
- "A blow to the KMT". The Economist.
- Min-Hua Huang (1 December 2014). "Taiwan's Changing Political Landscape: The KMT's Landslide Defeat in the Nine-in-One Elections". The Brookings Institution.
- "An Analysis of Taiwan's Nine-in-One Local Elections". csis.org.
- "KMT trounce". Taipei Times.
- "Taiwan premier quits as power slips from pro-China party in local poll". Reuters.
- "馬英九決請辭黨主席本週三宣佈".
External links
| Presidential elections | |
|---|---|
| Legislative Yuan elections | |
| Legislative by-elections |
|
| Local elections |
|
| Referendums |
|
| National Assembly elections | |
See also: Elections in the Republic of China (1912–49) | |