2013 Essex County Council election
An election to Essex County Council took place on 2 May 2013 as part of the 2013 United Kingdom local elections. 75 councillors were elected from 70 electoral divisions, which returned either one or two county councillors each by first-past-the-post voting for a four-year term of office. The electoral divisions were the same as those used at the previous election in 2009. No elections were held in Thurrock or Southend-on-Sea, which are unitary authorities outside the area covered by the County Council.
| ||||||||||||||||||||||||||||||||||||||||||||||||||||||||||||||||||||||||||||||||||||||||||||||||||||||||||||
All 75 seats to Essex County Council 38 seats needed for a majority | ||||||||||||||||||||||||||||||||||||||||||||||||||||||||||||||||||||||||||||||||||||||||||||||||||||||||||||
|---|---|---|---|---|---|---|---|---|---|---|---|---|---|---|---|---|---|---|---|---|---|---|---|---|---|---|---|---|---|---|---|---|---|---|---|---|---|---|---|---|---|---|---|---|---|---|---|---|---|---|---|---|---|---|---|---|---|---|---|---|---|---|---|---|---|---|---|---|---|---|---|---|---|---|---|---|---|---|---|---|---|---|---|---|---|---|---|---|---|---|---|---|---|---|---|---|---|---|---|---|---|---|---|---|---|---|---|---|
| ||||||||||||||||||||||||||||||||||||||||||||||||||||||||||||||||||||||||||||||||||||||||||||||||||||||||||||
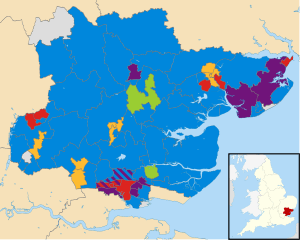 Map showing the results of the 2013 Essex County Council elections. | ||||||||||||||||||||||||||||||||||||||||||||||||||||||||||||||||||||||||||||||||||||||||||||||||||||||||||||
| ||||||||||||||||||||||||||||||||||||||||||||||||||||||||||||||||||||||||||||||||||||||||||||||||||||||||||||
All locally registered electors (British, Irish, Commonwealth and European Union citizens) who were aged 18 or over on Thursday 2 May 2013 were entitled to vote in the local elections. Those who were temporarily away from their ordinary address (for example, away working, on holiday, in student accommodation or in hospital) were also entitled to vote in the local elections,[1] although those who had moved abroad and registered as overseas electors cannot vote in the local elections. It is possible to register to vote at more than one address (such as a university student who had a term-time address and lives at home during holidays) at the discretion of the local Electoral Register Office, but it remains an offence to vote more than once in the same local government election.[2]
Summary
The election saw the Conservative Party retain overall control of the council, but their majority fell from twenty-two to four councillors. UKIP, Labour and the Liberal Democrats all won nine seats. Of the three second-placed parties who won nine seats, UKIP gained the largest share of the county-wide vote, more than 10% ahead of the Labour party.[3] The Liberal Democrats remain as the official Opposition (entitling them to certain expenses and rights to additional speeches) due to incumbency, despite winning fewer votes.[4] The Green Party gained two seats on the Council, despite its overall share of the vote falling. The Independent Loughton Residents Association and the Canvey Island Independent Party both returned one member and an Independent candidate was also elected.
Results
| Party | Seats | Gains | Losses | Net gain/loss | Seats % | Votes % | Votes | +/− | |
|---|---|---|---|---|---|---|---|---|---|
| Conservative | 42 | 1 | 19 | -18 | 56.0 | 34.2 | 112,229 | -9.1 | |
| UKIP | 9 | 9 | 0 | +9 | 12.0 | 27.6 | 90,812 | +23.0 | |
| Labour | 9 | 8 | 0 | +8 | 12.0 | 17.4 | 57,290 | +6.7 | |
| Liberal Democrats | 9 | 0 | 3 | -3 | 12.0 | 10.9 | 35,651 | -8.5 | |
| Green | 2 | 2 | 0 | +2 | 2.7 | 4.6 | 15,187 | -2.0 | |
| Tendring First | 1 | 1 | 0 | +1 | 1.3 | 1.2 | 4,093 | -0.1 | |
| Independent | 1 | 1 | 0 | +1 | 1.3 | 1.1 | 3,625 | +0.1 | |
| Loughton Residents | 1 | 0 | 0 | 1.3 | 1.0 | 3,286 | +0.4 | ||
| Canvey Independent | 1 | 0 | 0 | 1.3 | 0.8 | 2,777 | +0.5 | ||
| BNP | 0 | 0 | 0 | 0 | 0.0 | 0.3 | 909 | -8.6 | |
| English Democrat | 0 | 0 | 0 | 0 | 0.0 | 0.3 | 835 | -1.0 | |
| SWFCTA | 0 | 0 | 0 | 0.0 | 0.2 | 757 | N/A | ||
| TUSC | 0 | 0 | 0 | 0.0 | 0.1 | 431 | N/A | ||
| National Front | 0 | 0 | 0 | 0.0 | 0.1 | 304 | N/A | ||
| Community Representative | 0 | 0 | 0 | 0.0 | 0.1 | 204 | -0.3 | ||
| No label | 0 | 0 | 0 | 0.0 | >0.1 | 24 | N/A | ||
| Young People's | 0 | 0 | 0 | 0.0 | >0.1 | 21 | N/A | ||
| Total | 75 | 328,435 | |||||||
Results by District
Basildon
District Summary
| Party | Seats | +/- | Votes | % | +/- | |
|---|---|---|---|---|---|---|
| UKIP | 3 | 17,863 | 33.4 | +22.9 | ||
| Conservative | 3 | 17,229 | 32.2 | -11.2 | ||
| Labour | 3 | 12,645 | 23.7 | +7.7 | ||
| Liberal Democrat | 0 | 2,772 | 5.2 | -9.9 | ||
| Green | 0 | 1,458 | 2.7 | +2.7 | ||
| Independent | 0 | 1,109 | 2.1 | +2.1 | ||
| British National Party | 0 | 304 | 0.6 | -13.3 | ||
Division Results
| Party | Candidate | Votes | % | ± | |
|---|---|---|---|---|---|
| UKIP | Kerry Smith | 1,347 | 29.0 | +29.0 | |
| Conservative | John Schofield | 1208 | 26.0 | -8.6 | |
| Liberal Democrats | Geoffrey Williams | 1057 | 22.8 | -7.2 | |
| Labour | David Burton-Sampson | 943 | 20.3 | +8.2 | |
| Green | Martin Wargent | 66 | 1.4 | +1.4 | |
| No label | None Of The Above X | 24 | 0.5 | +0.5 | |
| Majority | 139 | 3.0 | -1.6 | ||
| Turnout | 4645 | 21.1 | -14.4 | ||
| UKIP gain from Conservative | Swing | ||||
| Party | Candidate | Votes | % | ± | |
|---|---|---|---|---|---|
| Conservative | Anthony Hedley | 3,661 | 26.7 | -4.5 | |
| Conservative | Kay Twitchen | 3523 | 25.6 | +0.4 | |
| UKIP | Terry Gandy | 2103 | 15.3 | +15.3 | |
| UKIP | Susan McCaffery | 1957 | 14.2 | +14.2 | |
| Labour | Alan Bennett | 658 | 4.8 | +0.2 | |
| Labour | Santa Bennett | 563 | 4.1 | -0.5 | |
| Liberal Democrats | Nigel Horn | 437 | 3.2 | -4.4 | |
| Green | Stephen Watson | 290 | 2.1 | +2.1 | |
| Green | Nelson Brunton | 285 | 2.1 | +2.1 | |
| Liberal Democrats | Martin Howard | 256 | 1.9 | -6.3 | |
| Turnout | 13733 | 26.1 | -47.3 | ||
| Conservative hold | Swing | ||||
| Conservative hold | Swing | ||||
| Party | Candidate | Votes | % | ± | |
|---|---|---|---|---|---|
| Labour | William Archibald | 2,277 | 20.9 | ||
| UKIP | Mark Ellis | 2,175 | 20.0 | ||
| Labour | Anne Fryatt | 1,980 | 18.2 | ||
| UKIP | David Sheppard | 1,684 | 15.5 | ||
| Conservative | John Dornan | 958 | 8.8 | ||
| Conservative | Terri Sargent | 784 | 7.2 | ||
| Liberal Democrats | Francis Barnes-Challinor | 215 | 2.0 | ||
| Liberal Democrats | Arnold Lutton | 187 | 1.7 | ||
| National Front | Thomas Beaney | 171 | 1.6 | ||
| Green | Cheryl Gerrard | 138 | 1.3 | ||
| Independent | Pat Rackley | 119 | 1.1 | ||
| Green | Dawn Holmes | 116 | 1.3 | ||
| TUSC | David Murray | 73 | 0.7 | ||
| Turnout | 10,877 | 20.7 | |||
| Labour gain from Conservative | Swing | ||||
| UKIP gain from Conservative | Swing | ||||
| Party | Candidate | Votes | % | ± | |
|---|---|---|---|---|---|
| Labour | Keith Bobbin | 2,488 | 21.3 | ||
| Labour | Melissa McGeorge | 2181 | 18.7 | ||
| UKIP | Andrew Ager | 2055 | 17.6 | ||
| UKIP | Terry McBride | 1925 | 16.5 | ||
| Conservative | Sandra Hillier | 1257 | 10.8 | ||
| Conservative | Andrew Schrader | 1103 | 9.5 | ||
| Green | Freddie Gerrard-Abbott | 205 | 1.8 | ||
| Liberal Democrats | Ben Williams | 167 | 1.4 | ||
| Liberal Democrats | Linda Williams | 145 | 1.2 | ||
| National Front | Anthony Harms | 133 | 1.1 | ||
| Turnout | 11659 | 20.0 | |||
| Labour gain from Conservative | Swing | ||||
| Labour gain from Conservative | Swing | ||||
| Party | Candidate | Votes | % | ± | |
|---|---|---|---|---|---|
| Conservative | Malcolm Buckley | 2,661 | 21.2 | ||
| UKIP | Nigel De Lecq Le Gresley | 2396 | 19.1 | ||
| UKIP | Paul Downes | 2221 | 17.7 | ||
| Conservative | Don Morris | 2074 | 16.5 | ||
| Independent | Iris Pummell | 966 | 7.7 | ||
| Labour | Albert Ede | 790 | 6.3 | ||
| Labour | Andrew Buxton | 765 | 6.1 | ||
| Green | Poppy Gerrard-Abbott | 191 | 1.5 | ||
| Liberal Democrats | Philip Jenkins | 171 | 1.4 | ||
| Green | Karin Riedl | 167 | 1.3 | ||
| Liberal Democrats | Steve Nice | 137 | 1.1 | ||
| Turnout | 12539 | 22.7 | |||
| Conservative hold | Swing | ||||
| UKIP gain from Conservative | Swing | ||||
Braintree
District Summary
| Party | Seats | +/- | Votes | % | +/- | |
|---|---|---|---|---|---|---|
| Conservative | 6 | 12,107 | 37.8 | -6.5 | ||
| UKIP | 1 | 8,704 | 27.2 | +19.8 | ||
| Green | 1 | 2,601 | 10.3 | -2.4 | ||
| Labour | 0 | 6,945 | 21.7 | +7.9 | ||
| Liberal Democrat | 0 | 1,424 | 4.5 | -8.4 | ||
| British National Party | 0 | 223 | 0.7 | -6.1 | ||
Division Results
| Party | Candidate | Votes | % | ± | |
|---|---|---|---|---|---|
| UKIP | Gordon Helm | 1,340 | 32.7 | +15.0 | |
| Conservative | David Baugh | 1320 | 32.2 | -5.1 | |
| Labour | Lynn Watson | 1226 | 29.9 | +9.4 | |
| Green | Andrea Bunn | 126 | 3.1 | -3.1 | |
| Liberal Democrats | Pamela Hooper | 91 | 2.2 | -9.6 | |
| Majority | 20 | 0.5 | -16.3 | ||
| Turnout | 4103 | 29.0 | -7.4 | ||
| UKIP gain from Conservative | Swing | ||||
| Party | Candidate | Votes | % | ± | |
|---|---|---|---|---|---|
| Conservative | Patricia Newton | 1,605 | 40.6 | -5.0 | |
| UKIP | Philip Palij | 1098 | 27.8 | +27.8 | |
| Labour | Moia Thorogood | 790 | 20.0 | +5.3 | |
| Green | John Malam | 233 | 5.9 | -5.0 | |
| Liberal Democrats | James Fleet | 180 | 4.6 | -7.3 | |
| BNP | John Key | 43 | 1.1 | -6.1 | |
| Majority | 507 | 12.8 | -18.1 | ||
| Turnout | 3949 | 29.4 | -10.5 | ||
| Conservative hold | Swing | ||||
| Party | Candidate | Votes | % | ± | |
|---|---|---|---|---|---|
| Conservative | Graham Butland | 1,152 | 32.8 | -2.5 | |
| Labour | Bill Edwards | 1121 | 31.9 | +12.3 | |
| UKIP | Rod Challis | 953 | 27.1 | +12.5 | |
| Green | Timothy Reeve | 159 | 4.5 | -1.7 | |
| Liberal Democrats | Hayden Hooper | 126 | 3.6 | -9.8 | |
| Majority | 31 | 0.9 | -14.7 | ||
| Turnout | 3511 | 25.2 | -9.9 | ||
| Conservative hold | Swing | ||||
| Party | Candidate | Votes | % | ± | |
|---|---|---|---|---|---|
| Conservative | Joseph Pike | 1,597 | 39.6 | -1.2 | |
| UKIP | Michael Ford | 1,144 | 28.3 | +13.6 | |
| Labour | Malcolm Fincken | 891 | 22.1 | +10.9 | |
| Green | Stephen Hicks | 198 | 4.9 | -2.8 | |
| Liberal Democrats | Bernard Dearlove | 164 | 4.1 | -6.8 | |
| BNP | Paul Hooks | 44 | 1.1 | -3.8 | |
| Majority | 453 | 11.2 | -14.9 | ||
| Turnout | 4,038 | 26.4 | -10.3 | ||
| Conservative hold | Swing | ||||
| Party | Candidate | Votes | % | ± | |
|---|---|---|---|---|---|
| Conservative | David Finch | 2,190 | 48.7 | -5.8 | |
| UKIP | Frank Ferguson | 1096 | 24.4 | N/A | |
| Labour | Stephen Knight | 579 | 12.9 | +5.8 | |
| Liberal Democrats | Steve Bolter | 361 | 8.0 | -10.5 | |
| Green | Joyce Wells | 225 | 5.0 | -6.6 | |
| BNP | Tina Gentry | 44 | 1.0 | -7.3 | |
| Majority | 1,094 | 24.3 | -11.7 | ||
| Turnout | 4,495 | 31.3 | -13.3 | ||
| Conservative hold | Swing | ||||
| Party | Candidate | Votes | % | ± | |
|---|---|---|---|---|---|
| Conservative | Roger Walters | 1,613 | 47.7 | -8.2 | |
| UKIP | Susan Hoye | 950 | 28.1 | +28.1 | |
| Labour | Juliet Walton | 462 | 13.7 | +7.9 | |
| Green | Robert Wright | 207 | 6.1 | -2.6 | |
| Liberal Democrats | Derek Ray | 149 | 4.4 | -8.5 | |
| Majority | 663 | 19.6 | -23.4 | ||
| Turnout | 3381 | 27.7 | -13.2 | ||
| Conservative hold | Swing | ||||
| Party | Candidate | Votes | % | ± | |
|---|---|---|---|---|---|
| Green | James Abbott | 1,209 | 26.4 | +3.2 | |
| UKIP | David Hodges | 1148 | 25.0 | +11.7 | |
| Conservative | Michael Lager | 1120 | 24.4 | -7.4 | |
| Labour | Philip Barlow | 944 | 20.6 | +3.8 | |
| Liberal Democrats | David Toombs | 126 | 2.8 | -5.9 | |
| BNP | Peter Stone | 38 | 0.8 | -5.4 | |
| Majority | 61 | 1.3 | -7.3 | ||
| Turnout | 4585 | 32.3 | -9.4 | ||
| Green gain from Conservative | Swing | ||||
| Party | Candidate | Votes | % | ± | |
|---|---|---|---|---|---|
| Conservative | Derrick Louis | 1,490 | 37.8 | -11.5 | |
| UKIP | Christopher Warner | 995 | 25.2 | +25.2 | |
| Labour | Celia Burne | 932 | 23.6 | +8.0 | |
| Green | Philip ughes | 244 | 6.2 | -6.3 | |
| Liberal Democrats | Barry Fleet | 227 | 5.8 | -7.3 | |
| BNP | Leonard Perry | 54 | 1.4 | -8.2 | |
| Majority | 495 | 12.6 | -21.1 | ||
| Turnout | 3942 | 25.8 | -10.0 | ||
| Conservative hold | Swing | ||||
Brentwood
District Summary
| Party | Seats | +/- | Votes | % | +/- | |
|---|---|---|---|---|---|---|
| Conservative | 2 | 6,186 | 36.7 | -12.6 | ||
| Liberal Democrat | 2 | 4,282 | 25.4 | -4.5 | ||
| UKIP | 0 | 4,336 | 25.7 | +20.2 | ||
| Labour | 0 | 1,541 | 9.1 | +1.8 | ||
| Green | 0 | 500 | 3.0 | +3.0 | ||
Division Results
| Party | Candidate | Votes | % | ± | |
|---|---|---|---|---|---|
| Conservative | Roger Hirst | 2,053 | 48.0 | -17.4 | |
| UKIP | David Watt | 1280 | 29.9 | +29.9 | |
| Labour | Mike Le-Surf | 437 | 10.2 | +3.4 | |
| Liberal Democrats | Alfred Newberry | 353 | 8.3 | -9.8 | |
| Green | David Andrews | 152 | 3.6 | +3.6 | |
| Majority | 773 | 18.1 | -29.3 | ||
| Turnout | 4275 | 27.9 | -14.3 | ||
| Conservative hold | Swing | ||||
| Party | Candidate | Votes | % | ± | |
|---|---|---|---|---|---|
| Liberal Democrats | Barry Aspinell | 1,842 | 43.3 | -2.2 | |
| Conservative | Chris Hossack | 1169 | 27.5 | -12.9 | |
| UKIP | Michael McGough | 863 | 20.3 | +20.3 | |
| Labour | Yvonne Waterhouse | 266 | 6.2 | -3.3 | |
| Green | Simon Attwood | 116 | 2.7 | +2.7 | |
| Majority | 673 | 15.8 | +10.7 | ||
| Turnout | 4256 | 29.9 | -15.0 | ||
| Liberal Democrats hold | Swing | ||||
| Party | Candidate | Votes | % | ± | |
|---|---|---|---|---|---|
| Conservative | Ann Naylor | 1,847 | 44.4 | -4.3 | |
| UKIP | Yvonne Maguire | 1425 | 34.2 | +12.8 | |
| Liberal Democrats | Lisa Barrett | 461 | 11.1 | -5.2 | |
| Labour | Julie Morrissey | 304 | 7.3 | +2.1 | |
| Green | Howard Bills | 126 | 3.0 | +3.0 | |
| Majority | 422 | 10.1 | -17.1 | ||
| Turnout | 4163 | 29.1 | -15.3 | ||
| Conservative hold | Swing | ||||
| Party | Candidate | Votes | % | ± | |
|---|---|---|---|---|---|
| Liberal Democrats | David Kendall | 1,626 | 38.9 | -2.6 | |
| Conservative | Keith Parker | 1117 | 26.7 | -14.6 | |
| UKIP | Mark Allen | 768 | 18.4 | +18.4 | |
| Labour | Gareth Barrett | 534 | 12.8 | +4.7 | |
| Green | Stephanie Bills | 106 | 2.5 | +2.5 | |
| English Democrat | Oliver Tilbrook | 31 | 0.7 | +0.7 | |
| Majority | 509 | 12.2 | +12.1 | ||
| Turnout | 4182 | 28.5 | -12.7 | ||
| Liberal Democrats hold | Swing | ||||
Castle Point
District Summary
| Party | Seats | +/- | Votes | % | +/- | |
|---|---|---|---|---|---|---|
| UKIP | 2 | 6,466 | 34.0 | +26.0 | ||
| Conservative | 2 | 6,404 | 33.8 | -11.7 | ||
| CIIP | 1 | 2,777 | 15.6 | +1.7 | ||
| Labour | 0 | 2,574 | 13.6 | +2.3 | ||
| Liberal Democrat | 0 | 316 | 1.8 | -5.0 | ||
| Green | 0 | 250 | 1.3 | -3.4 | ||
| British National Party | 0 | 214 | 1.1 | -9.9 | ||
Division Results
| Party | Candidate | Votes | % | ± | |
|---|---|---|---|---|---|
| Canvey Independent | Dave Blackwell | 1,766 | 44.3 | +9.5 | |
| UKIP | Brian Wood | 1145 | 28.7 | +28.7 | |
| Conservative | David Cross | 619 | 15.5 | -16.0 | |
| Labour Co-op | Matthew Reilly | 356 | 8.9 | -1.9 | |
| BNP | John Morgan | 79 | 2.0 | -14.7 | |
| Liberal Democrats | Owen Bartholomew | 24 | 0.6 | -5.6 | |
| Majority | 621 | 15.6 | +12.3 | ||
| Turnout | 3989 | 26.4 | -7.8 | ||
| Canvey Independent gain from UKIP | Swing | ||||
| Party | Candidate | Votes | % | ± | |
|---|---|---|---|---|---|
| Conservative | Raymond Howard | 1,310 | 37.1 | -6.0 | |
| Canvey Independent | Peter May | 1011 | 28.6 | -8.0 | |
| UKIP | Anna Wood | 850 | 24.0 | +24.0 | |
| Labour Co-op | Esther Akinnuwa | 278 | 7.9 | +0.9 | |
| BNP | Stephen Smith | 59 | 1.7 | -9.5 | |
| Liberal Democrats | Paul Westlake | 26 | 0.7 | -1.5 | |
| Majority | 299 | 8.5 | +2.0 | ||
| Turnout | 3534 | 26.3 | -7.9 | ||
| Conservative hold | Swing | ||||
| Party | Candidate | Votes | % | ± | |
|---|---|---|---|---|---|
| Conservative | Jillian Reeves | 1,846 | 44.7 | -7.3 | |
| UKIP | Michael Dixon | 1,389 | 33.6 | N/A | |
| Labour Co-op | Joe Reeder | 518 | 12.5 | +3.6 | |
| Green | Douglas Copping | 250 | 6.0 | -1.5 | |
| Liberal Democrats | Elena Black | 130 | 3.2 | -3.9 | |
| Majority | 457 | 11.1 | -23.0 | ||
| Turnout | 4,133 | 30.0 | -11.7 | ||
| Conservative hold | Swing | ||||
| Party | Candidate | Votes | % | ± | |
|---|---|---|---|---|---|
| UKIP | Alan Bayley | 1,723 | 41.9 | +41.9 | |
| Conservative | Colin Riley | 1481 | 36.0 | -18.0 | |
| Labour Co-op | Brian Wilson | 787 | 19.1 | +4.0 | |
| Liberal Democrats | Terry Cooper | 86 | 2.1 | -7.4 | |
| BNP | Philip Howell | 35 | 0.9 | -12.1 | |
| Majority | 242 | 5.9 | -33.0 | ||
| Turnout | 4112 | 31.2 | -7.1 | ||
| UKIP gain from Conservative | Swing | ||||
| Party | Candidate | Votes | % | ± | |
|---|---|---|---|---|---|
| UKIP | Jamie Huntman | 1,359 | 39.8 | +39.8 | |
| Conservative | William Dick | 1148 | 33.6 | -10.3 | |
| Labour Co-op | Joe Cooke | 635 | 18.6 | +4.7 | |
| Independent | Geoff Robinson | 185 | 5.4 | +5.4 | |
| Liberal Democrats | Dominic Graham | 50 | 1.5 | -6.6 | |
| BNP | Paul Maylin | 41 | 1.2 | -6.7 | |
| Majority | 211 | 6.2 | -18.4 | ||
| Turnout | 3418 | 27.7 | -10.8 | ||
| UKIP gain from Conservative | Swing | ||||
Chelmsford
District Summary
| Party | Seats | +/- | Votes | % | +/- | |
|---|---|---|---|---|---|---|
| Conservative | 6 | 12,982 | 35.7 | -8.6 | ||
| Liberal Democrat | 3 | 7,701 | 21.2 | -10.5 | ||
| UKIP | 0 | 9,328 | 25.6 | +24.0 | ||
| Labour | 0 | 4,157 | 8.8 | +4.7 | ||
| Green | 0 | 1,472 | 4.0 | -3.0 | ||
| Independent | 0 | 757 | 2.1 | -0.1 | ||
Division Results
| Party | Candidate | Votes | % | ± | |
|---|---|---|---|---|---|
| Conservative | John Aldridge | 1,985 | 43.9 | -12.8 | |
| UKIP | Ian Nicholls | 1346 | 29.8 | +29.8 | |
| Liberal Democrats | Graham Pooley | 570 | 12.6 | -8.0 | |
| Labour | Philip Gaudin | 387 | 8.6 | +2.1 | |
| Green | Reza Hossain | 184 | 4.1 | -4.5 | |
| English Democrat | Claire Breed | 51 | 1.1 | +1.1 | |
| Majority | 639 | 14.1 | -22.0 | ||
| Turnout | 4523 | 30.0 | -9.2 | ||
| Conservative hold | Swing | ||||
| Party | Candidate | Votes | % | ± | |
|---|---|---|---|---|---|
| Conservative | John Spence | 2,044 | 49.0 | -8.9 | |
| UKIP | Thomas Jones | 1029 | 24.7 | +24.7 | |
| Labour | Raymond William Barry | 466 | 11.2 | +4.8 | |
| Liberal Democrats | Martin Ashby | 428 | 10.3 | -9.3 | |
| Green | Colin Budgey | 206 | 4.9 | -5.0 | |
| Majority | 1015 | 24.3 | -14.0 | ||
| Turnout | 4173 | 25.5 | -11.4 | ||
| Conservative hold | Swing | ||||
| Party | Candidate | Votes | % | ± | |
|---|---|---|---|---|---|
| Conservative | Dick Madden | 1,233 | 35.8 | -7.8 | |
| Liberal Democrats | David Jones | 895 | 26.0 | -12.6 | |
| UKIP | John Theedom | 711 | 20.6 | +20.6 | |
| Labour | Edward Massey | 431 | 12.5 | -5.3 | |
| Green | Tony Lane | 175 | 5.1 | +5.1 | |
| Majority | 338 | 9.8 | +4.7 | ||
| Turnout | 3454 | 28.2 | -0.8 | ||
| Conservative hold | Swing | ||||
| Party | Candidate | Votes | % | ± | |
|---|---|---|---|---|---|
| Liberal Democrats | Stephen Robinson | 1,501 | 37.4 | -4.7 | |
| Conservative | Robert Pontin | 882 | 22.0 | -2.5 | |
| UKIP | Leslie Retford | 862 | 21.5 | +10.2 | |
| Labour | Irene Ferguson | 596 | 14.9 | -3.6 | |
| Green | Angela Thomson | 170 | 4.2 | +0.7 | |
| Majority | 619 | 15.4 | -2.1 | ||
| Turnout | 4011 | 29.1 | +0.9 | ||
| Liberal Democrats hold | Swing | ||||
| Party | Candidate | Votes | % | ± | |
|---|---|---|---|---|---|
| Liberal Democrats | Jude Deakin | 1,078 | 28.6 | -12.6 | |
| Conservative | Graham Christopher Seeley | 975 | 25.8 | -6.8 | |
| UKIP | Eric Johnston | 956 | 25.3 | +25.3 | |
| Labour | Bill Horslen | 642 | 17.0 | +6.0 | |
| Green | Avril Howe | 124 | 3.3 | -4.2 | |
| Majority | 104 | 2.8 | -5.9 | ||
| Turnout | 3775 | 25.9 | -9.4 | ||
| Liberal Democrats hold | Swing | ||||
| Party | Candidate | Votes | % | ± | |
|---|---|---|---|---|---|
| Conservative | Jenny Chandler | 1,440 | 31.2 | -2.4 | |
| UKIP | Jeanette Howes | 1,368 | 29.6 | +17.0 | |
| Liberal Democrats | Chris Rycroft | 1,191 | 25.8 | -15.1 | |
| Labour | Richard Hyland | 472 | 10.2 | +5.0 | |
| Green | Darryl Newport | 152 | 3.3 | -0.9 | |
| Majority | 72 | 1.6 | -5.8 | ||
| Turnout | 4,623 | 29.3 | -11.3 | ||
| Conservative gain from Liberal Democrats | Swing | ||||
| Party | Candidate | Votes | % | ± | |
|---|---|---|---|---|---|
| Conservative | Norman Hume | 893 | 33.8 | -10.1 | |
| SWFCTA | Ian Roberts | 757 | 28.6 | +2.5 | |
| UKIP | Cliff Hammans | 560 | 21.2 | +21.2 | |
| Labour | Derek Barnett | 289 | 10.9 | +3.8 | |
| Liberal Democrats | Noel Sutcliffe | 94 | 3.6 | -5.9 | |
| Green | Robert King | 51 | 1.9 | -2.8 | |
| Majority | 136 | 5.1 | -12.6 | ||
| Turnout | 2644 | 20.7 | -12.0 | ||
| Conservative hold | Swing | ||||
| Party | Candidate | Votes | % | ± | |
|---|---|---|---|---|---|
| Liberal Democrats | Michael Mackrory | 1,767 | 35.5 | -10.2 | |
| Conservative | Jean Murray | 1463 | 29.4 | -8.2 | |
| UKIP | Nicholas Tidman | 991 | 19.9 | +19.9 | |
| Labour | David Howell | 519 | 10.4 | +5.6 | |
| Green | Jeremy Jacobs | 239 | 4.8 | -0.7 | |
| Majority | 304 | 6.1 | -2.0 | ||
| Turnout | 4979 | 31.7 | -8.9 | ||
| Liberal Democrats hold | Swing | ||||
| Party | Candidate | Votes | % | ± | |
|---|---|---|---|---|---|
| Conservative | Ian Grundy | 2,067 | 48.4 | -10.9 | |
| UKIP | Jesse Pryke | 1505 | 35.2 | +11.2 | |
| Labour | Maurice Austin | 355 | 8.3 | -0.6 | |
| Liberal Democrats | Matt Klesel | 177 | 4.1 | -1.1 | |
| Green | Rachel Joanna Brunton | 171 | 4.0 | +1.4 | |
| Majority | 562 | 13.1 | -22.2 | ||
| Turnout | 4275 | 30.8 | +8.8 | ||
| Conservative hold | Swing | ||||
Colchester
Result Summary
| Party | Seats | +/- | Votes | % | +/- | |
|---|---|---|---|---|---|---|
| Conservative | 4 | 10,597 | 29.5 | -5.5 | ||
| Liberal Democrat | 3 | 7,705 | 21.5 | -12.7 | ||
| Labour | 2 | 7,127 | 19.9 | +7.6 | ||
| UKIP | 0 | 8,058 | 22.5 | +20.3 | ||
| Green | 0 | 2,394 | 6.7 | -3.6 | ||
Division Results
| Party | Candidate | Votes | % | ± | |
|---|---|---|---|---|---|
| Liberal Democrats | Margaret Fisher | 1,273 | 37.0 | -13.4 | |
| UKIP | Harry Royle | 786 | 22.8 | N/A | |
| Labour | Tyron Wilson | 519 | 15.1 | +7.4 | |
| Green | Peter Lynn | 467 | 13.6 | -4.3 | |
| Conservative | Saimon Rashid | 395 | 11.5 | -6.0 | |
| Majority | 487 | 14.2 | -18.4 | ||
| Turnout | 3440 | 21.1 | -9.9 | ||
| Liberal Democrats hold | Swing | ||||
| Party | Candidate | Votes | % | ± | |
|---|---|---|---|---|---|
| Conservative | Anne Brown | 2,075 | 43.8 | -7.7 | |
| UKIP | Mark Cole | 1471 | 31.0 | +16.9 | |
| Labour | John Spademan | 504 | 10.6 | +4.1 | |
| Green | Roger Bamforth | 387 | 8.2 | -1.2 | |
| Liberal Democrats | Carolyn Catney | 303 | 6.4 | -6.8 | |
| Majority | 604 | 12.7 | -24.6 | ||
| Turnout | 4740 | 31.6 | -10.9 | ||
| Conservative hold | Swing | ||||
| Party | Candidate | Votes | % | ± | |
|---|---|---|---|---|---|
| Conservative | Sue Lissimore | 1,957 | 40.1 | -0.5 | |
| Liberal Democrats | Nick Cope | 1127 | 23.1 | -17.2 | |
| UKIP | John Pitts | 951 | 19.5 | N/A | |
| Labour Co-op | Mike Dale | 527 | 10.8 | +5.3 | |
| Green | Steve Ford | 314 | 6.4 | -3.1 | |
| Majority | 830 | 17.0 | +16.7 | ||
| Turnout | 4876 | 35.4 | -8.8 | ||
| Conservative hold | Swing | ||||
| Party | Candidate | Votes | % | ± | |
|---|---|---|---|---|---|
| Labour | Dave Harris | 1,665 | 43.9 | +14.5 | |
| Liberal Democrats | Lyn Barton | 933 | 24.6 | -7.7 | |
| UKIP | Raymond Tuttlebee | 573 | 15.1 | N/A | |
| Conservative | Mike Hardy | 475 | 12.5 | -12.3 | |
| Green | Pam Nelson | 143 | 3.8 | -2.8 | |
| Majority | 732 | 19.3 | +16.5 | ||
| Turnout | 3789 | 26.9 | -5.6 | ||
| Labour gain from Liberal Democrats | Swing | ||||
| Party | Candidate | Votes | % | ± | |
|---|---|---|---|---|---|
| Conservative | John Jowers | 1,913 | 47.0 | -9.7 | |
| UKIP | Rebecca Ager | 1134 | 27.8 | N/A | |
| Labour | Audrey Spencer | 629 | 15.4 | +7.9 | |
| Green | Sue Bailey | 216 | 5.3 | -5.3 | |
| Liberal Democrats | Gill Collings | 181 | 4.4 | -12.6 | |
| Majority | 779 | 19.1 | -20.6 | ||
| Turnout | 4073 | 28.0 | -9.1 | ||
| Conservative hold | Swing | ||||
| Party | Candidate | Votes | % | ± | |
|---|---|---|---|---|---|
| Liberal Democrats | Anne Turrell | 1,417 | 39.2 | -15.0 | |
| Conservative | Ben Locker | 888 | 24.5 | -4.4 | |
| UKIP | Bill Rowley | 725 | 20.0 | N/A | |
| Labour | Jennie Fisher | 408 | 11.3 | +5.6 | |
| Green | Mary Bryan | 180 | 5.0 | -1.8 | |
| Majority | 529 | 14.6 | -10.7 | ||
| Turnout | 3618 | 24.3 | -9.9 | ||
| Liberal Democrats hold | Swing | ||||
| Party | Candidate | Votes | % | ± | |
|---|---|---|---|---|---|
| Liberal Democrats | Theresa Higgins | 1,259 | 36.6 | -12.7 | |
| UKIP | Ron Levy | 890 | 25.9 | N/A | |
| Conservative | Charles McKay | 609 | 17.7 | -9.0 | |
| Labour | Bob Fisher | 489 | 14.2 | +7.0 | |
| Green | Pat Rogers | 192 | 5.6 | -3.9 | |
| Majority | 369 | 10.7 | -11.8 | ||
| Turnout | 3439 | 26.4 | -8.2 | ||
| Liberal Democrats hold | Swing | ||||
| Party | Candidate | Votes | % | ± | |
|---|---|---|---|---|---|
| Conservative | Kevin Bentley | 1,723 | 40.8 | -3.9 | |
| UKIP | Imelda Clancy | 929 | 22.0 | N/A | |
| Liberal Democrats | Jessica Scott-Boutell | 829 | 19.6 | -9.1 | |
| Labour | Robert Spademan | 491 | 11.6 | +1.3 | |
| Green | Walter Schwarz | 247 | 5.9 | -4.2 | |
| Majority | 794 | 18.8 | +2.8 | ||
| Turnout | 4219 | 29.5 | -8.3 | ||
| Conservative hold | Swing | ||||
| Party | Candidate | Votes | % | ± | |
|---|---|---|---|---|---|
| Labour | Julie Young | 1,895 | 51.4 | +16.7 | |
| UKIP | Graham Tricker | 599 | 16.2 | N/A | |
| Conservative | Mo Metcalf-Fisher | 562 | 15.2 | -7.1 | |
| Liberal Democrats | Shaun Boughton | 383 | 10.4 | -15.2 | |
| Green | Tim Glover | 248 | 6.7 | -5.5 | |
| Majority | 1296 | 35.2 | +26.1 | ||
| Turnout | 3687 | 26.6 | -6.3 | ||
| Labour hold | Swing | ||||
Epping Forest
District Summary
| Party | Seats | +/- | Votes | % | +/- | |
|---|---|---|---|---|---|---|
| Conservative | 6 | 15,695 | 41.8 | -8.0 | ||
| Loughton Residents | 1 | 3,286 | 15.5 | +5.7 | ||
| Liberal Democrat | 1 | 2,431 | 11.5 | -9.1 | ||
| UKIP | 0 | 6,589 | 31.1 | +22.5 | ||
| Labour | 0 | 2,092 | 9.9 | +1.5 | ||
| Green | 0 | 1,061 | 5.0 | -1.7 | ||
| British National Party | 0 | 87 | 0.4 | -10.1 | ||
Division Results
| Party | Candidate | Votes | % | ± | |
|---|---|---|---|---|---|
| Conservative | Valerie Metcalfe | 1,530 | 35.8 | -4.3 | |
| Loughton Residents | Sharon Weston | 1017 | 23.8 | N/A | |
| UKIP | David Dorrell | 790 | 18.5 | +8.7 | |
| Labour | Andrew Forsley | 336 | 7.9 | +2.4 | |
| Green | Steven Neville | 308 | 7.2 | +1.2 | |
| Liberal Democrats | Garry Sadler | 234 | 5.5 | -24.6 | |
| Independent | Rodney Law | 38 | 0.9 | +0.9 | |
| Young People's | Gerard Wadsworth | 21 | 0.5 | +0.5 | |
| Majority | 513 | 12.0 | +2.0 | ||
| Turnout | 4274 | 27.0 | -14.0 | ||
| Conservative hold | Swing | ||||
| Party | Candidate | Votes | % | ± | |
|---|---|---|---|---|---|
| Conservative | John Knapman | 1,146 | 38.0 | -15.2 | |
| UKIP | Lucy Bostick | 982 | 32.6 | N/A | |
| Loughton Residents | Leon Girling | 324 | 10.8 | N/A | |
| Labour | Margaret Owen | 319 | 10.6 | -3.3 | |
| Green | Christopher Lord | 114 | 3.8 | -5.4 | |
| Liberal Democrats | George Lund | 93 | 3.1 | -8.4 | |
| Independent | Robert Jarvis | 37 | 1.2 | N/A | |
| Majority | 164 | 5.4 | -33.9 | ||
| Turnout | 3015 | 22.3 | -11.2 | ||
| Conservative hold | Swing | ||||
| Party | Candidate | Votes | % | ± | |
|---|---|---|---|---|---|
| Liberal Democrats | Jon Whitehouse | 1,664 | 37.9 | -4.5 | |
| Conservative | Robert Glozier | 1273 | 29.0 | -6.5 | |
| UKIP | Andrew Smith | 1073 | 24.4 | +14.5 | |
| Labour | Simon Bullough | 240 | 5.5 | +2.2 | |
| Green | Barry ohns | 145 | 3.3 | -0.4 | |
| Majority | 391 | 8.9 | +2.1 | ||
| Turnout | 4395 | 33.0 | -12.4 | ||
| Liberal Democrats hold | Swing | ||||
| Party | Candidate | Votes | % | ± | |
|---|---|---|---|---|---|
| Loughton Residents | Chris Pond | 1,945 | 60.7 | +5.5 | |
| UKIP | Reginald Ellis | 615 | 19.2 | +12.9 | |
| Conservative | Ivan Kovler | 389 | 12.1 | -6.1 | |
| Green | Nicola Fuller | 109 | 3.4 | +1.0 | |
| Independent | Paul Morris | 73 | 2.3 | N/A | |
| Liberal Democrats | Maureen Jarvis | 72 | 2.2 | -0.1 | |
| Majority | 1330 | 41.5 | +4.5 | ||
| Turnout | 3203 | 23.1 | -14.2 | ||
| Loughton Residents hold | Swing | ||||
| Party | Candidate | Votes | % | ± | |
|---|---|---|---|---|---|
| Conservative | Anthony Jackson | 1,669 | 47.6 | -13.4 | |
| UKIP | Peter Field | 1170 | 33.4 | N/A | |
| Labour | David Mills | 421 | 12.0 | +3.8 | |
| Green | Nicola Barnecutt | 164 | 4.7 | -3.9 | |
| Liberal Democrats | Arnold Verrall | 83 | 2.4 | -7.8 | |
| Majority | 499 | 14.2 | -34.8 | ||
| Turnout | 3507 | 24.7 | -12.8 | ||
| Conservative hold | Swing | ||||
| Party | Candidate | Votes | % | ± | |
|---|---|---|---|---|---|
| Conservative | Maggie McEwen | 1,475 | 51.0 | -2.0 | |
| UKIP | Ronald Till | 738 | 25.5 | N/A | |
| Labour | Peter Gode | 271 | 9.4 | +3.4 | |
| Liberal Democrats | Brian Surtees | 185 | 6.4 | -8.3 | |
| Green | Jem Barnecutt | 132 | 4.6 | -1.9 | |
| English Democrat | Robin Tilbrook | 93 | 3.2 | -8.1 | |
| Majority | 737 | 25.5 | -12.8 | ||
| Turnout | 2894 | 24.3 | -13.6 | ||
| Conservative hold | Swing | ||||
| Party | Candidate | Votes | % | ± | |
|---|---|---|---|---|---|
| Conservative | Ricki Gadsby | 1,378 | 40.8 | -9.7 | |
| UKIP | Rod Butler | 1221 | 36.1 | N/A | |
| Labour | Robert Greyson | 505 | 14.9 | +6.2 | |
| Liberal Democrats | Timothy Vaughan | 100 | 3.0 | -10.4 | |
| Green | Murray Sackwild | 89 | 2.6 | -3.7 | |
| BNP | Patricia Richardson | 87 | 2.6 | -18.4 | |
| Majority | 157 | 4.6 | -24.9 | ||
| Turnout | 3380 | 20.5 | -10.7 | ||
| Conservative hold | Swing | ||||
Harlow
District Summary
| Party | Seats | +/- | Votes | % | +/- | |
|---|---|---|---|---|---|---|
| Labour | 3 | 8,531 | 36.5 | +10.4 | ||
| Conservative | 1 | 6,218 | 26.6 | -8.7 | ||
| UKIP | 0 | 6,747 | 28.8 | +28.8 | ||
| Liberal Democrat | 0 | 853 | 3.7 | -13.9 | ||
| Green | 0 | 685 | 2.9 | -3.7 | ||
Division Results
| Party | Candidate | Votes | % | ± | |
|---|---|---|---|---|---|
| Labour | Michael Danvers | 1,637 | 37.0 | +12.1 | |
| Conservative | Michael Garnett | 1229 | 27.8 | -5.4 | |
| UKIP | Bill Pryor | 1147 | 25.9 | +25.9 | |
| Liberal Democrats | Mary Wiltshire | 205 | 4.6 | -15.8 | |
| Green | Howard Reed | 115 | 2.6 | -5.9 | |
| TUSC | Paul Lenihan | 88 | 2.0 | +2.0 | |
| Majority | 408 | 9.2 | +0.9 | ||
| Turnout | 4421 | 26.6 | -14.1 | ||
| Labour gain from Conservative | Swing | ||||
| Party | Candidate | Votes | % | ± | |
|---|---|---|---|---|---|
| Conservative | Edward Johnson | 1,346 | 32.5 | -8.3 | |
| Labour | Daniella Pritchard | 1325 | 32.0 | +11.5 | |
| UKIP | Mark Gough | 1254 | 30.3 | +30.3 | |
| Liberal Democrats | Christopher Millington | 131 | 3.2 | -14.7 | |
| Green | Nicholas David Scales | 82 | 2.0 | -4.7 | |
| Majority | 21 | 0.5 | -19.8 | ||
| Turnout | 4138 | 27.4 | -9.5 | ||
| Conservative hold | Swing | ||||
| Party | Candidate | Votes | % | ± | |
|---|---|---|---|---|---|
| Labour | Karen Clempner | 2,794 | 18.8 | ||
| Labour | Anthony Durcan | 2,775 | 18.7 | ||
| UKIP | Dan Long | 2207 | 14.9 | ||
| UKIP | Jerry Crawford | 2139 | 14.4 | ||
| Conservative | Linda Pailing | 1887 | 12.7 | ||
| Conservative | Clive Souter | 1756 | 11.8 | ||
| Green | Susan Ransome | 291 | 2.0 | ||
| Liberal Democrats | Ian Jackson | 276 | 1.9 | ||
| TUSC | David Brown | 270 | 1.8 | ||
| Liberal Democrats | Christopher Robins | 241 | 1.6 | ||
| Green | Daniel Shadbolt | 197 | 1.3 | ||
| Turnout | 14833 | 23.8 | -10.8 | ||
| Labour gain from Conservative | Swing | ||||
| Labour hold | Swing | ||||
Maldon
District Summary
| Party | Seats | +/- | Votes | % | +/- | |
|---|---|---|---|---|---|---|
| Conservative | 3 | 6,138 | 44.5 | -6.3 | ||
| UKIP | 0 | 4,059 | 29.5 | +29.5 | ||
| Labour | 0 | 2,039 | 14.8 | +5.6 | ||
| Green | 0 | 1,163 | 8.4 | -2.6 | ||
| BNP | 0 | 385 | 2.8 | -6.0 | ||
Division Results
| Party | Candidate | Votes | % | ± | |
|---|---|---|---|---|---|
| Conservative | Rodney Bass | 2,300 | 46.3 | -7.6 | |
| UKIP | Beverley Acevedo | 1,202 | 24.2 | N/A | |
| Labour | Stevan Slodzik | 822 | 16.5 | +8.9 | |
| Green | Robert Graves | 417 | 8.4 | -4.6 | |
| BNP | Richard Perry | 230 | 4.6 | -4.8 | |
| Majority | 1,098 | 22.1 | -15.8 | ||
| Turnout | 4,971 | 31.1 | -8.4 | ||
| Conservative hold | Swing | ||||
| Party | Candidate | Votes | % | ± | |
|---|---|---|---|---|---|
| Conservative | Penny Channer | 1,994 | 47.7 | +6.1 | |
| UKIP | Geoffrey Dickman | 1,052 | 25.2 | N/A | |
| Labour | Madeline Diamond | 574 | 13.7 | +4.6 | |
| Green | Janet Carden | 470 | 11.2 | +0.6 | |
| BNP | Mark Burmby | 87 | 2.1 | -4.8 | |
| Majority | 942 | 22.6 | +1.7 | ||
| Turnout | 4,177 | 28.7 | -10.4 | ||
| Conservative hold | Swing | ||||
| Party | Candidate | Votes | % | ± | |
|---|---|---|---|---|---|
| Conservative | Robert Boyce | 1,844 | 39.8 | -5.0 | |
| UKIP | Tim Drain | 1805 | 38.9 | +17.0 | |
| Labour | Leslie Allan McDonald | 643 | 13.9 | +5.1 | |
| Green | Jonathan King | 276 | 6.0 | -1.0 | |
| BNP | Nathan Stone | 68 | 1.5 | -6.3 | |
| Majority | 39 | 0.8 | -22.1 | ||
| Turnout | 4636 | 26.2 | -9.6 | ||
| Conservative hold | Swing | ||||
Rochford
District Summary
| Party | Seats | +/- | Votes | % | +/- | |
|---|---|---|---|---|---|---|
| Conservative | 3 | 6,360 | 34.9 | -14.2 | ||
| UKIP | 1 | 5,127 | 28.2 | +26.4 | ||
| Green | 1 | 1,615 | 8.9 | +4.1 | ||
| Labour | 0 | 2,384 | 13.1 | +5.5 | ||
| Liberal Democrat | 0 | 2,059 | 8.9 | -7.3 | ||
Division Results
| Party | Candidate | Votes | % | ± | |
|---|---|---|---|---|---|
| Conservative | Malcolm Maddocks | 1,332 | 32.4 | -5.9 | |
| Liberal Democrats | Christopher Black | 1037 | 25.2 | -6.6 | |
| UKIP | Janet Davies | 830 | 20.2 | +20.2 | |
| English Democrat | John Hayter | 660 | 16.0 | +2.9 | |
| Labour | David Bodimeade | 258 | 6.3 | +2.2 | |
| Majority | 295 | 7.2 | +0.7 | ||
| Turnout | 4117 | 31.0 | -10.3 | ||
| Conservative hold | Swing | ||||
| Party | Candidate | Votes | % | ± | |
|---|---|---|---|---|---|
| UKIP | Keith Gibbs | 1,379 | 39.8 | +39.8 | |
| Conservative | John Flack | 1194 | 34.4 | -14.5 | |
| Liberal Democrats | Pam Waldie | 563 | 16.2 | -1.4 | |
| Labour | Cameron Scott | 331 | 9.6 | +3.1 | |
| Majority | 185 | 5.3 | -24.4 | ||
| Turnout | 3467 | 26.8 | -8.2 | ||
| UKIP gain from Conservative | Swing | ||||
| Party | Candidate | Votes | % | ± | |
|---|---|---|---|---|---|
| Conservative | Terry Cutmore | 1,470 | 42.6 | -9.1 | |
| UKIP | Gerry Bolton | 1236 | 35.8 | +35.8 | |
| Labour | Allan Davies | 446 | 12.9 | +6.1 | |
| Liberal Democrats | Deborah Taylor | 296 | 8.6 | -5.5 | |
| Majority | 234 | 6.8 | -30.2 | ||
| Turnout | 3448 | 26.1 | -10.8 | ||
| Conservative hold | Swing | ||||
| Party | Candidate | Votes | % | ± | |
|---|---|---|---|---|---|
| Conservative | Colin Seagers | 1,085 | 36.4 | -14.7 | |
| Labour | Jerry Gibson | 1005 | 33.7 | +21.1 | |
| UKIP | Peter Van De Vyver | 804 | 27.0 | +27.0 | |
| Liberal Democrats | Angela Robinson | 89 | 3.0 | -6.1 | |
| Majority | 80 | 2.7 | -34.4 | ||
| Turnout | 2983 | 24.0 | -7.8 | ||
| Conservative hold | Swing | ||||
| Party | Candidate | Votes | % | ± | |
|---|---|---|---|---|---|
| Green | Michael Hoy | 1,615 | 38.5 | +38.5 | |
| Conservative | Keith Hudson | 1279 | 30.5 | -26.3 | |
| UKIP | Cherry Young | 878 | 21.0 | +21.0 | |
| Labour | Rachael Broomfield | 344 | 8.2 | -1.1 | |
| Liberal Democrats | Ian Gale | 74 | 1.8 | -15.4 | |
| Majority | 336 | 8.0 | -31.6 | ||
| Turnout | 4190 | 29.8 | -7.7 | ||
| Green gain from Conservative | Swing | ||||
Tendring
District Summary
| Party | Seats | +/- | Votes | % | +/- | |
|---|---|---|---|---|---|---|
| Conservative | 4 | 10,310 | 30.8 | -10.0 | ||
| UKIP | 2 | 9,774 | 29.2 | +27.1 | ||
| Labour | 1 | 5,545 | 16.6 | +5.4 | ||
| Tendring First | 1 | 4,093 | 12.2 | -1.8 | ||
| Liberal Democrat | 0 | 2,661 | 8.0 | -3.5 | ||
| Green | 0 | 1,066 | 3.2 | -3.9 | ||
Division Results
| Party | Candidate | Votes | % | ± | |
|---|---|---|---|---|---|
| UKIP | Roger Lord | 1,429 | 30.4 | +30.4 | |
| Liberal Democrats | Gary Scott | 1,264 | 26.9 | -1.5 | |
| Conservative | Lynda McWilliams | 1,156 | 24.6 | -18.4 | |
| Labour | Colin Olivier | 585 | 12.4 | +1.8 | |
| Green | Maria Iacovou | 165 | 3.5 | -4.9 | |
| Tendring First | Terry Allen | 102 | 2.2 | N/A | |
| Majority | 165 | 3.5 | -11.1 | ||
| Turnout | 4,701 | 32.2 | -6.6 | ||
| UKIP gain from Conservative | Swing | ||||
| Party | Candidate | Votes | % | ± | |
|---|---|---|---|---|---|
| Tendring First | Pierre Oxley | 1,528 | 34.3 | +8.8 | |
| Conservative | Peter Halliday | 1194 | 26.8 | -15.8 | |
| UKIP | Sandy White | 1106 | 24.8 | +24.8 | |
| Labour | Norman Jacobs | 477 | 10.7 | +1.2 | |
| Liberal Democrats | Brian Whitson | 77 | 1.7 | -2.8 | |
| Green | Eleanor Mary Gordon | 70 | 1.6 | -4.5 | |
| Majority | 621 | 7.5 | -9.6 | ||
| Turnout | 4452 | 33.7 | -6.9 | ||
| Tendring First gain from Conservative | Swing | ||||
| Party | Candidate | Votes | % | ± | |
|---|---|---|---|---|---|
| Conservative | Andy Wood | 929 | 29.3 | -10.5 | |
| Labour | Sam Atkinson | 790 | 24.9 | +8.4 | |
| UKIP | Anne Poonian | 789 | 24.9 | N/A | |
| Tendring First | Mark Stephenson | 396 | 12.5 | N/A | |
| Liberal Democrats | Harry Shearing | 191 | 6.0 | -13.9 | |
| Green | James Horsler | 75 | 2.4 | -4.8 | |
| Majority | 139 | 4.4 | -15.6 | ||
| Turnout | 3,170 | 24.2 | -7.0 | ||
| Conservative hold | Swing | ||||
| Party | Candidate | Votes | % | ± | |
|---|---|---|---|---|---|
| Conservative | Paul Honeywood | 1,251 | 38.2 | -1.8 | |
| UKIP | Chris Cotter | 1031 | 31.4 | N/A | |
| Labour | Linda Jacobs | 671 | 20.5 | +9.1 | |
| Tendring First | Christopher Keston | 158 | 4.8 | -12.1 | |
| Liberal Democrats | Ann Whitson | 85 | 2.6 | -5.9 | |
| Green | Clare Palmer | 83 | 2.5 | -2.9 | |
| Majority | 220 | 6.7 | -16.3 | ||
| Turnout | 3279 | 27.1 | -8.2 | ||
| Conservative hold | Swing | ||||
| Party | Candidate | Votes | % | ± | |
|---|---|---|---|---|---|
| Conservative | Michael Page | 2,095 | 37.7 | -8.5 | |
| UKIP | Simon Ashley | 1,588 | 28.6 | N/A | |
| Tendring First | Iris Johnson | 1,085 | 19.5 | -12.9 | |
| Labour | Rose Lawes | 619 | 11.2 | +4.1 | |
| Green | Howard Mettler | 84 | 1.5 | -5.7 | |
| Liberal Democrats | Jo Hayes | 81 | 1.5 | N/A | |
| Majority | 507 | 9.1 | -4.7 | ||
| Turnout | 5,552 | 35.7 | -9.7 | ||
| Conservative hold | Swing | ||||
| Party | Candidate | Votes | % | ± | |
|---|---|---|---|---|---|
| Labour | Ivan Henderson | 1,722 | 41.2 | +20.4 | |
| UKIP | John Brown | 1,138 | 27.2 | N/A | |
| Conservative | Ricky Callender | 892 | 21.3 | -15.2 | |
| Community Representative | Steven Henderson | 204 | 4.9 | -18.4 | |
| Liberal Democrats | Simon Banks | 135 | 3.2 | -3.1 | |
| Green | Robbie Spence | 70 | 1.7 | -4.4 | |
| Tendring First | Jack Robertson | 23 | 0.5 | N/A | |
| Majority | 584 | 14.0 | +0.8 | ||
| Turnout | 4,184 | 31.1 | -5.7 | ||
| Labour gain from Conservative | Swing | ||||
| Party | Candidate | Votes | % | ± | |
|---|---|---|---|---|---|
| UKIP | Andrew Erskine | 1,552 | 35.0 | ||
| Conservative | Michael Skeels | 1,278 | 28.8 | -6.9 | |
| Labour | Mark Morley-Souter | 681 | 15.3 | +4.8 | |
| Tendring First | Mark Cossens | 654 | 14.7 | -8.0 | |
| Green | Chris Southall | 176 | 4.0 | -4.0 | |
| Liberal Democrats | Dennis Cook | 100 | 2.2 | -7.2 | |
| Majority | 274 | 6.2 | -6.9 | ||
| Turnout | 4,441 | 30.1 | -8.4 | ||
| UKIP gain from Conservative | Swing | ||||
| Party | Candidate | Votes | % | ± | |
|---|---|---|---|---|---|
| Conservative | Carlo Guglielmi | 1,515 | 37.9 | -2.9 | |
| UKIP | Dennis Carr | 1,141 | 28.5 | +11.9 | |
| Liberal Democrats | Rosemary Smith | 728 | 18.2 | 0.0 | |
| Green | Duncan Gordon | 343 | 8.6 | +0.5 | |
| Tendring First | David Oxley | 147 | 3.7 | -1.6 | |
| Independent | Jim Clifton | 128 | 3.2 | N/A | |
| Majority | 374 | 9.3 | -13.2 | ||
| Turnout | 4,002 | 29.5 | -11.3 | ||
| Conservative hold | Swing | ||||
Uttlesford
District Summary
| Party | Seats | +/- | Votes | % | +/- | |
|---|---|---|---|---|---|---|
| Conservative | 3 | 8,858 | 42.7 | -11.8 | ||
| Independent | 1 | 5,231 | 10.0 | +10.0 | ||
| UKIP | 0 | 3,741 | 18.0 | +15.9 | ||
| Liberal Democrat | 0 | 3,447 | 16.6 | -8.8 | ||
| Labour | 0 | 1,710 | 8.2 | +4.8 | ||
| Green | 0 | 922 | 4.4 | -6.5 | ||
Division Results
| Party | Candidate | Votes | % | ± | |
|---|---|---|---|---|---|
| Conservative | Susan Barker | 2,661 | 52.4 | -8.5 | |
| UKIP | Alan Stannard | 1,298 | 25.5 | N/A | |
| Labour | Terry Brandon | 482 | 9.5 | +3.2 | |
| Liberal Democrats | David Morgan | 398 | 7.8 | -6.8 | |
| Green | Karmel Stannard | 244 | 4.8 | -5.4 | |
| Majority | 1,363 | 26.8 | -19.5 | ||
| Turnout | 5,083 | 27.8 | -10.4 | ||
| Conservative hold | Swing | ||||
| Party | Candidate | Votes | % | ± | |
|---|---|---|---|---|---|
| Independent | John Lodge | 2,079 | 34.3 | N/A | |
| Conservative | Robert Chambers | 2,031 | 33.5 | -17.1 | |
| UKIP | Barry Tyler | 609 | 10.0 | N/A | |
| Liberal Democrats | Richard Freeman | 607 | 10.0 | -13.2 | |
| Labour | Jane Berney | 491 | 8.1 | +0.7 | |
| Green | Trilby Roberts | 244 | 4.0 | -9.7 | |
| Majority | 48 | 0.8 | -26.6 | ||
| Turnout | 6,061 | 37.7 | -4.4 | ||
| Independent gain from Conservative | Swing | ||||
| Party | Candidate | Votes | % | ± | |
|---|---|---|---|---|---|
| Conservative | Raymond Gooding | 2,262 | 40.7 | -2.9 | |
| Liberal Democrats | Geoffrey Sell | 1,766 | 31.8 | -10.2 | |
| UKIP | Peter Barclay | 944 | 17.0 | N/A | |
| Labour | Ian Davies | 402 | 7.2 | +4.1 | |
| Green | Martin Wybrew | 186 | 3.4 | -3.3 | |
| Majority | 496 | 8.9 | +7.4 | ||
| Turnout | 5,560 | 37.4 | -9.4 | ||
| Conservative hold | Swing | ||||
| Party | Candidate | Votes | % | ± | |
|---|---|---|---|---|---|
| Conservative | Simon Walsh | 1,904 | 47.0 | -9.0 | |
| UKIP | Stuart Moore | 890 | 22.0 | N/A | |
| Liberal Democrats | Antoinette Wattebot | 676 | 16.7 | -0.7 | |
| Labour | Barbara Light | 335 | 8.3 | +4.1 | |
| Green | John Dunkley | 248 | 6.1 | -5.5 | |
| Majority | 1.014 | 25.0 | -13.5 | ||
| Turnout | 4,053 | 29.0 | -12.2 | ||
| Conservative hold | Swing | ||||
References
- "The Representation of the People (Form of Canvass) (England and Wales) Regulations 2006, Schedule Part 1". Legislation.gov.uk. 13 October 2011. Retrieved 18 April 2012.
- "I have two homes. Can I register at both addresses?". The Electoral Commission. Retrieved 5 January 2011.
- "Essex County Council attacked over allowances". Retrieved 17 May 2013.
- "Election Timetable". Retrieved 3 May 2013.
- "Essex". BBC News Online. 3 May 2013. Retrieved 3 May 2013.
External links
| County councils (England) |
| ||
|---|---|---|---|
| Unitary authorities (England) | |||
| Other English councils |
| ||
| Mayoral elections |
| ||
| Unitary authorities (Wales) | |||