2010 Colchester Borough Council election
The 2010 Colchester Borough Council election took place on 6 May 2010 to elect members of Colchester Borough Council in Essex, England. One third of the council was up for election and the council stayed under no overall control.[1]
| |||||||||||||||||||||||||||||||||||||
20 seats (out of 60 seats) 31 seats needed for a majority | |||||||||||||||||||||||||||||||||||||
|---|---|---|---|---|---|---|---|---|---|---|---|---|---|---|---|---|---|---|---|---|---|---|---|---|---|---|---|---|---|---|---|---|---|---|---|---|---|
| |||||||||||||||||||||||||||||||||||||
After the election, the composition of the council was
- Liberal Democrats 26
- Conservative 24
- Labour 7
- Independent 3[2]
Election result
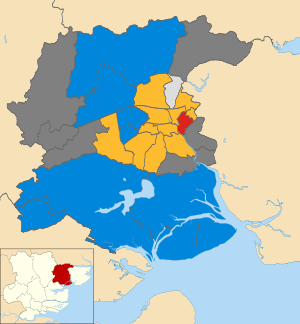
The Liberal Democrats became the largest party on the council with 26 seats after taking 3 seats from the Conservatives.[3] The gains came in Berechurch and Mile End wards where the sitting councillors were not defending the seats, as well as Stanway where Conservative councillor Gaye Pyman was defeated by 265 votes.[3] This dropped the Conservatives to 24 seats, while Labour stayed on 7 seats and there remained 3 independents.[2] Overall turnout at the election was 65.3%, ranging from a high of 74.6% in Pyefleet to a low of 47.9% in St Andrew's ward.[3]
Following the election the coalition between the Liberal Democrats, Labour and independents remained in control of the council administration.[2]
| 2010 Colchester Borough Council election[4] | ||||||||||
|---|---|---|---|---|---|---|---|---|---|---|
| Party | This election | Full council | This election | |||||||
| Seats | Net | Seats % | Other | Total | Total % | Votes | Votes % | +/− | ||
| Liberal Democrats | 10 | 50.0 | 16 | 26 | 43.3 | 27,738 | 39.9 | +2.7 | ||
| Conservative | 8 | 40.0 | 16 | 24 | 40.0 | 26,184 | 37.6 | +0.3 | ||
| Labour | 1 | 5.0 | 6 | 7 | 11.7 | 9,067 | 13.0 | ±0.0 | ||
| Independent | 1 | 5.0 | 2 | 3 | 5.0 | 2,710 | 3.9 | +0.4 | ||
| Green | 0 | 0.0 | 0 | 0 | 0.0 | 3,792 | 5.4 | –3.1 | ||
| BNP | 0 | 0.0 | 0 | 0 | 0.0 | 98 | 0.1 | New | ||
Ward results
| Party | Candidate | Votes | % | ± | |
|---|---|---|---|---|---|
| Liberal Democrats | Colin Mudie | 1,535 | 40.7 | +6.4 | |
| Labour | Christopher Mudie | 1,224 | 32.5 | -4.5 | |
| Conservative | Andrew Bright | 897 | 23.8 | +1.9 | |
| Green | Maria Iacovou | 112 | 3.0 | -3.8 | |
| Majority | 311 | 8.3 | |||
| Turnout | 3,768 | 58.5 | +25.0 | ||
| Liberal Democrats gain from Conservative | Swing | ||||
| Party | Candidate | Votes | % | ± | |
|---|---|---|---|---|---|
| Conservative | Kevin Bentley | 2,019 | 62.9 | -7.2 | |
| Liberal Democrats | Geraldine Westcott-Boyd | 677 | 21.1 | +2.2 | |
| Labour | James Spencer | 358 | 11.2 | +5.2 | |
| Green | Angela Livingstone | 154 | 4.8 | -0.2 | |
| Majority | 1,342 | 41.8 | -9.5 | ||
| Turnout | 3,208 | 72.5 | +35.0 | ||
| Conservative hold | Swing | ||||
| Party | Candidate | Votes | % | ± | |
|---|---|---|---|---|---|
| Liberal Democrats | William Frame | 1,774 | 41.8 | -3.4 | |
| Conservative | Lucy Craymer | 1,112 | 26.2 | +8.6 | |
| Green | Peter Lynn | 913 | 21.5 | -10.2 | |
| Labour | Adam Fox | 449 | 10.6 | +5.1 | |
| Majority | 662 | 15.6 | +2.1 | ||
| Turnout | 4,248 | 59.1 | +21.0 | ||
| Liberal Democrats hold | Swing | ||||
| Party | Candidate | Votes | % | ± | |
|---|---|---|---|---|---|
| Liberal Democrats | Nicolas Cope | 1,218 | 51.6 | +9.2 | |
| Conservative | Alan Drew | 717 | 30.4 | -3.8 | |
| Green | Alexander Cave | 226 | 9.6 | -8.1 | |
| Labour | Michael Donnachie | 200 | 8.5 | +2.8 | |
| Majority | 501 | 21.2 | +13.0 | ||
| Turnout | 2,361 | 73.4 | +27.4 | ||
| Liberal Democrats hold | Swing | ||||
| Party | Candidate | Votes | % | ± | |
|---|---|---|---|---|---|
| Conservative | Christopher Arnold | 1,698 | 57.4 | -9.8 | |
| Liberal Democrats | Barry Woodward | 749 | 25.3 | +12.1 | |
| Labour | Michael Gilheany | 335 | 11.3 | +2.5 | |
| Green | Clarice Mort | 176 | 5.9 | -4.8 | |
| Majority | 949 | 32.1 | -21.8 | ||
| Turnout | 2,958 | 72.4 | +38.1 | ||
| Conservative hold | Swing | ||||
| Party | Candidate | Votes | % | ± | |
|---|---|---|---|---|---|
| Liberal Democrats | Patricia Blandon | 1,452 | 57.9 | -1.4 | |
| Conservative | Grant Mitchell | 583 | 23.3 | +1.2 | |
| Labour | Stephen Adshead | 329 | 13.1 | +1.6 | |
| Green | Stephen Ford | 143 | 5.7 | -1.5 | |
| Majority | 869 | 34.7 | -2.5 | ||
| Turnout | 2,507 | 55.9 | +28.2 | ||
| Liberal Democrats hold | Swing | ||||
| Party | Candidate | Votes | % | ± | |
|---|---|---|---|---|---|
| Independent | Gerard Oxford | 2,057 | 48.2 | -11.3 | |
| Conservative | Joshua Woulfe | 848 | 19.9 | +4.6 | |
| Liberal Democrats | Ian Grimsey | 831 | 19.5 | +8.2 | |
| Labour | Janet Smith | 352 | 8.2 | +3.6 | |
| BNP | Patrick Sullivan | 98 | 2.3 | -4.0 | |
| Green | Robert Spence | 85 | 2.0 | -1.0 | |
| Majority | 1,209 | 28.3 | -15.9 | ||
| Turnout | 4,271 | 63.0 | +31.6 | ||
| Independent hold | Swing | ||||
| Party | Candidate | Votes | % | ± | |
|---|---|---|---|---|---|
| Conservative | Sonia Lewis | 1,729 | 55.5 | -6.8 | |
| Liberal Democrats | Josephine Hayes | 1,084 | 34.8 | +7.2 | |
| Labour | Audrey Spencer | 168 | 5.4 | +1.3 | |
| Green | Clare Palmer | 132 | 4.2 | -1.8 | |
| Majority | 645 | 20.7 | -14.1 | ||
| Turnout | 3,113 | 72.1 | +30.9 | ||
| Conservative hold | Swing | ||||
| Party | Candidate | Votes | % | ± | |
|---|---|---|---|---|---|
| Liberal Democrats | Scott Greenhill | 2,577 | 55.9 | -5.2 | |
| Conservative | Matthew Eaton | 1,516 | 32.9 | +0.7 | |
| Labour | Ian Yates | 372 | 8.1 | +4.7 | |
| Green | Mary Bryan | 146 | 3.2 | -0.2 | |
| Majority | 1,061 | 23.0 | -5.9 | ||
| Turnout | 1,061 | 65.1 | +26.1 | ||
| Liberal Democrats gain from Conservative | Swing | ||||
| Party | Candidate | Votes | % | ± | |
|---|---|---|---|---|---|
| Liberal Democrats | Theresa Higgins | 2,061 | 59.1 | -3.5 | |
| Conservative | Mo Metcalf-Fisher | 680 | 19.5 | +2.9 | |
| Labour | Rossanna Trudgian | 441 | 12.7 | +3.7 | |
| Green | Linda Wonnacott | 304 | 8.7 | -3.1 | |
| Majority | 1,381 | 39.6 | -6.4 | ||
| Turnout | 3,486 | 56.1 | +28.6 | ||
| Liberal Democrats hold | Swing | ||||
| Party | Candidate | Votes | % | ± | |
|---|---|---|---|---|---|
| Conservative | Susan Lissimore | 2,055 | 46.6 | +1.1 | |
| Liberal Democrats | John Loxley | 1,891 | 42.9 | -1.4 | |
| Labour | Michael Dale | 320 | 7.3 | +1.9 | |
| Green | Peter Appleton | 146 | 3.3 | -1.5 | |
| Majority | 164 | 3.7 | +2.6 | ||
| Turnout | 4,412 | 74.1 | +29.9 | ||
| Conservative hold | Swing | ||||
| Party | Candidate | Votes | % | ± | |
|---|---|---|---|---|---|
| Conservative | Terence Sutton | 699 | 43.8 | -17.6 | |
| Liberal Democrats | James Raven | 681 | 42.7 | +30.2 | |
| Labour | Robert Fisher | 146 | 9.2 | +2.3 | |
| Green | Tobie Glenny | 69 | 4.3 | -3.4 | |
| Majority | 18 | 1.1 | -47.8 | ||
| Turnout | 1,595 | 74.6 | +32.2 | ||
| Conservative hold | Swing | ||||
| Party | Candidate | Votes | % | ± | |
|---|---|---|---|---|---|
| Labour | Julie Young | 1,323 | 43.0 | -8.2 | |
| Liberal Democrats | Mark Warner | 1,107 | 36.0 | +5.7 | |
| Conservative | Daniel Ellis | 545 | 17.7 | +3.0 | |
| Green | Beverley Maltby | 100 | 3.3 | -0.6 | |
| Majority | 216 | 7.0 | -13.8 | ||
| Turnout | 3,075 | 47.9 | +23.0 | ||
| Labour hold | Swing | ||||
| Party | Candidate | Votes | % | ± | |
|---|---|---|---|---|---|
| Liberal Democrats | Michael Hogg | 2,214 | 58.4 | +1.9 | |
| Conservative | Benjamin Caine | 916 | 24.2 | +3.0 | |
| Labour | Bruce Tuxford | 490 | 12.9 | -1.8 | |
| Green | Sandra Moog | 168 | 4.4 | -3.2 | |
| Majority | 1,298 | 34.3 | -1.1 | ||
| Turnout | 3,788 | 58.2 | +29.5 | ||
| Liberal Democrats hold | Swing | ||||
| Party | Candidate | Votes | % | ± | |
|---|---|---|---|---|---|
| Liberal Democrats | Raymond Gamble | 1,833 | 62.1 | -9.5 | |
| Conservative | Andrew Tollick | 813 | 27.5 | +5.1 | |
| Labour | Luke Dopson | 217 | 7.4 | +4.0 | |
| Green | David Traynier | 89 | 3.0 | +0.4 | |
| Majority | 1,020 | 34.6 | -14.6 | ||
| Turnout | 2,952 | 71.9 | +29.9 | ||
| Liberal Democrats hold | Swing | ||||
| Party | Candidate | Votes | % | ± | |
|---|---|---|---|---|---|
| Liberal Democrats | Linda Barton | 1,832 | 48.8 | +5.9 | |
| Conservative | Darius Laws | 1,321 | 35.2 | -7.1 | |
| Labour | Paul Fryer-Kelsey | 465 | 12.4 | +2.2 | |
| Green | Walter Schwarz | 135 | 3.6 | -1.0 | |
| Majority | 511 | 13.6 | +13.0 | ||
| Turnout | 3,753 | 55.7 | +25.7 | ||
| Liberal Democrats hold | Swing | ||||
| Party | Candidate | Votes | % | ± | |
|---|---|---|---|---|---|
| Liberal Democrats | Colin Sykes | 1,991 | 46.0 | +0.4 | |
| Conservative | Gaye Pyman | 1,726 | 39.9 | -3.4 | |
| Labour | David Hough | 478 | 11.1 | +3.9 | |
| Green | Pamela Nelson | 130 | 3.0 | -0.9 | |
| Majority | 265 | 6.1 | +3.9 | ||
| Turnout | 4,325 | 66.9 | +28.1 | ||
| Liberal Democrats gain from Conservative | Swing | ||||
| Party | Candidate | Votes | % | ± | |
|---|---|---|---|---|---|
| Conservative | John Elliott | 2,266 | 55.3 | -5.2 | |
| Liberal Democrats | Jason Lower | 858 | 21.0 | +2.3 | |
| Labour | Robert Spademan | 732 | 17.9 | +4.8 | |
| Green | Katherine Bamforth | 238 | 5.8 | -1.9 | |
| Majority | 1,408 | 34.4 | -7.4 | ||
| Turnout | 4,094 | 67.0 | +36.6 | ||
| Conservative hold | Swing | ||||
| Party | Candidate | Votes | % | ± | |
|---|---|---|---|---|---|
| Conservative | Dennis Willetts | 1,350 | 46.0 | -16.9 | |
| Independent | John Gili-Ross | 653 | 22.3 | +22.3 | |
| Liberal Democrats | Katherine Douglas | 535 | 18.2 | +5.5 | |
| Labour | Barbara Nichols | 276 | 9.4 | -3.0 | |
| Green | Roger Bamforth | 119 | 4.1 | -7.9 | |
| Majority | 697 | 23.8 | -26.4 | ||
| Turnout | 2,933 | 73.8 | +37.4 | ||
| Conservative hold | Swing | ||||
| Party | Candidate | Votes | % | ± | |
|---|---|---|---|---|---|
| Conservative | John Jowers | 2,694 | 65.2 | -12.5 | |
| Liberal Democrats | Jennifer Stevens | 838 | 20.3 | +10.7 | |
| Labour | John Wood | 392 | 9.5 | +2.7 | |
| Green | Christopher Fox | 207 | 5.0 | -0.9 | |
| Majority | 1,856 | 44.9 | -23.2 | ||
| Turnout | 4,131 | 69.2 | +34.7 | ||
| Conservative hold | Swing | ||||
References
- "Colchester". BBC News Online. 7 May 2010. Retrieved 31 May 2014.
- Brading, Wendy (14 May 2010). "Colchester : Rainbow coalition to continue". Essex County Standard. NewsBank.
- "Liberal Democrats now biggest party on the council". Essex County Standard. 7 May 2010. Retrieved 31 May 2014.
- "Declaration of result of poll". Colchester Borough Council. Archived from the original on 9 September 2013. Retrieved 31 May 2014.