1988 Basildon District Council election
The 1988 Basildon District Council election took place on 5 May 1988 to elect members of Basildon District Council in Essex, England. This was on the same day as other local elections. One third of the council was up for election; the seats which were last contested in 1984. The council remained under no overall control.
| |||||||||||||||||||||||||||||||||
14 of the 42 seats to Basildon District Council 22 seats needed for a majority | |||||||||||||||||||||||||||||||||
|---|---|---|---|---|---|---|---|---|---|---|---|---|---|---|---|---|---|---|---|---|---|---|---|---|---|---|---|---|---|---|---|---|---|
| |||||||||||||||||||||||||||||||||
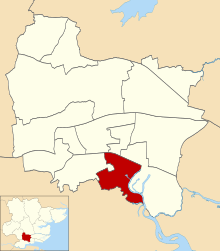
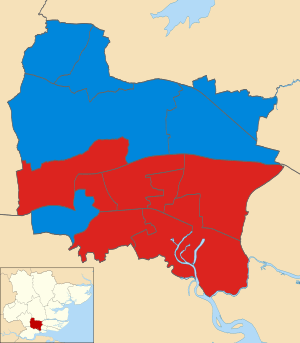 Map showing the results of contested wards in the 1988 Basildon Borough Council elections. | |||||||||||||||||||||||||||||||||
| |||||||||||||||||||||||||||||||||
Overall results
| Party | Seats | Gains | Losses | Net gain/loss | Seats % | Votes % | Votes | +/− | |
|---|---|---|---|---|---|---|---|---|---|
| Labour | 8 | 0 | 1 | 57.1 | 37.8 | 18,116 | |||
| Conservative | 6 | 2 | 0 | 42.9 | 40.2 | 19,283 | |||
| SLD | 0 | 0 | 1 | 0.0 | 22.0 | 10,531 | |||
| Total | 14 | 47,930 | |||||||
All comparisons in vote share are to the corresponding 1984 election.
Ward results
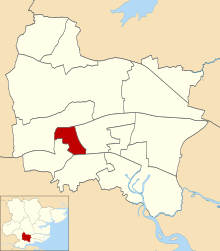
Billericay East
Location of Billericay East ward
| Party | Candidate | Votes | % | |
|---|---|---|---|---|
| Conservative | P. Patrick | 2,106 | 64.0% | |
| Labour | J. Morley | 678 | 20.6% | |
| SLD | G. Viney | 508 | 15.4% | |
| Turnout | 37.9% | |||
| Conservative hold | ||||
Billericay West
Location of Billericay West ward
| Party | Candidate | Votes | % | |
|---|---|---|---|---|
| Conservative | C. Lees | 2,638 | 70.6% | |
| SLD | G. Taylor | 761 | 20.4% | |
| Labour | J. Orpe | 338 | 9.0% | |
| Turnout | 40.8% | |||
| Conservative hold | ||||
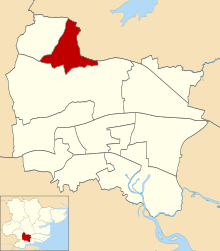
Burstead
Location of Burstead ward
| Party | Candidate | Votes | % | |
|---|---|---|---|---|
| Conservative | R. White | 1,967 | 47.8% | |
| SLD | G. Bellard | 1,773 | 43.1% | |
| Labour | M. Davis | 374 | 9.1% | |
| Turnout | 48.8% | |||
| Conservative hold | ||||
Fryerns Central
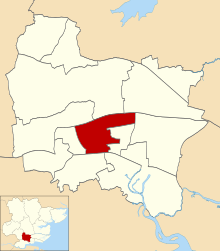
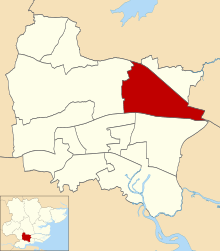
Location of Fryerns Central ward
| Party | Candidate | Votes | % | |
|---|---|---|---|---|
| Labour | D. Webb | 2,459 | 69.8% | |
| Conservative | S. Allen | 793 | 22.5% | |
| SLD | P. Jenkins | 272 | 7.7% | |
| Turnout | 40.5% | |||
| Labour hold | ||||
Fryerns East
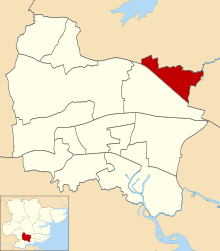
Location of Fryerns East ward
| Party | Candidate | Votes | % | |
|---|---|---|---|---|
| Labour | E. Gelder | 1,687 | 49.2% | |
| SLD | J. Lutton | 1,030 | 30.0% | |
| Conservative | R. Sheridan | 712 | 20.8% | |
| Turnout | 41.2% | |||
| Labour hold | ||||
Laindon
Location of Laindon ward
| Party | Candidate | Votes | % | |
|---|---|---|---|---|
| Labour | P. Rackley | 1,776 | 47.4% | |
| Conservative | G. Buckenham | 1,649 | 44.0% | |
| SLD | M. Hammond | 319 | 8.5% | |
| Turnout | 42.2% | |||
| Labour hold | ||||
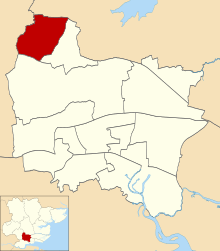
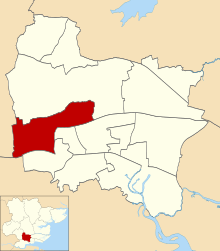
Langdon Hills
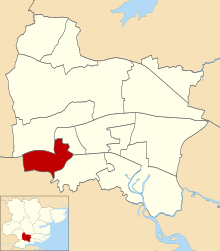
Location of Langdon Hills ward
| Party | Candidate | Votes | % | |
|---|---|---|---|---|
| Conservative | J. Kennard | 1,082 | 39.5% | |
| Labour | J. Gardner | 833 | 30.4% | |
| SLD | S. Dean-Wiley | 823 | 30.1% | |
| Turnout | 32.8% | |||
| Conservative gain from Labour | ||||
Lee Chapel North
Location of Lee Chapel North ward
| Party | Candidate | Votes | % | |
|---|---|---|---|---|
| Labour | R. Fitzgibbon | 1,903 | 61.8% | |
| Conservative | J. Woods | 827 | 26.9% | |
| SLD | S. Saunders | 349 | 11.3% | |
| Turnout | 39.1% | |||
| Labour hold | ||||
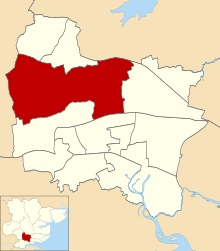
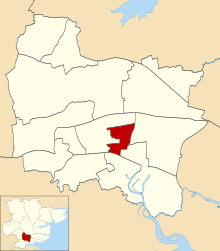
Nethermayne
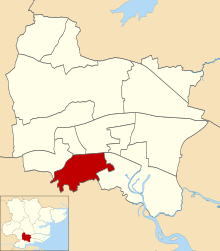
Location of Nethermayne ward
| Party | Candidate | Votes | % | |
|---|---|---|---|---|
| Labour | C. Wilson | 1,390 | 36.5% | |
| SLD | S. Blackbourn | 1,260 | 33.1% | |
| Conservative | H. Tucker | 1,160 | 30.4% | |
| Turnout | 51.0% | |||
| Labour hold | ||||
Pitsea East
Location of Pitsea East ward
| Party | Candidate | Votes | % | |
|---|---|---|---|---|
| Labour | M. Baker | 2,124 | 60.3% | |
| Conservative | J. Harrington | 1,399 | 39.7% | |
| Turnout | 33.5% | |||
| Labour hold | ||||
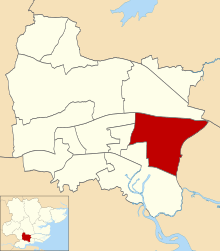
Pitsea West
Location of Pitsea West ward
| Party | Candidate | Votes | % | |
|---|---|---|---|---|
| Labour | D. Marks | 1,912 | 69.3% | |
| Conservative | P. Cleland | 664 | 24.1% | |
| SLD | J. Smith | 184 | 6.7% | |
| Turnout | 31.0% | |||
| Labour hold | ||||
Vange
Location of Vange ward
| Party | Candidate | Votes | % | |
|---|---|---|---|---|
| Labour | R. Cowie | 1,653 | 62.0% | |
| Conservative | S. Ryder | 842 | 31.6% | |
| SLD | B. Wakeham | 169 | 6.3% | |
| Turnout | 33.9% | |||
| Labour hold | ||||
Wickford North
Location of Wickford North ward
| Party | Candidate | Votes | % | |
|---|---|---|---|---|
| Conservative | B. Pummell | 1,681 | 43.7% | |
| SLD | D. Harrison | 1,523 | 39.6% | |
| Labour | E. Harrison | 639 | 16.6% | |
| Turnout | 44.0% | |||
| Conservative hold | ||||
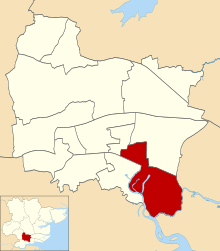
Wickford South
Location of Wickford South ward
| Party | Candidate | Votes | % | |
|---|---|---|---|---|
| Conservative | M. Buckley | 1,763 | 48.0% | |
| SLD | G. Palmer | 1,390 | 37.8% | |
| Labour | T. Hazlewood | 520 | 14.2% | |
| Turnout | 39.9% | |||
| Conservative gain from SLD | ||||
References
- "Council compositions by year". The Elections Centre.
- "Local Election Summaries 1988". The Elections Centre.
- "Basildon District Council Election Results 1973–2012" (PDF). Elections Centre. Retrieved 3 August 2019.
| Metropolitan boroughs |
|
|---|---|
| District councils (England) |
|
| District councils (Scotland) |
|
This article is issued from Wikipedia. The text is licensed under Creative Commons - Attribution - Sharealike. Additional terms may apply for the media files.