1994 Harlow District Council election
The 1994 Harlow District Council election took place on 5 May 1994 to elect members of Harlow District Council in Essex, England. This was on the same day as other local elections. The Labour Party retained control of the council, which it had held continuously since the council's creation in 1973.
| |||||||||||||||||||||||||||||||||
14 of the 42 seats to Harlow District Council 22 seats needed for a majority | |||||||||||||||||||||||||||||||||
|---|---|---|---|---|---|---|---|---|---|---|---|---|---|---|---|---|---|---|---|---|---|---|---|---|---|---|---|---|---|---|---|---|---|
| |||||||||||||||||||||||||||||||||
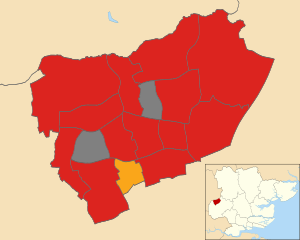 Map showing the results of contested wards in the 1994 Harlow District Council elections. | |||||||||||||||||||||||||||||||||
| |||||||||||||||||||||||||||||||||
Election result
| Party | Seats | Gains | Losses | Net gain/loss | Seats % | Votes % | Votes | +/− | |
|---|---|---|---|---|---|---|---|---|---|
| Labour | 13 | 1 | 0 | 92.9 | 57.3 | 12,708 | |||
| Liberal Democrats | 1 | 0 | 0 | 7.1 | 18.5 | 4,112 | |||
| Conservative | 0 | 0 | 1 | 0.0 | 23.3 | 5,170 | |||
| Independent | 0 | 0 | 0 | 0.0 | 0.9 | 201 | New | ||
All comparisons in vote share are to the corresponding 1990 election.
Ward results
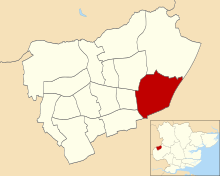
Brays Grove
Location of Brays Grove ward
| Party | Candidate | Votes | % | |
|---|---|---|---|---|
| Labour | A. Howard | 958 | 77.2% | |
| Conservative | D. Crossingham | 283 | 22.8% | |
| Turnout | 41.1% | |||
| Labour hold | ||||
Hare Street and Town Centre
Location of Hare Street and Town Centre ward
| Party | Candidate | Votes | % | |
|---|---|---|---|---|
| Labour | J. Cave | 719 | 63.6% | |
| Liberal Democrats | S. Ward | 258 | 22.8% | |
| Conservative | A. Shannon | 154 | 13.6% | |
| Turnout | 43.6% | |||
| Labour hold | ||||
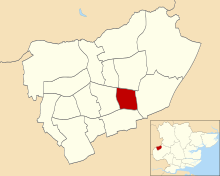
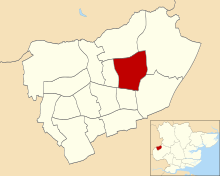
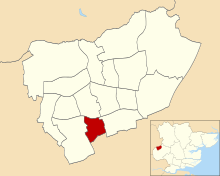
Katherines With Sumner
Location of Katherines with Sumner ward
| Party | Candidate | Votes | % | |
|---|---|---|---|---|
| Labour | D. Pennick | 1,102 | 58.5% | |
| Conservative | S. Living | 782 | 41.5% | |
| Turnout | 40.2% | |||
| Labour hold | ||||
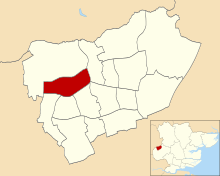
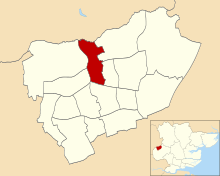
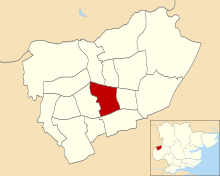
Kingsmoor
Location of Kingsmoor ward
| Party | Candidate | Votes | % | |
|---|---|---|---|---|
| Labour | J. Young | 971 | 46.8% | |
| Conservative | M. Rimmer | 771 | 37.1% | |
| Liberal Democrats | K. Addison | 335 | 16.1% | |
| Turnout | 44.3% | |||
| Labour hold | ||||
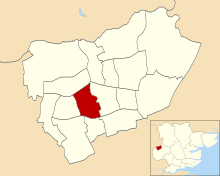
Latton Bush
Location of Latton Bush ward
| Party | Candidate | Votes | % | |
|---|---|---|---|---|
| Labour | Bill Rammell | 1,119 | 63.2% | |
| Conservative | G. Mitchinson | 373 | 21.1% | |
| Liberal Democrats | D. Collins | 279 | 15.8% | |
| Turnout | 46.3% | |||
| Labour hold | ||||
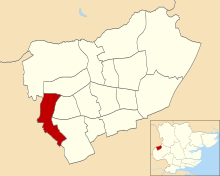
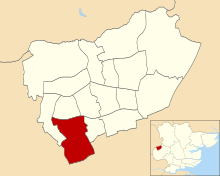
Little Parndon
Location of Little Parndon ward
| Party | Candidate | Votes | % | |
|---|---|---|---|---|
| Labour | M. Carter | 1,097 | 67.6% | |
| Conservative | D. Weales | 325 | 20.0% | |
| Independent | D. Weston | 201 | 12.4% | |
| Turnout | 41.0% | |||
| Labour hold | ||||
Mark Hall North
Location of Mark Hall North ward
| Party | Candidate | Votes | % | |
|---|---|---|---|---|
| Labour | E. Morris | 705 | 68.8% | |
| Conservative | J. Carter | 319 | 31.2% | |
| Turnout | 49.3% | |||
| Labour hold | ||||
Mark Hall South
Location of Mark Hall South ward
| Party | Candidate | Votes | % | |
|---|---|---|---|---|
| Labour | S. Anderson | 997 | 59.5% | |
| Conservative | M. Atkinson | 455 | 27.1% | |
| Liberal Democrats | J. Broomhead | 225 | 13.4% | |
| Turnout | 45.8% | |||
| Labour hold | ||||
Netteswell West
Location of Netteswell West ward
| Party | Candidate | Votes | % | |
|---|---|---|---|---|
| Labour | K. Stevenson | 617 | 60.4% | |
| Liberal Democrats | W. Mitchell | 268 | 26.2% | |
| Conservative | J. Roberts | 137 | 13.4% | |
| Turnout | 41.4% | |||
| Labour hold | ||||
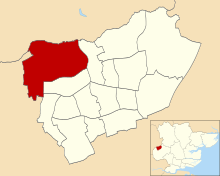
Old Harlow
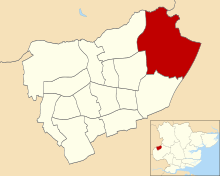
Location of Old Harlow ward
| Party | Candidate | Votes | % | |
|---|---|---|---|---|
| Labour | G. Lyddon | 1,108 | 44.1% | |
| Conservative | M. Garnett | 917 | 36.5% | |
| Liberal Democrats | G. George | 485 | 19.3% | |
| Turnout | 53.7% | |||
| Labour hold | ||||
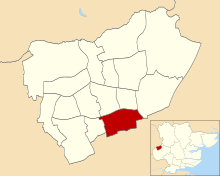
Passmores
Location of Passmores ward
| Party | Candidate | Votes | % | |
|---|---|---|---|---|
| Labour | M. Collyer | 897 | 58.3% | |
| Liberal Democrats | A. Curran | 327 | 21.2% | |
| Conservative | V. Sharron | 315 | 20.5% | |
| Turnout | 43.0% | |||
| Labour hold | ||||
Potter Street
Location of Potter Street ward
| Party | Candidate | Votes | % | |
|---|---|---|---|---|
| Labour | F. Khan | 745 | 46.8% | |
| Liberal Democrats | W. Arnott | 655 | 41.1% | |
| Conservative | D. Fleming | 192 | 12.1% | |
| Turnout | 46.1% | |||
| Labour hold | ||||
Stewards
Location of Stewards ward
| Party | Candidate | Votes | % | |
|---|---|---|---|---|
| Liberal Democrats | D. Eardley | 791 | 50.8% | |
| Labour | J. Sullivan | 606 | 38.9% | |
| Conservative | S. Butt | 161 | 10.3% | |
| Turnout | 41.8% | |||
| Liberal Democrats hold | ||||
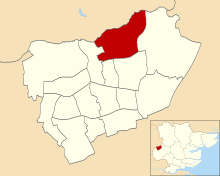
Tye Green
Location of Tye Green ward
| Party | Candidate | Votes | % | |
|---|---|---|---|---|
| Labour | W. Hanley | 1,067 | 69.2% | |
| Liberal Democrats | S. Curran | 259 | 16.8% | |
| Conservative | P. Weales | 216 | 14.0% | |
| Turnout | 43.9% | |||
| Labour hold | ||||
References
- "Council compositions by year". The Elections Centre.
- "Local Election Summaries 1994". The Elections Centre.
- "Harlow District Council Election Results 1976-2012" (PDF). Elections Centre. Retrieved 27 September 2019.
| London boroughs |
|
|---|---|
| Metropolitan boroughs |
|
| District councils (England) |
|
| Regional councils (Scotland) | |
| Referendum | |
| |
This article is issued from Wikipedia. The text is licensed under Creative Commons - Attribution - Sharealike. Additional terms may apply for the media files.