1993 Russian legislative election
Parliamentary elections were held in Russia on 12 December 1993.[1] They included the last elections to the Federation Council of Russia.[2]
| |||||||||||||||||||||||||||||||||||||||||||||||||||||
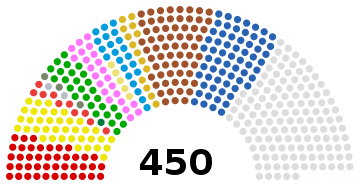
All 450 seats to the State Duma 226 seats needed for a majority | |||||||||||||||||||||||||||||||||||||||||||||||||||||
|---|---|---|---|---|---|---|---|---|---|---|---|---|---|---|---|---|---|---|---|---|---|---|---|---|---|---|---|---|---|---|---|---|---|---|---|---|---|---|---|---|---|---|---|---|---|---|---|---|---|---|---|---|---|
| Turnout | 54.81% | ||||||||||||||||||||||||||||||||||||||||||||||||||||
| |||||||||||||||||||||||||||||||||||||||||||||||||||||
| |||||||||||||||||||||||||||||||||||||||||||||||||||||
.jpg)
.jpg)
| ||||||||||||||||
All 178 seats to the Federation Council | ||||||||||||||||
|---|---|---|---|---|---|---|---|---|---|---|---|---|---|---|---|---|
| ||||||||||||||||
| ||||||||||||||||
Background
The 1993 general election was taking place in the aftermath of the 1993 Russian constitutional crisis, a violent confrontation on the streets of Moscow which resulted in the dissolution of the previous Russian parliament by military force. Yeltsin hoped to resolve the political turmoil by decreeing for the election to the new Russian parliament and the constitutional referendum to take place on 12 December 1993.
Electoral system
The new election law adopted for the 1993 Duma election stipulated half the 450 Duma members were elected by a party-list system of proportional representation, and half were elected as individual representatives from single-member districts. Every Russian voter thus received two different ballots. The proportional representation ballot compelled each voter to endorse an electoral organization or vote against all of them. By contrast, the single-member district ballot required a voter to endorse an individual, whose party affiliation, if any, could not be given on the ballot.
In order to nominate a list of candidates in the proportional representation ballot, a party or electoral organization had to gather 100,000 signatures from the electorate, of which no more than 15% could be from any one region or republic. The method used to calculate the number of seats won by each party was the Hare method, with a threshold of 5.0 per cent of the valid vote, including votes cast against all, but excluding invalid ballots. To secure a place on a single-member district ballot, candidates had to gather the signatures of at least 1.0 percent of the constituency electorate. The winner in each single-member districts contest was simply the candidate with plurality of votes, regardless of the number of votes cast against all.
Results
State Duma
 | ||||||||
| Party | PR | Constituency | Total seats | |||||
|---|---|---|---|---|---|---|---|---|
| Votes | % | Seats | Votes | % | Seats | |||
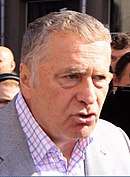
| Liberal Democratic Party | 12,318,562 | 22.9 | 59 | 1,577,400 | 3.0 | 5 | 64 | |
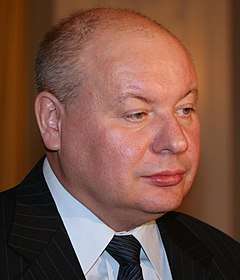
| Russia's Choice | 8,339,345 | 15.5 | 40 | 3,630,799 | 6.8 | 24 | 64 | |
| Communist Party | 6,666,402 | 12.4 | 32 | 1,848,888 | 3.5 | 10 | 42 | |
| Women of Russia | 4,369,918 | 8.1 | 21 | 309,378 | 0.6 | 2 | 23 | |
| Agrarian Party | 4,292,518 | 8.0 | 21 | 2,877,610 | 5.4 | 16 | 37 | |
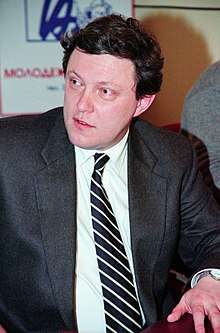
| Yavlinsky–Boldyrev–Lukin | 4,223,219 | 7.9 | 20 | 1,849,120 | 3.5 | 7 | 27 | |
| Party of Russian Unity and Accord | 3,620,035 | 6.7 | 18 | 1,443,454 | 2.7 | 4 | 22 | |
| Democratic Party | 2,969,533 | 5.5 | 14 | 1,094,066 | 2.1 | 0 | 14 | |
| Russian Democratic Reform Movement | 2,191,505 | 4.1 | 0 | 1,083,063 | 2.0 | 5 | 5 | |
| Civic Union | 1,038,193 | 1.9 | 0 | 1,526,115 | 2.9 | 10 | 10 | |
| Future of Russia–New Names | 672,283 | 1.3 | 0 | 411,426 | 0.8 | 2 | 2 | |
| Kedr | 406,789 | 0.8 | 0 | 301,266 | 0.6 | 1 | 1 | |
| Dignity and Charity | 375,431 | 0.7 | 0 | 445,168 | 0.8 | 3 | 3 | |
| Other parties | – | – | – | 377,863 | 0.7 | 0 | 0 | |
| Independents | – | – | – | 25,961,405 | 48.7 | 130 | 130 | |
| Against all | 2,267,963 | 4.2 | – | 8,509,300 | 16.0 | – | – | |
| Invalid/blank votes | – | – | 4,248,927 | – | – | – | ||
| Vacant seats[a] | – | – | – | – | – | 6 | 6 | |
| Total | 53,751,696 | 100 | 225 | 57,495,248 | 100 | 225 | 450 | |
| Registered voters/turnout | 106,170,835 | – | 106,170,835 | 54.2 | – | – | ||
| Source: Nohlen & Stöver, Politika.su | ||||||||
a Five seats in Tatarstan were left vacant due to a low turnout (less than 25%) and were elected at a later date, whilst one seat in Chechnya remained unfilled.[3]
Federation Council
| Party | Votes | % | Seats | ||||
|---|---|---|---|---|---|---|---|
| Independents | 53,751,696 | 100 | 171 | ||||
| Invalid/blank votes | 3,946,002 | – | – | ||||
| Vacant seats[a] | – | – | 7 | ||||
| Total | 57,697,698 | 100 | 178 | ||||
| Registered voters/turnout | 106,170,835 | 54.3 | – | ||||
| Source: Nohlen & Stöver | |||||||
a Five seats were elected at a later date, whilst two seats in Chechnya remained unfilled.[4]
Although the Federation Council was contested on a non-party basis,[2] 11 were members of the Communist Party, six were members of Russia's Choice and nine were members of other parties.[5]
Aftermath
The results of the polls proved to be disappointing for the Kremlin: the two competing pro-government parties, Russia's Choice and the Party of Russian Unity and Accord, gained 15.5% and 6.7% of the vote respectively and won 123 of the 450 seats in the State Duma. Neither party was able to control the parliamentary agenda nor impose the will of the president on the Duma. Lacking legislative success, both parties rapidly lost membership.
Parliamentary groups
The use of the mixed system for the election of the Duma produced a large number of deputies which were unaffiliated with any electoral bloc. By joining other parliamentary groups or forming groups of independent deputies, they could significantly influence the balance of power in the Duma. Hence, the parliamentary groups in the first two-year term of the Duma showed lack of stability and its numbers may be given only with approximation.
| Parliamentary group | Leader | Seats | |
|---|---|---|---|
| Liberal Democratic Party of Russia | Vladimir Zhirinovsky | 53-64 | |
| Russia's Choice | Yegor Gaidar | 47-78 | |
| Communist Party of the Russian Federation | Gennady Zyuganov | 45-47 | |
| Women of Russia | Yekaterina Lakhova | 20-24 | |
| Agrarian Party of Russia | Mikhail Lapshin | 50-55 | |
| Yabloko | Grigory Yavlinsky | 27-28 | |
| Party of Russian Unity and Accord | Sergey Shakhray | 12-34 | |
| Democratic Party of Russia | Nikolay Travkin | 8-15 | |
| Liberal Democratic Union of 12 December | Irina Khakamada | 11-38 | |
| New Regional Politics - Duma-96 | V. Medvedev | 30-67 | |
| Russia | I. Shichalin | 34-38 | |
| Stability | A. Leushkin | 34-40 | |
| Russian Way (unregistered) | Sergei Baburin | 11-14 | |
| Strong State (Derzhava) (unregistered) | V. Kobelev | 4-5 | |
References
- Dieter Nohlen & Philip Stöver (2010) Elections in Europe: A data handbook, p1642 ISBN 978-3-8329-5609-7
- Nohlen & Stöver, p1656
- Результаты выборов в Думу I созыва (in Russian).
- Nohlen & Stöver, p1659
- Nohlen & Stöver, p1658
External links
- Russian general elections (Dead Link)
| Presidential elections | |
|---|---|
| Legislative elections | |
| Gubernatorial elections | |
| Regional elections | |
| Referendums | |
| |