1983 Spanish regional elections
The 1983 Spanish regional elections were held on Sunday, 8 May 1983, to elect the regional parliaments of thirteen of the seventeen autonomous communities—Aragon, Asturias, the Balearic Islands, the Canary Islands, Cantabria, Castile and León, Castilla–La Mancha, Extremadura, La Rioja, Madrid, Murcia, Navarre and the Valencian Community—, not including Andalusia, the Basque Country, Catalonia and Galicia, which had separate electoral cycles. 764 of 1,139 seats in the regional parliaments were up for election. The elections were held simultaneously with local elections all throughout Spain.
| ||
764 seats in the regional parliaments of Aragon, Asturias, Balearic Islands, Canary Islands, Cantabria, Castile and León, Castilla–La Mancha, Extremadura, La Rioja, Madrid, Murcia, Navarre and Valencian Community | ||
|---|---|---|
| Registered | 14,888,251 | |
| Turnout | 10,374,787 (69.7%) | |
|
| ||
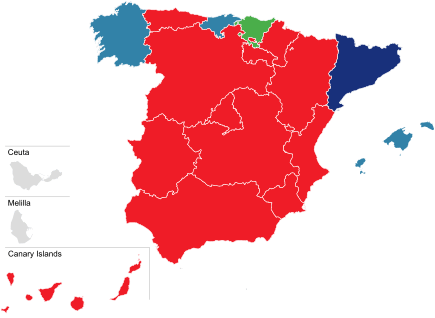 Regional administrations after the 1983 regional elections
| ||
The Spanish Socialist Workers' Party (PSOE) emerged as the largest party in 11 out of the 13 autonomous communities holding elections, reaching or nearing the absolute majority in 9 (Aragon, Asturias, Castilla–La Mancha, Castile and León, Extremadura, La Rioja, Madrid, Murcia and Valencian Community) and winning a plurality in the Canary Islands and Navarre.[1][2] The conservative People's Coalition (AP–PDP–UL) was victorious in the Balearic Islands and Cantabria, securing a majority of seats in the later.[3][4] The Communist Party of Spain (PCE) saw an improvement of its results over those obtained in the October 1982 general election, while other minor national parties, such as the Democratic and Social Centre (CDS) and the Liberal Democratic Party (PDL) failed to make significant inroads.[5][6][7]
The elections resulted in the full institutionalization—for the first time in the history of Spain—of an administrative structure of political power between that of the state and of the local councils, represented in the figure of the new autonomous communities.[8]
Regional governments
The following table lists party control in autonomous communities.
Overall results
| Parties and coalitions | Popular vote | Total seats | ||
|---|---|---|---|---|
| Votes | % | |||
| Spanish Socialist Workers' Party (PSOE) | 4,908,728 | 47.86 | 388 | |
| People's Coalition (AP–PDP–UL) | 3,443,557 | 33.57 | 273 | |
| Communist Party of Spain (PCE) | 658,574 | 6.42 | 27 | |
| Democratic and Social Centre (CDS) | 324,654 | 3.17 | 9 | |
| Liberal Democratic Party (PDL) | 139,602 | 1.36 | '2 | |
| Regionalist Aragonese Party (PAR) | 124,018 | 1.21 | 13 | |
| Navarrese People's Union (UPN) | 62,072 | 0.61 | 13 | |
| United Extremadura (EU) | 47,504 | 0.46 | 6 | |
| Majorcan Union (UM) | 46,915 | 0.46 | 6 | |
| Canarian People's Union–Canarian Assembly (UPC–AC) | 46,784 | 0.46 | 2 | |
| Popular Unity (HB) | 28,055 | 0.27 | 6 | |
| Canarian Nationalist Convergence (CNC) | 24,376 | 0.24 | 1 | |
| Regionalist Party of Cantabria (PRC) | 18,767 | 0.18 | 2 | |
| Basque Nationalist Party (EAJ/PNV) | 18,161 | 0.18 | 3 | |
| Socialist Party of Majorca–Socialist Party of the Islands (PSM–PSI) | 16,979 | 0.17 | 2 | |
| Progressive Riojan Party (PRP) | 10,102 | 0.10 | 2 | |
| Majorera Assembly (AM) | 5,551 | 0.05 | 3 | |
| Socialist Party of Menorca (PSM) | 3,732 | 0.04 | 2 | |
| Independent Gomera Group (AGI) | 3,294 | 0.03 | 2 | |
| Menorcan Independent Candidacy (CIM) | 3,250 | 0.03 | 1 | |
| Independent Herrenian Group (AHI) | 944 | 0.01 | 1 | |
| Others | 257,435 | 2.51 | 0 | |
| Blank ballots | 63,592 | 0.62 | ||
| Valid votes | 10,256,646 | 98.86 | ||
| Invalid votes | 118,141 | 1.14 | ||
| Votes cast / turnout | 10,374,787 | 69.68 | ||
| Registered voters | 14,888,251 | |||
Summary by region
Aragon
| Parties and coalitions | Votes | % | ±pp | Seats | +/− | |
|---|---|---|---|---|---|---|
| PSOE | 283,226 | 46.83 | n/a | 33 | n/a | |
| AP–PDP–UL | 136,853 | 22.63 | n/a | 18 | n/a | |
| PAR | 124,018 | 20.51 | n/a | 13 | n/a | |
| PCE | 23,960 | 3.96 | n/a | 1 | n/a | |
| CDS | 19,902 | 3.29 | n/a | 1 | n/a | |
| Others | 12,941 | 2.14 | 0 | ±0 | ||
| Blank ballots | 3,918 | 0.65 | n/a | |||
| Valid votes | 604,818 | 98.58 | n/a | |||
| Invalid votes | 8,732 | 1.42 | n/a | |||
| Votes cast / turnout | 613,550 | 66.74 | n/a | |||
| Registered voters | 919,295 | |||||
Asturias
| Parties and coalitions | Votes | % | ±pp | Seats | +/− | |
|---|---|---|---|---|---|---|
| PSOE | 293,320 | 51.96 | n/a | 26 | n/a | |
| AP–PDP–UL | 170,654 | 30.23 | n/a | 14 | n/a | |
| PCA–PCE | 62,855 | 11.13 | n/a | 5 | n/a | |
| CDS | 19,495 | 3.45 | n/a | 0 | n/a | |
| Others | 15,898 | 2.82 | 0 | ±0 | ||
| Blank ballots | 2,298 | 0.41 | n/a | |||
| Valid votes | 564,520 | 99.34 | n/a | |||
| Invalid votes | 3,751 | 0.66 | n/a | |||
| Votes cast / turnout | 568,271 | 65.04 | n/a | |||
| Registered voters | 873,690 | |||||
Balearics
| Parties and coalitions | Votes | % | ±pp | Seats | +/− | |
|---|---|---|---|---|---|---|
| AP–PDP–UL | 110,629 | 35.58 | n/a | 21 | n/a | |
| PSOE | 107,906 | 34.71 | n/a | 21 | n/a | |
| UM | 46,915 | 15.09 | n/a | 6 | n/a | |
| PSM–PSI | 16,979 | 5.46 | n/a | 2 | n/a | |
| PCIB | 7,669 | 2.47 | n/a | 0 | n/a | |
| CDS | 6,611 | 2.13 | n/a | 0 | n/a | |
| PDL | 3,896 | 1.25 | n/a | 1 | n/a | |
| PSM | 3,732 | 1.20 | n/a | 2 | n/a | |
| CIM | 3,250 | 1.05 | n/a | 1 | n/a | |
| PCOE | 1,509 | 0.49 | n/a | 0 | n/a | |
| Blank ballots | 1,820 | 0.59 | n/a | |||
| Valid votes | 310,916 | 98.46 | n/a | |||
| Invalid votes | 4,879 | 1.54 | n/a | |||
| Votes cast / turnout | 315,795 | 64.67 | n/a | |||
| Registered voters | 488,336 | |||||
Canary Islands
| Parties and coalitions | Votes | % | ±pp | Seats | +/− | |
|---|---|---|---|---|---|---|
| PSOE | 233,991 | 41.50 | n/a | 27 | n/a | |
| AP–PDP–UL | 163,419 | 28.98 | n/a | 17 | n/a | |
| UPC–AC | 46,784 | 8.30 | n/a | 2 | n/a | |
| CDS | 40,789 | 7.23 | n/a | 6 | n/a | |
| PCC | 24,868 | 4.41 | n/a | 1 | n/a | |
| CNC | 24,376 | 4.32 | n/a | 1 | n/a | |
| PPC | 7,676 | 1.36 | n/a | 0 | n/a | |
| AM | 5,551 | 0.98 | n/a | 3 | n/a | |
| AGI | 3,294 | 0.58 | n/a | 2 | n/a | |
| AHI | 944 | 0.17 | n/a | 1 | n/a | |
| Others | 12,130 | 2.15 | 0 | ±0 | ||
| Blank ballots | 0 | 0.00 | n/a | |||
| Valid votes | 563,822 | 97.60 | n/a | |||
| Invalid votes | 13,848 | 2.40 | n/a | |||
| Votes cast / turnout | 577,670 | 62.41 | n/a | |||
| Registered voters | 925,572 | |||||
Cantabria
| Parties and coalitions | Votes | % | ±pp | Seats | +/− | |
|---|---|---|---|---|---|---|
| AP–PDP–UL | 122,748 | 43.99 | n/a | 18 | n/a | |
| PSOE | 107,168 | 38.41 | n/a | 15 | n/a | |
| PRC | 18,767 | 6.73 | n/a | 2 | n/a | |
| PCE | 11,052 | 3.96 | n/a | 0 | n/a | |
| CDS | 7,164 | 2.57 | n/a | 0 | n/a | |
| PDL | 4,474 | 1.60 | n/a | 0 | n/a | |
| AICU | 3,179 | 1.14 | n/a | 0 | n/a | |
| Others | 2,888 | 1.04 | 0 | ±0 | ||
| Blank ballots | 1,569 | 0.56 | n/a | |||
| Valid votes | 279,009 | 98.52 | n/a | |||
| Invalid votes | 4,188 | 1.48 | n/a | |||
| Votes cast / turnout | 283,197 | 73.56 | n/a | |||
| Registered voters | 384,993 | |||||
Castile and León
| Parties and coalitions | Votes | % | ±pp | Seats | +/− | |
|---|---|---|---|---|---|---|
| PSOE | 608,604 | 44.37 | n/a | 42 | n/a | |
| AP–PDP–UL | 543,851 | 39.65 | n/a | 39 | n/a | |
| CDS | 81,741 | 5.96 | n/a | 2 | n/a | |
| PCE | 44,357 | 3.23 | n/a | 0 | n/a | |
| PDL | 37,301 | 2.72 | n/a | 1 | n/a | |
| BAR–PREPAL | 34,398 | 2.51 | n/a | 0 | n/a | |
| Others | 8,233 | 0.60 | 0 | ±0 | ||
| Blank ballots | 13,103 | 0.96 | n/a | |||
| Valid votes | 1,371,588 | 98.51 | n/a | |||
| Invalid votes | 20,815 | 1.49 | n/a | |||
| Votes cast / turnout | 1,392,403 | 69.84 | n/a | |||
| Registered voters | 1,993,809 | |||||
Castilla–La Mancha
| Parties and coalitions | Votes | % | ±pp | Seats | +/− | |
|---|---|---|---|---|---|---|
| PSOE | 416,177 | 46.70 | n/a | 23 | n/a | |
| AP–PDP–UL | 364,676 | 40.92 | n/a | 21 | n/a | |
| PCE | 61,132 | 6.86 | n/a | 0 | n/a | |
| CDS | 26,911 | 3.02 | n/a | 0 | n/a | |
| PDL | 15,890 | 1.78 | n/a | 0 | n/a | |
| PCOE–PCEU | 579 | 0.06 | n/a | 0 | n/a | |
| Blank ballots | 5,823 | 0.65 | n/a | |||
| Valid votes | 891,188 | 98.82 | n/a | |||
| Invalid votes | 10,684 | 1.18 | n/a | |||
| Votes cast / turnout | 901,872 | 73.32 | n/a | |||
| Registered voters | 1,230,011 | |||||
Extremadura
| Parties and coalitions | Votes | % | ±pp | Seats | +/− | |
|---|---|---|---|---|---|---|
| PSOE | 296,939 | 53.02 | n/a | 35 | n/a | |
| AP–PDP–UL | 168,606 | 30.10 | n/a | 20 | n/a | |
| EU | 47,504 | 8.48 | n/a | 6 | n/a | |
| PCE | 36,294 | 6.48 | n/a | 4 | n/a | |
| Others | 8,126 | 1.45 | 0 | ±0 | ||
| Blank ballots | 2,622 | 0.47 | n/a | |||
| Valid votes | 560,091 | 99.09 | n/a | |||
| Invalid votes | 5,153 | 0.91 | n/a | |||
| Votes cast / turnout | 565,244 | 71.90 | n/a | |||
| Registered voters | 786,200 | |||||
La Rioja
| Parties and coalitions | Votes | % | ±pp | Seats | +/− | |
|---|---|---|---|---|---|---|
| PSOE | 63,848 | 47.17 | n/a | 18 | n/a | |
| AP–PDP–UL | 54,121 | 39.98 | n/a | 15 | n/a | |
| PRP | 10,102 | 7.46 | n/a | 2 | n/a | |
| CDS | 3,264 | 2.41 | n/a | 0 | n/a | |
| PCE | 2,934 | 2.17 | n/a | 0 | n/a | |
| Blank ballots | 1,090 | 0.81 | n/a | |||
| Valid votes | 135,359 | 98.83 | n/a | |||
| Invalid votes | 1,605 | 1.17 | n/a | |||
| Votes cast / turnout | 136,964 | 70.24 | n/a | |||
| Registered voters | 194,994 | |||||
Madrid
| Parties and coalitions | Votes | % | ±pp | Seats | +/− | |
|---|---|---|---|---|---|---|
| PSOE | 1,181,277 | 50.47 | n/a | 51 | n/a | |
| AP–PDP–UL | 798,853 | 34.13 | n/a | 34 | n/a | |
| PCE | 207,058 | 8.85 | n/a | 9 | n/a | |
| CDS | 73,124 | 3.12 | n/a | 0 | n/a | |
| PDL | 43,309 | 1.85 | n/a | 0 | n/a | |
| Others | 23,269 | 0.99 | 0 | ±0 | ||
| Blank ballots | 13,735 | 0.59 | n/a | |||
| Valid votes | 2,340,625 | 99.29 | n/a | |||
| Invalid votes | 16,800 | 0.71 | n/a | |||
| Votes cast / turnout | 2,357,425 | 69.71 | n/a | |||
| Registered voters | 3,381,610 | |||||
Murcia
| Parties and coalitions | Votes | % | ±pp | Seats | +/− | |
|---|---|---|---|---|---|---|
| PSOE | 238,968 | 52.23 | n/a | 26 | n/a | |
| AP–PDP–UL | 162,074 | 35.42 | n/a | 16 | n/a | |
| PCE | 32,113 | 7.02 | n/a | 1 | n/a | |
| PCAN | 12,967 | 2.83 | n/a | 0 | n/a | |
| CDS | 5,224 | 1.14 | n/a | 0 | n/a | |
| Others | 3,603 | 0.79 | 0 | ±0 | ||
| Blank ballots | 2,608 | 0.57 | n/a | |||
| Valid votes | 457,557 | 98.99 | n/a | |||
| Invalid votes | 4,655 | 1.01 | n/a | |||
| Votes cast / turnout | 462,212 | 68.47 | n/a | |||
| Registered voters | 675,082 | |||||
Navarre
| Parties and coalitions | Votes | % | ±pp | Seats | +/− | |
|---|---|---|---|---|---|---|
| PSOE | 94,737 | 35.63 | +16.69 | 20 | +5 | |
| UPN | 62,072 | 23.34 | +7.35 | 13 | ±0 | |
| AP–PDP–UL | 37,554 | 14.12 | New | 8 | +8 | |
| HB | 28,055 | 10.55 | –0.53 | 6 | –3 | |
| EAJ/PNV | 18,161 | 6.83 | +1.79 | 3 | ±0 | |
| Auzolan | 8,356 | 3.14 | +0.44 | 0 | ±0 | |
| PC | 6,733 | 2.53 | –2.24 | 0 | –1 | |
| EE | 6,292 | 2.37 | –0.54 | 0 | –1 | |
| PCE/EPK | 1,712 | 0.64 | –1.80 | 0 | ±0 | |
| LC | 409 | 0.15 | New | 0 | ±0 | |
| UCD | n/a | n/a | –26.69 | 0 | –20 | |
| Amaiur | n/a | n/a | –6.78 | 0 | –7 | |
| IFN | n/a | n/a | –1.46 | 0 | –1 | |
| Blank ballots | 1,826 | 0.69 | +0.28 | |||
| Valid votes | 265,907 | 98.83 | +0.15 | |||
| Invalid votes | 3,135 | 1.17 | –0.15 | |||
| Votes cast / turnout | 269,042 | 70.86 | +0.10 | |||
| Registered voters | 379,692 | |||||
Valencian Community
| Parties and coalitions | Votes | % | ±pp | Seats | +/− | |
|---|---|---|---|---|---|---|
| PSOE | 982,567 | 51.41 | n/a | 51 | n/a | |
| AP–PDP–UL–UV | 609,519 | 31.89 | n/a | 32 | n/a | |
| PCE–PCPV | 142,570 | 7.46 | n/a | 6 | n/a | |
| UPV | 58,712 | 3.07 | n/a | 0 | n/a | |
| CDS | 36,015 | 1.88 | n/a | 0 | n/a | |
| PDL | 29,788 | 1.56 | n/a | 0 | n/a | |
| Others | 38,895 | 2.04 | 0 | ±0 | ||
| Blank ballots | 13,180 | 0.69 | n/a | |||
| Valid votes | 1,911,246 | 98.97 | n/a | |||
| Invalid votes | 19,896 | 1.03 | n/a | |||
| Votes cast / turnout | 1,931,142 | 72.74 | n/a | |||
| Registered voters | 2,654,967 | |||||
Notes
- The UCD was dissolved as a political party in February 1983,[9] with its regional presidents and elected officials maintaining their offices either as independents or joining other parties ahead of the May 1983 regional elections.
References
- "El PSOE domina 12 de las 17 comunidades autónomas". El País (in Spanish). 9 May 1983. Retrieved 11 December 2019.
- "Los resultados de Córdoba, Cantabria, Castilla-León y Navarra empañaron la victoria esperada por el PSOE". El País (in Spanish). 9 May 1983. Retrieved 11 December 2019.
- "Fraga: "Me retiraré cuando Dios y el pueblo me lo exijan"". El País (in Spanish). 9 May 1983. Retrieved 11 December 2019.
- "Serán necesarios pactos para gobernar en cuatro comunidades autónomas". El País (in Spanish). 11 May 1983. Retrieved 11 December 2019.
- "Euforia en el PCE, que ha visto duplicados los votos con respecto al 28-O". El País (in Spanish). 9 May 1983. Retrieved 11 December 2019.
- "Suárez y Garrigues, entre la satisfacción y la resignación". El País (in Spanish). 9 May 1983. Retrieved 11 December 2019.
- "Para Europa, crece el predominio socialista". El País (in Spanish). 10 May 1983. Retrieved 11 December 2019.
- "Las elecciones autonómicas institucionalizan por primera vez, en toda España un nuevo escalón de poder político". El País (in Spanish). 16 April 1983. Retrieved 14 December 2019.
- "La crisis de UCD culmina con la decisión de disolverse como partido político". El País (in Spanish). 19 February 1983. Retrieved 13 December 2019.
External links
- www.juntaelectoralcentral.es (in Spanish). Central Electoral Commission – Regional elections
- www.argos.gva.es (in Spanish). Argos Information Portal – Electoral Historical Archive
- www.historiaelectoral.com (in Spanish and Catalan). Electoral History – Regional elections since 1980
| General elections |
|
|---|---|
| Presidential elections | |
| European elections | |
| Local elections | |
| Regional elections | |
| Referendums | |
| |