Socialist Party of Cantabria
The Socialist Party of Cantabria-PSOE (Spanish: Partido Socialista de Cantabria-PSOE, PSC-PSOE) is the Cantabrian federation of the Spanish Socialist Workers' Party (PSOE), the main centre-left party in Spain since the 1970s.
Socialist Party of the Cantabria Partido Socialista de Cantabria | |
|---|---|
| President | Eduardo Echevarría |
| Secretary-General | Pablo Zuloaga |
| Headquarters | Calle Bonifaz, 18. 39003 Santander |
| Youth wing | Socialist Youth of Cantabria |
| Membership (2017) | 2,815[1] |
| Ideology | Social democracy Progressivism |
| Political position | Centre-left |
| National affiliation | Spanish Socialist Workers' Party |
| Congress of Deputies | 1 / 5 (Cantabrian seats) |
| Spanish Senate | 1 / 5 (Cantabrian seats) |
| Parliament of Cantabria | 7 / 35 |
| Mayors (2015-2019)[2] | 23 / 101 |
| Local seats (2015-2019) | 190 / 1,042 |
| Website | |
| www | |
| |
Electoral performance
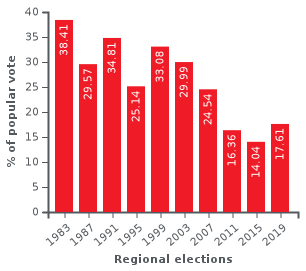
Parliament of Cantabria
| Parliament of Cantabria | ||||||||
| Election | Vote | % | Score | Seats | +/– | Leader | Status in legislature | |
|---|---|---|---|---|---|---|---|---|
| Status | Period | |||||||
| 1983 | 107,168 | 38.41% | 2nd | 15 / 35 |
— | Jaime Blanco | Opposition | 1983–1990 |
| 1987 | 87,230 | 29.57% | 2nd | 13 / 39 |
||||
| Majority coalition (PSOE–PP–PRC–CDS) | 1990–1991 | |||||||
| 1991 | 102,958 | 34.81% | 1st | 16 / 39 |
Opposition | 1991–2003 | ||
| 1995 | 80,464 | 25.14% | 2nd | 10 / 39 |
Julio Neira | |||
| 1999 | 105,004 | 33.08% | 2nd | 14 / 39 |
Ángel Duque | |||
| 2003 | 103,608 | 29.99% | 2nd | 13 / 39 |
Dolores Gorostiaga | Majority coalition (PRC–PSOE) | 2003–2011 | |
| 2007 | 84,982 | 24.54% | 3rd | 10 / 39 |
||||
| 2011 | 55,541 | 16.36% | 3rd | 7 / 39 |
Opposition | 2011–2015 | ||
| 2015 | 45,653 | 14.04% | 3rd | 5 / 35 |
Eva Díaz Tezanos | Minority coalition (PRC–PSOE) | 2015–2019 | |
| 2019 | 57,383 | 17.61% | 3rd | 7 / 35 |
Pablo Zuloaga | Majority coalition (PRC–PSOE) | 2019–present | |
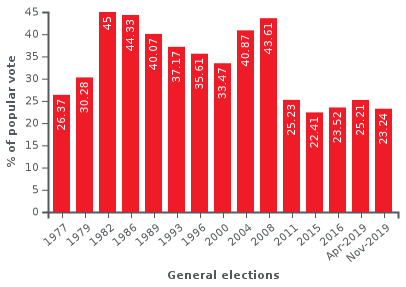
Cortes Generales
| Cortes Generales | |||||||
| Election | Cantabria | ||||||
|---|---|---|---|---|---|---|---|
| Congress | Senate | ||||||
| Vote | % | Score | Seats | +/– | Seats | +/– | |
| 1977 | 67,611 | 26.37% | 2nd | 1 / 5 |
— | 1 / 4 |
— |
| 1979 | 78,512 | 30.28% | 2nd | 2 / 5 |
1 / 4 |
||
| 1982 | 135,987 | 45.00% | 1st | 3 / 5 |
3 / 4 |
||
| 1986 | 129,041 | 44.33% | 1st | 3 / 5 |
3 / 4 |
||
| 1989 | 119,352 | 40.07% | 1st | 3 / 5 |
3 / 4 |
||
| 1993 | 122,418 | 37.17% | 1st | 3 / 5 |
3 / 4 |
||
| 1996 | 123,940 | 35.61% | 2nd | 2 / 5 |
1 / 4 |
||
| 2000 | 111,556 | 33.47% | 2nd | 2 / 5 |
1 / 4 |
||
| 2004 | 149,906 | 40.87% | 2nd | 2 / 5 |
1 / 4 |
||
| 2008 | 161,279 | 43.61% | 2nd | 2 / 5 |
1 / 4 |
||
| 2011 | 88,624 | 25.23% | 2nd | 1 / 5 |
1 / 4 |
||
| 2015 | 78,460 | 22.41% | 2nd | 1 / 5 |
1 / 4 |
||
| 2016 | 79,407 | 23.52% | 2nd | 1 / 5 |
1 / 4 |
||
| Apr-2019 | 90,534 | 25.21% | 1st | 2 / 5 |
3 / 4 |
||
| Nov-2019 | 76,028 | 23.24% | 2nd | 1 / 5 |
1 / 4 |
||
References
- 1.100.000 papeletas, 5.000 urnas y 187.949 militantes: todo listo para las primarias. El Confidencial, 19/05/2017.
- Resultados y alcaldes en los 101 municipios de Cantabria constituidos hoy. El Diario Montañés, 13/06/2015.
This article is issued from Wikipedia. The text is licensed under Creative Commons - Attribution - Sharealike. Additional terms may apply for the media files.