1999 Spanish regional elections
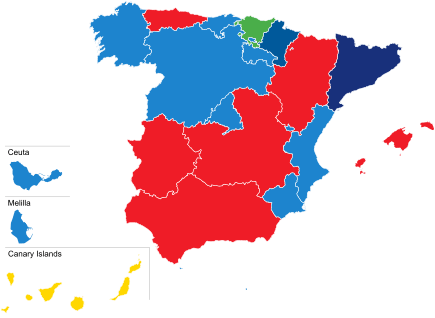
The 1999 Spanish regional elections were held on Sunday, 13 June 1999, to elect the regional parliaments of thirteen of the seventeen autonomous communities—Aragon, Asturias, the Balearic Islands, the Canary Islands, Cantabria, Castile and León, Castilla–La Mancha, Extremadura, La Rioja, Madrid, Murcia, Navarre and the Valencian Community, not including Andalusia, the Basque Country, Catalonia and Galicia, which had separate electoral cycles. 784 of 1,178 seats in the regional parliaments were up for election, as well as the 50 seats in the regional assemblies of Ceuta and Melilla. The elections were held simultaneously with local elections all throughout Spain, as well as the 1999 European Parliament election.
| ||
784 seats in the regional parliaments of Aragon, Asturias, Balearic Islands, Canary Islands, Cantabria, Castile and León, Castilla–La Mancha, Extremadura, La Rioja, Madrid, Murcia, Navarre and Valencian Community 50 seats in the regional assemblies of Ceuta and Melilla | ||
|---|---|---|
| Registered | 18,265,203 | |
| Turnout | 12,017,085 (65.8%) | |
|
| ||
 | ||
Election date
Determination of election day varied depending on the autonomous community, with each one having competency to establish its own regulations. Typically, thirteen out of the seventeen autonomous communities—all but Andalusia, the Basque Country, Catalonia and Galicia—had their elections fixed for the fourth Sunday of May every four years, to be held together with nationwide local elections. Legal amendments introduced in 1998 allowed for these elections to be held together with European Parliament elections, in the event that they were scheduled for within a four month-timespan.[1][2]
In some cases, regional presidents had the prerogative to dissolve the regional parliament and call for extra elections at a different time, but newly elected assemblies were restricted to serving out what remained of their previous four-year terms without altering the period to their next ordinary election.[3]
Regional governments
The following table lists party control in autonomous communities. Gains for a party are highlighted in that party's colour.
Overall results
| Parties and coalitions | Popular vote | Seats | ||||
|---|---|---|---|---|---|---|
| Votes | % | ACm. | ACt. | Total | ||
| People's Party (PP) | 5,219,390 | 43.72 | 350 | 13 | 363 | |
| Spanish Socialist Workers' Party–Progressives (PSOE–p) | 4,284,324 | 35.89 | 299 | 4 | 303 | |
| United Left (IU) | 697,555 | 5.84 | 28 | 0 | 28 | |
| Canarian Coalition (CC) | 306,658 | 2.57 | 24 | 0 | 24 | |
| Navarrese People's Union (UPN) | 125,497 | 1.05 | 22 | 0 | 22 | |
| Aragonese Party (PAR) | 86,519 | 0.72 | 10 | 0 | 10 | |
| Aragonese Union (CHA) | 72,101 | 0.60 | 5 | 0 | 5 | |
| Leonese People's Union (UPL) | 54,158 | 0.45 | 3 | 0 | 3 | |
| Basque Citizens (EH) | 47,271 | 0.40 | 8 | 0 | 8 | |
| Asturian Renewal Union (URAS) | 44,261 | 0.37 | 3 | 0 | 3 | |
| Regionalist Party of Cantabria (PRC) | 42,896 | 0.36 | 6 | 0 | 6 | |
| PSM–Nationalist Agreement (PSM–EN) | 42,748 | 0.36 | 5 | 0 | 5 | |
| Majorcan Union (UM) | 26,682 | 0.22 | 3 | 0 | 3 | |
| Convergence of Democrats of Navarre (CDN) | 20,821 | 0.17 | 3 | 0 | 3 | |
| Commoners' Land–Castilian Nationalist Party (TC–PNC) | 20,274 | 0.17 | 1 | 0 | 1 | |
| Liberal Independent Group (GIL) | 20,123 | 0.17 | 0 | 19 | 19 | |
| Progressive Pact+Coalition of Progressive Organizations (Pacte+COP) | 17,697 | 0.15 | 7 | 0 | 7 | |
| Basque Solidarity–Basque Nationalist Party (EA–PNV) | 16,512 | 0.14 | 3 | 0 | 3 | |
| Riojan Party (PR) | 9,004 | 0.08 | 2 | 0 | 2 | |
| Coalition for Melilla (CpM) | 5,833 | 0.05 | 0 | 5 | 5 | |
| Democratic and Social Party of Ceuta (PDSC) | 3,340 | 0.03 | 0 | 3 | 3 | |
| Melillan People's Union (UPM) | 3,258 | 0.03 | 0 | 3 | 3 | |
| Independent Party of Melilla (PIM) | 2,941 | 0.02 | 0 | 3 | 3 | |
| Independent Herrenian Group (AHI) | 2,773 | 0.02 | 2 | 0 | 2 | |
| Others | 544,299 | 4.56 | 0 | 0 | 0 | |
| Blank ballots | 221,450 | 1.85 | ||||
| Total | 11,938,385 | 784 | 50 | 834 | ||
| Valid votes | 11,938,385 | 99.35 | ||||
| Invalid votes | 78,700 | 0.65 | ||||
| Votes cast / turnout | 12,017,085 | 65.79 | ||||
| Registered voters | 18,265,203 | |||||
Summary by region
Aragon
| Parties and coalitions | Votes | % | ±pp | Seats | +/− | |
|---|---|---|---|---|---|---|
| PP | 249,458 | 38.21 | +0.71 | 28 | +1 | |
| PSOE | 201,117 | 30.81 | +5.09 | 23 | +4 | |
| PAR | 86,519 | 13.25 | –7.18 | 10 | –4 | |
| CHA | 72,101 | 11.04 | +6.19 | 5 | +3 | |
| IU | 25,040 | 3.86 | –5.36 | 1 | –4 | |
| Others | 4,976 | 0.76 | 0 | ±0 | ||
| Blank ballots | 13,599 | 2.08 | +0.50 | |||
| Valid votes | 652,810 | 99.29 | –0.11 | |||
| Invalid votes | 4,654 | 0.71 | +0.11 | |||
| Votes cast / turnout | 657,464 | 64.60 | –6.52 | |||
| Registered voters | 1,017,735 | |||||
Asturias
| Parties and coalitions | Votes | % | ±pp | Seats | +/− | |
|---|---|---|---|---|---|---|
| PSOE | 284,972 | 46.00 | +12.17 | 24 | +7 | |
| PP | 200,164 | 32.31 | –9.69 | 15 | –6 | |
| IU | 55,747 | 9.00 | –7.42 | 3 | –3 | |
| URAS | 44,261 | 7.14 | New | 3 | +3 | |
| PAS | 15,998 | 2.58 | –0.61 | 0 | –1 | |
| Others | 8,624 | 1.39 | 0 | ±0 | ||
| Blank ballots | 9,720 | 1.57 | +0.39 | |||
| Valid votes | 619,486 | 99.40 | –0.01 | |||
| Invalid votes | 3,756 | 0.60 | +0.01 | |||
| Votes cast / turnout | 623,242 | 63.62 | –5.43 | |||
| Registered voters | 979,618 | |||||
Balearic Islands
| Parties and coalitions | Votes | % | ±pp | Seats | +/− | |
|---|---|---|---|---|---|---|
| PP | 160,545 | 44.01 | –0.76 | 28 | –2 | |
| PSIB–PSOE | 80,327 | 22.02 | +0.77 | 13 | +1 | |
| PSM–EN | 42,748 | 11.72 | –0.33 | 5 | –1 | |
| UM | 26,682 | 7.31 | +1.99 | 3 | +1 | |
| EU–EV | 19,793 | 5.43 | –3.14 | 3 | ±0 | |
| Pacte+COP | 17,697 | 4.85 | +0.77 | 7 | +2 | |
| Others | 10,262 | 2.81 | 0 | ±0 | ||
| Blank ballots | 6,777 | 1.86 | +0.50 | |||
| Valid votes | 364,831 | 99.22 | –0.15 | |||
| Invalid votes | 2,852 | 0.78 | +0.15 | |||
| Votes cast / turnout | 367,683 | 57.50 | –6.06 | |||
| Registered voters | 639,398 | |||||
Canary Islands
| Parties and coalitions | Votes | % | ±pp | Seats | +/− | |
|---|---|---|---|---|---|---|
| CC | 306,658 | 36.93 | +4.13 | 24 | +3 | |
| PP | 225,316 | 27.13 | –3.94 | 15 | –3 | |
| PSOE | 199,503 | 24.03 | +0.95 | 19 | +3 | |
| FNC | 39,947 | 4.81 | +1.81 | 0 | –4 | |
| IUC | 22,768 | 2.74 | –2.36 | 0 | ±0 | |
| LVC | 12,146 | 1.46 | New | 0 | ±0 | |
| AHI | 2,773 | 0.33 | +0.07 | 2 | +1 | |
| Others | 8,683 | 1.05 | 0 | ±0 | ||
| Blank ballots | 12,558 | 1.51 | +0.37 | |||
| Valid votes | 830,352 | 99.42 | –0.01 | |||
| Invalid votes | 4,829 | 0.58 | +0.01 | |||
| Votes cast / turnout | 835,181 | 62.74 | –1.46 | |||
| Registered voters | 1,331,110 | |||||
Cantabria
| Parties and coalitions | Votes | % | ±pp | Seats | +/− | |
|---|---|---|---|---|---|---|
| PP | 134,924 | 42.50 | +10.00 | 19 | +6 | |
| PSOE–p | 105,004 | 33.08 | +7.94 | 14 | +4 | |
| PRC | 42,896 | 13.51 | –1.05 | 6 | ±0 | |
| IUC | 11,707 | 3.69 | –3.67 | 0 | –3 | |
| UPCA | 9,743 | 3.07 | –13.55 | 0 | –7 | |
| Others | 5,442 | 1.71 | 0 | ±0 | ||
| Blank ballots | 7,717 | 2.43 | +0.50 | |||
| Valid votes | 317,433 | 99.21 | +0.02 | |||
| Invalid votes | 2,514 | 0.79 | –0.02 | |||
| Votes cast / turnout | 319,947 | 68.78 | –5.27 | |||
| Registered voters | 465,168 | |||||
Castile and León
| Parties and coalitions | Votes | % | ±pp | Seats | +/− | |
|---|---|---|---|---|---|---|
| PP | 737,982 | 50.45 | –1.75 | 48 | –2 | |
| PSOE | 483,675 | 33.06 | +3.35 | 30 | +3 | |
| IUCyL | 79,390 | 5.43 | –4.15 | 1 | –4 | |
| UPL | 54,158 | 3.70 | +1.15 | 3 | +1 | |
| TC–PNC | 20,274 | 1.39 | +0.77 | 1 | +1 | |
| Others | 48,299 | 3.30 | 0 | ±0 | ||
| Blank ballots | 39,036 | 2.67 | +0.84 | |||
| Valid votes | 1,462,814 | 99.05 | –0.06 | |||
| Invalid votes | 14,044 | 0.95 | +0.06 | |||
| Votes cast / turnout | 1,476,858 | 67.58 | –6.01 | |||
| Registered voters | 2,185,507 | |||||
Castilla–La Mancha
| Parties and coalitions | Votes | % | ±pp | Seats | +/− | |
|---|---|---|---|---|---|---|
| PSOE–p | 561,332 | 53.42 | +7.72 | 26 | +2 | |
| PP | 424,531 | 40.40 | –3.90 | 21 | –1 | |
| IU–ICAM | 35,881 | 3.41 | –4.19 | 0 | –1 | |
| Others | 14,191 | 1.35 | 0 | ±0 | ||
| Blank ballots | 14,929 | 1.42 | +0.37 | |||
| Valid votes | 1,050,864 | 99.32 | +0.04 | |||
| Invalid votes | 7,146 | 0.68 | –0.04 | |||
| Votes cast / turnout | 1,058,010 | 74.85 | –3.98 | |||
| Registered voters | 1,413,503 | |||||
Extremadura
| Parties and coalitions | Votes | % | ±pp | Seats | +/− | |
|---|---|---|---|---|---|---|
| PSOE–p | 313,417 | 48.48 | +4.54 | 34 | +3 | |
| PP | 258,657 | 40.01 | +0.55 | 28 | +1 | |
| IU–CE | 39,132 | 6.05 | –4.49 | 3 | –3 | |
| EU | 10,783 | 1.67 | New | 0 | ±0 | |
| CREx–PREx | 7,437 | 1.15 | –2.67 | 0 | –1 | |
| Others | 9,648 | 1.49 | 0 | ±0 | ||
| Blank ballots | 7,408 | 1.15 | +0.27 | |||
| Valid votes | 646,482 | 99.38 | +0.04 | |||
| Invalid votes | 4,045 | 0.62 | –0.04 | |||
| Votes cast / turnout | 650,527 | 73.44 | –4.89 | |||
| Registered voters | 885,753 | |||||
La Rioja
| Parties and coalitions | Votes | % | ±pp | Seats | +/− | |
|---|---|---|---|---|---|---|
| PP | 80,088 | 51.26 | +1.82 | 18 | +1 | |
| PSOE | 55,126 | 35.28 | +1.19 | 13 | +1 | |
| PR | 9,004 | 5.76 | –0.94 | 2 | ±0 | |
| IU | 6,104 | 3.91 | –3.30 | 0 | –2 | |
| LV | 1,971 | 1.26 | New | 0 | ±0 | |
| MASH | 418 | 0.27 | New | 0 | ±0 | |
| Blank ballots | 3,535 | 2.26 | +0.53 | |||
| Valid votes | 156,246 | 99.13 | –0.17 | |||
| Invalid votes | 1,377 | 0.87 | +0.17 | |||
| Votes cast / turnout | 157,623 | 68.66 | –7.50 | |||
| Registered voters | 229,569 | |||||
Madrid
| Parties and coalitions | Votes | % | ±pp | Seats | +/− | |
|---|---|---|---|---|---|---|
| PP | 1,324,596 | 51.07 | +0.09 | 55 | +1 | |
| PSOE–p | 944,819 | 36.43 | +6.71 | 39 | +7 | |
| IU | 199,488 | 7.69 | –8.34 | 8 | –9 | |
| Others | 70,251 | 2.71 | 0 | ±0 | ||
| Blank ballots | 54,341 | 2.10 | +0.76 | |||
| Valid votes | 2,593,495 | 99.51 | –0.11 | |||
| Invalid votes | 12,830 | 0.49 | +0.11 | |||
| Votes cast / turnout | 2,606,325 | 60.88 | –9.51 | |||
| Registered voters | 4,281,075 | |||||
Murcia
| Parties and coalitions | Votes | % | ±pp | Seats | +/− | |
|---|---|---|---|---|---|---|
| PP | 323,446 | 52.84 | +0.61 | 26 | ±0 | |
| PSOE | 219,798 | 35.91 | +4.04 | 18 | +3 | |
| IURM | 42,839 | 7.00 | –5.46 | 1 | –3 | |
| Others | 17,148 | 2.80 | 0 | ±0 | ||
| Blank ballots | 8,839 | 1.44 | +0.33 | |||
| Valid votes | 612,070 | 99.30 | +0.16 | |||
| Invalid votes | 4,327 | 0.70 | –0.16 | |||
| Votes cast / turnout | 616,397 | 67.66 | –7.61 | |||
| Registered voters | 911,054 | |||||
Navarre
| Parties and coalitions | Votes | % | ±pp | Seats | +/− | |
|---|---|---|---|---|---|---|
| UPN | 125,497 | 41.37 | +10.02 | 22 | +5 | |
| PSN–PSOE | 61,531 | 20.28 | –0.59 | 11 | ±0 | |
| EH | 47,271 | 15.58 | +4.17 | 8 | +3 | |
| IU/EB | 20,879 | 6.88 | –2.47 | 3 | –2 | |
| CDN | 20,821 | 6.86 | –8.70 | 3 | –7 | |
| EA–PNV | 16,512 | 5.44 | –0.12 | 3 | +1 | |
| Others | 3,704 | 1.22 | 0 | ±0 | ||
| Blank ballots | 7,126 | 2.35 | +0.44 | |||
| Valid votes | 303,341 | 99.17 | –0.04 | |||
| Invalid votes | 2,539 | 0.83 | +0.04 | |||
| Votes cast / turnout | 305,880 | 66.25 | –2.15 | |||
| Registered voters | 461,729 | |||||
Valencian Community
| Parties and coalitions | Votes | % | ±pp | Seats | +/− | |
|---|---|---|---|---|---|---|
| PP | 1,085,011 | 47.88 | +5.05 | 49 | +7 | |
| PSOE–p | 768,548 | 33.91 | –0.07 | 35 | +3 | |
| EUPV | 137,212 | 6.05 | –5.48 | 5 | –5 | |
| UV | 106,119 | 4.68 | –2.33 | 0 | –5 | |
| BNV–EV | 102,700 | 4.53 | +1.82 | 0 | ±0 | |
| Others | 31,517 | 1.39 | 0 | ±0 | ||
| Blank ballots | 35,168 | 1.55 | +0.50 | |||
| Valid votes | 2,266,275 | 99.41 | –0.03 | |||
| Invalid votes | 13,530 | 0.59 | +0.03 | |||
| Votes cast / turnout | 2,279,805 | 67.81 | –8.22 | |||
| Registered voters | 3,361,989 | |||||
Autonomous cities
Ceuta
| Parties and coalitions | Votes | % | ±pp | Seats | +/− | |
|---|---|---|---|---|---|---|
| GIL | 12,721 | 38.15 | New | 12 | +12 | |
| PP | 9,334 | 27.99 | –2.86 | 8 | –1 | |
| PDSC | 3,340 | 10.02 | +4.98 | 3 | +2 | |
| PSOE | 2,481 | 7.44 | –5.68 | 2 | –1 | |
| PSPC | 1,467 | 4.40 | –3.63 | 0 | –2 | |
| IU | 1,321 | 3.96 | +2.19 | 0 | ±0 | |
| CEU | 1,297 | 3.89 | –10.62 | 0 | –4 | |
| PFC | 625 | 1.87 | –18.24 | 0 | –6 | |
| PC | 356 | 1.07 | +0.77 | 0 | ±0 | |
| Blank ballots | 400 | 1.20 | +0.22 | |||
| Valid votes | 33,342 | 99.51 | –0.07 | |||
| Invalid votes | 163 | 0.49 | +0.07 | |||
| Votes cast / turnout | 33,505 | 61.35 | +4.70 | |||
| Registered voters | 54,609 | |||||
Melilla
| Parties and coalitions | Votes | % | ±pp | Seats | +/− | |
|---|---|---|---|---|---|---|
| GIL | 7,402 | 25.93 | New | 7 | +7 | |
| CpM | 5,833 | 20.44 | +4.97 | 5 | +1 | |
| PP | 5,338 | 18.70 | –28.50 | 5 | –9 | |
| UPM | 3,258 | 11.41 | +1.51 | 3 | +1 | |
| PIM | 2,941 | 10.30 | New | 3 | +3 | |
| PSOE | 2,674 | 9.37 | –10.51 | 2 | –3 | |
| PSDM | 498 | 1.74 | New | 0 | ±0 | |
| IU | 254 | 0.89 | –1.83 | 0 | ±0 | |
| Aprome | 49 | 0.17 | –3.66 | 0 | ±0 | |
| Blank ballots | 297 | 1.04 | +0.03 | |||
| Valid votes | 28,544 | 99.67 | +0.09 | |||
| Invalid votes | 94 | 0.33 | –0.09 | |||
| Votes cast / turnout | 28,638 | 60.44 | –1.29 | |||
| Registered voters | 47,386 | |||||
References
- "General Electoral System Organic Law of 1985". Organic Law No. 5 of 19 June 1985. Official State Gazette (in Spanish). Retrieved 28 December 2016.
- "Representation of the people Institutional Act". juntaelectoralcentral.es. Central Electoral Commission. Retrieved 16 June 2017.
- "Un paso más hacia la ruptura de la homogeneidad del calendario electoral de las comunidades autónomas: la reforma de la Ley Orgánica 13/1982, de 10 de agosto, de Reintegración y Amejoramiento del Régimen Foral de Navarra" [A further step towards breaking the homogeneity of the electoral calendar of the autonomous communities: the reform of the Organic Law 13/1982, of August 10, on Reintegration and Improvement of the Foral Regime of Navarre] (PDF). gencat.cat (in Spanish). Institut d'Estudis Autonòmics. Archived from the original on 2 April 2015. Retrieved 5 September 2017.CS1 maint: BOT: original-url status unknown (link)
External links
- www.juntaelectoralcentral.es (in Spanish). Central Electoral Commission – Regional elections
- www.argos.gva.es (in Spanish). Argos Information Portal – Electoral Historical Archive
- www.historiaelectoral.com (in Spanish and Catalan). Electoral History – Regional elections since 1980
| General elections |
|
|---|---|
| Presidential elections | |
| European elections | |
| Local elections | |
| Regional elections | |
| Referendums | |
| |