1919 Italian general election
General elections were held in Italy on 16 November 1919.[1] The fragmented Liberal governing coalition lost the absolute majority in the Chamber of Deputies, due to the success of the Italian Socialist Party and the Italian People's Party.
| |||||||||||||||||||||||||||||||||
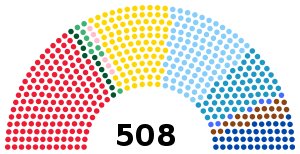
All 508 seats in the Chamber of Deputies | |||||||||||||||||||||||||||||||||
|---|---|---|---|---|---|---|---|---|---|---|---|---|---|---|---|---|---|---|---|---|---|---|---|---|---|---|---|---|---|---|---|---|---|
| Turnout | 56.6% | ||||||||||||||||||||||||||||||||
| |||||||||||||||||||||||||||||||||
 | |||||||||||||||||||||||||||||||||


Electoral system
The old system of using single-member constituencies with two-round majority voting was abolished and replaced with proportional representation in 58 constituencies with between 5 and 20 members.[2]
Historical background
The election took place in the middle of Biennio Rosso ("Red Biennium") a two-year period, between 1919 and 1920, of intense social conflict in Italy, following the First World War.[3] The revolutionary period was followed by the violent reaction of the Fascist blackshirts militia and eventually by the March on Rome of Benito Mussolini in 1922.
The Biennio Rosso took place in a context of economic crisis at the end of the war, with high unemployment and political instability. It was characterized by mass strikes, worker manifestations as well as self-management experiments through land and factories occupations.[3] In Turin and Milan, workers councils were formed and many factory occupations took place under the leadership of anarcho-syndicalists. The agitations also extended to the agricultural areas of the Padan plain and were accompanied by peasant strikes, rural unrests and guerrilla conflicts between left-wing and right-wing militias.
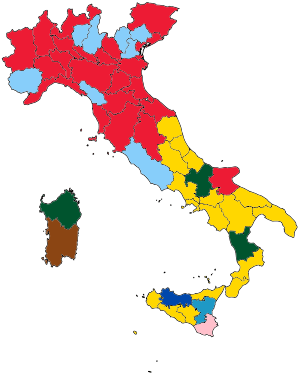
In the general election, the fragmented Liberal governing coalition lost the absolute majority in the Chamber of Deputies, due to the success of the Italian Socialist Party and the Italian People's Party. The Socialists of Nicola Bombacci received the most votes in almost every region and especially in Emilia-Romagna (60.0%), Piedmont (49.7%), Lombardy (45.9%), Tuscany (41.7%) and Umbria (46.5%), while the People's Party were the largest party in Veneto (42.6%) and came second in Lombardy (30.1%) and the Liberal lists were stronger in Southern Italy (over 50% in Abruzzo, Campania, Basilicata, Apulia, Calabria and Sicily).[4]
Parties and leaders
| Party | Ideology | Leader | |
|---|---|---|---|
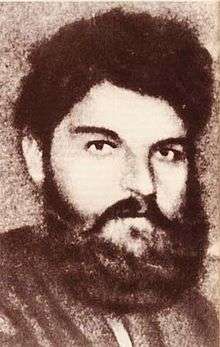
| Italian Socialist Party (PSI) | Socialism, Revolutionary socialism | Nicola Bombacci | |
| Italian People's Party (PPI) | Christian democracy, Popularism | Luigi Sturzo | |
| Liberals, Democrats and Radicals (LDR) | Liberalism, Radicalism | Vittorio Emanuele Orlando | |
| Democratic Party (PD) | Social liberalism, Radicalism | Giovanni Antonio Colonna | |
| Liberal Union (UL) | Liberalism, Centrism | Giovanni Giolitti | |
| Combatants' Party (PdC) | Italian nationalism, Veteran interests | several | |
| Radical Party (PR) | Radicalism, Republicanism | Francesco Saverio Nitti | |
| Economic Party (PE) | Conservatism, Liberism | Ferdinando Bocca | |
| Reformist Socialist Party (PSRI) | Social democracy, Reformism | Leonida Bissolati | |
| Italian Republican Party (PRI) | Republicanism, Radicalism | Salvatore Barzilai | |
Coalitions
| Coalition | Parties | ||
|---|---|---|---|
| Italian People's Party (PPI) | |||
| Liberals, Democrats and Radicals (LDR) | |||
| Democratic Party (PD) | |||
| Liberal Union (UL) | |||
| Radical Party (PR) | |||
| Italian Reformist Socialist Party (PSRI) | |||
| Italian Socialist Party (PSI) | |||
| Combatants' Party (PdC) | |||
| Economic Party (PE) | |||
| Italian Republican Party (PRI) | |||
Voter turnout
| Region | Turnout |
|---|---|
| Abruzzi e Molise | 51.3% |
| Apulia | 54.2% |
| Basilicata | 50.9% |
| Calabria | 47.9% |
| Campania | 49.9 |
| Emilia | 71.5% |
| Lazio | 47.5% |
| Liguria | 60.5% |
| Lombardy | 67.4% |
| Marche | 47.6% |
| Piedmont | 63.0% |
| Sardinia | 55.5% |
| Sicily | 44.5% |
| Tuscany | 61.3% |
| Umbria | 56.2% |
| Veneto | 51.5% |
| Total | 56.6% |
| Source: Ministry of the Interior | |
Results
 | |||||
| Party | Votes | % | Seats | +/− | |
|---|---|---|---|---|---|
| Italian Socialist Party | 1,834,792 | 32.3 | 156 | +104 | |
| Italian People's Party | 1,167,354 | 20.5 | 100 | New | |
| Liberals, Democrats and Radicals | 904,195 | 15.9 | 96 | New | |
| Italian Social Democratic Party | 622,310 | 10.9 | 60 | New | |
| Liberal Union | 490,384 | 8.6 | 41 | −229 | |
| Combatants' Party | 232,923 | 4.1 | 20 | New | |
| Radical Party | 110,697 | 1.9 | 12 | −50 | |
| Economic Party | 87,450 | 1.5 | 7 | New | |
| Italian Reformist Socialist Party | 82,157 | 1.4 | 6 | −13 | |
| Radicals, Republicans, Socialists and Combatants | 65,421 | 1.2 | 5 | New | |
| Italian Republican Party | 53,197 | 0.9 | 4 | -4 | |
| Independent Socialists | 33,938 | 0.6 | 1 | −7 | |
| Invalid/blank votes | 108,674 | – | – | – | |
| Total | 5,793,492 | 100 | 508 | ±0 | |
| Registered voters/turnout | 10,239,326 | 56.6 | – | – | |
First party by Region
| Region | First party | Second party | Third party | |||
|---|---|---|---|---|---|---|
| Abruzzo-Molise | LDR–UL | PSI | PPI | |||
| Apulia | LDR–UL | PSI | PPI | |||
| Basilicata | LDR–UL | PSI | PPI | |||
| Calabria | LDR–UL | PPI | PSI | |||
| Campania | LDR–UL | PPI | PSI | |||
| Emilia-Romagna | PSI | LDR–UL | PPI | |||
| Lazio | LDR–UL | PPI | PSI | |||
| Liguria | LDR–UL | PSI | PPI | |||
| Lombardy | PSI | PPI | LDR–UL | |||
| Marche | PSI | LDR–UL | PPI | |||
| Piedmont | PSI | LDR–UL | PPI | |||
| Sardinia | LDR–UL | PPI | PSI | |||
| Sicily | LDR–UL | PPI | PSI | |||
| Tuscany | PSI | LDR–UL | PPI | |||
| Umbria | PSI | LDR–UL | PPI | |||
| Veneto | PPI | PSI | LDR–UL | |||
References
- Dieter Nohlen & Philip Stöver (2010) Elections in Europe: A data handbook, p1047 ISBN 978-3-8329-5609-7
- Nohlen & Stöver, p1032
- Brunella Dalla Casa, Composizione di classe, rivendicazioni e professionalità nelle lotte del "biennio rosso" a Bologna, in: AA. VV, Bologna 1920; le origini del fascismo, a cura di Luciano Casali, Cappelli, Bologna 1982, p. 179.
- Piergiorgio Corbetta; Maria Serena Piretti, Atlante storico-elettorale d'Italia, Zanichelli, Bologna 2009
| General | |
|---|---|
| European | |
| Regional | |
| Local |
|
| Referendums | |