1912 Belgian general election
Full general elections were held in Belgium on 2 June 1912.[1]
| |||||||||||||||||||||||||||||||||||||||||||||||||||||||||||||||||||||||||||
All 186 seats in the Chamber of Representatives 93 of 120 seats in the Senate | |||||||||||||||||||||||||||||||||||||||||||||||||||||||||||||||||||||||||||
|---|---|---|---|---|---|---|---|---|---|---|---|---|---|---|---|---|---|---|---|---|---|---|---|---|---|---|---|---|---|---|---|---|---|---|---|---|---|---|---|---|---|---|---|---|---|---|---|---|---|---|---|---|---|---|---|---|---|---|---|---|---|---|---|---|---|---|---|---|---|---|---|---|---|---|---|
| |||||||||||||||||||||||||||||||||||||||||||||||||||||||||||||||||||||||||||
| |||||||||||||||||||||||||||||||||||||||||||||||||||||||||||||||||||||||||||

Background
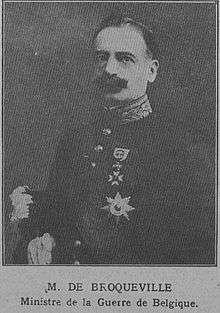
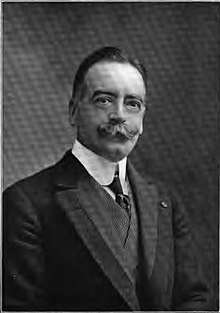
Catholics had formed the government continuously since 1884. Minister Schollaert had drafted a controversial education law and was forced to resign in June 1911. He was succeeded by a government led by Charles de Broqueville. The education law intended to financially equalise public and private education, which was opposed by liberals and socialists as it benefited private (Catholic) schools. Both opposition parties, united against Catholics, were expected to win the elections. King Albert I intended to switch to a progressive government headed by liberal Paul Hymans. However, the elections unexpectedly increased the majority of the Catholic Party, which won 101 of the 186 seats in the Chamber of Representatives and 54 of the 93 seats in the Senate.[2] Consequently, the incumbent Catholic government headed by Charles de Broqueville continued after the elections.
Electoral system
These elections were the first full general elections since 27 May 1900, when a proportional system using the D'Hondt method was introduced. Since 1893, there was universal suffrage with plural voting. Hence there were more votes than the 1,745,666 who could vote in these Chamber elections (out of a population of 7,571,387 in the country).
Following the population census, the number of seats in the Chamber of Representatives increased from 166 to 186. The number of directly elected seats in the Senate (half the number of Chamber seats) consequently increased from 83 to 93; the number of provincial senators remained at 27.
Results
Chamber of Representatives
| Party | Votes | % | Seats | +/- | |
|---|---|---|---|---|---|
| Catholic Party | 1,337,315 | 51.01 | 101 | +15 | |
| Liberal-Socialist Kartels | 710,459 | 27.10 | 45 | +25 | |
| Liberal Party | 291,084 | 11.10 | 21 | -15 | |
| Belgian Labour Party | 243,338 | 9.28 | 18 | -7 | |
| Christian Democratic Party | 19,317 | 0.74 | 1 | 0 | |
| Other parties | 20,258 | 0.77 | 0 | 0 | |
| Invalid/blank votes | 62,327 | – | – | - | |
| Total | 2,684,098 | 100 | 186 | +18 | |
| Source: Belgian Elections | |||||
Senate
| Party | Votes | % | Seats |
|---|---|---|---|
| Catholic Party | 1,224,767 | 52.22 | 54 |
| Liberal-Socialist Kartels | 480,457 | 20.49 | 16 |
| Liberal Party | 408,043 | 17.40 | 14 |
| Belgian Labour Party | 223,197 | 9.52 | 9 |
| Christian Democratic Party | 8,937 | 0.38 | 0 |
| Invalid/blank votes | 75,136 | – | – |
| Total | 2,420,537 | 100 | 93 |
| Source: Belgian Elections | |||
Constituencies
The distribution of seats among the electoral districts was as follows.[3] Several arrondissements got one or more additional seats, following the population census. With Neufchâteau-Virton receiving an extra seat, every electoral district now had at minimum three seats in the Chamber.
| Province | Arrondissement(s) | Chamber | Change | Senate | Change |
|---|---|---|---|---|---|
| Antwerp | Antwerp | 15 | +2 | 7 | +1 |
| Mechelen | 5 | +1 | 5 | +1 | |
| Turnhout | 4 | +1 | |||
| Elected by the provincial council | 3 | – | |||
| Limburg | Hasselt | 3 | – | 4 | +1 |
| Tongeren-Maaseik | 4 | +1 | |||
| Elected by the provincial council | 2 | – | |||
| East Flanders | Aalst | 5 | – | 4 | – |
| Oudenaarde | 3 | – | |||
| Gent-Eeklo | 12 | +1 | 6 | +1 | |
| Dendermonde | 4 | +1 | 4 | – | |
| Sint-Niklaas | 4 | – | |||
| Elected by the provincial council | 4 | – | |||
| West Flanders | Bruges | 4 | – | 2 | – |
| Roeselare-Tielt | 5 | +1 | 3 | +1 | |
| Kortrijk | 5 | – | 4 | – | |
| Ypres | 3 | – | |||
| Veurne-Diksmuide-Ostend | 5 | +1 | 2 | – | |
| Elected by the provincial council | 3 | – | |||
| Brabant | Leuven | 7 | +1 | 3 | – |
| Brussels | 26 | +5 | 13 | +2 | |
| Nivelles | 4 | – | 2 | – | |
| Elected by the provincial council | 4 | – | |||
| Hainaut | Tournai-Ath | 6 | – | 3 | – |
| Charleroi | 11 | +2 | 7 | +1 | |
| Thuin | 3 | – | |||
| Mons | 7 | +1 | 5 | – | |
| Soignies | 4 | – | |||
| Elected by the provincial council | 4 | – | |||
| Liège | Huy-Waremme | 4 | – | 2 | – |
| Liège | 13 | +1 | 7 | +1 | |
| Verviers | 5 | – | 2 | – | |
| Elected by the provincial council | 3 | – | |||
| Luxembourg | Arlon-Marche-Bastogne | 3 | – | 3 | – |
| Neufchâteau-Virton | 3 | +1 | |||
| Elected by the provincial council | 2 | – | |||
| Namur | Namur | 5 | – | 5 | +1 |
| Dinant-Philippeville | 4 | – | |||
| Elected by the provincial council | 2 | – | |||
| Total | 186 | +20 | 120 | +10 | |
References
- Nohlen, Dieter; Stöver, Philip (31 May 2010). Elections in Europe: A data handbook. Nomos Verlagsgesellschaft. p. 289. ISBN 978-3-8329-5609-7.
- Nohlen & Stöver, pp308-310
- List of members of the Chamber of Representatives (1912)