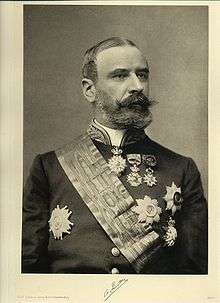
1898 Belgian general election
Partial legislative elections were held in Belgium on 22 May 1898, with run-off elections held on 29 May.[1] Under the alternating system, elections for the Chamber of Representatives were held in only four out of the nine provinces: Hainaut, Limburg, Liège and East Flanders. Thus, only 75 seats out of the 152 seats in the Chamber of Representatives were up for election. The Catholic Party retained their absolute majority.[2]
| |||||||||||||||||||||||||||||||||||||||||||||||||||||||||||||||||
75 of the 152 seats in the Chamber of Representatives | |||||||||||||||||||||||||||||||||||||||||||||||||||||||||||||||||
|---|---|---|---|---|---|---|---|---|---|---|---|---|---|---|---|---|---|---|---|---|---|---|---|---|---|---|---|---|---|---|---|---|---|---|---|---|---|---|---|---|---|---|---|---|---|---|---|---|---|---|---|---|---|---|---|---|---|---|---|---|---|---|---|---|---|
| |||||||||||||||||||||||||||||||||||||||||||||||||||||||||||||||||
| |||||||||||||||||||||||||||||||||||||||||||||||||||||||||||||||||

Notably, Adolf Daens, who was elected in 1894 for Aalst and served one term, was convinced not to run for re-election. His fight for a social Christian Democratic party was opposed by conservative Catholics, especially fellow Aalst MP Charles Woeste. None of the other "Daensists" (Christene Volkspartij) who ran were elected.
A special election in Bastogne was held on 24 July 1898. Henry Delvaux de Fenffe (d) was elected to replace Emile Van Hoorde (d), who became provincial senator.
They were the last regular legislative elections under a majority system; the next elections in 1900 saw the introduction of a proportional system.
The newly elected legislature met in regular session on 8 November 1898.
Results
Chamber of Representatives
| Party | Votes | % | Seats won | Total seats | +/– |
|---|---|---|---|---|---|
| Catholic Party | 377,275 | 38.49 | 36 | 108 | 0 |
| Belgian Labour Party | 213,511 | 21.78 | 15 | 15 | –12 |
| Liberal Party | 177,802 | 18.14 | 12 | 13 | +2 |
| Liberal-Socialist Kartels | 91,947 | 9.38 | 8 | 12 | +8 |
| Christian Democratic Party | 22,962 | 2.34 | 1 | 1 | 0 |
| Gauche Liberal Kartels | 17,724 | 1.81 | 1 | 1 | +1 |
| Other parties | 78,926 | 8.05 | 2 | 2 | +1 |
| Invalid/blank votes | 0 | – | – | – | - |
| Total | 980,147 | 100 | 75 | 152 | 0 |
| Source: Belgian Elections | |||||
Senate
| Party | Votes | % | Seats |
|---|---|---|---|
| Catholic Party | 147,160 | 51.5 | |
| Liberal Party | 134,437 | 47.0 | |
| Other parties | 4,202 | 1.5 | |
| Invalid/blank votes | – | – | |
| Total | 285,799 | 100 | |
| Source: Nohlen & Stöver | |||
Constituencies
| Province | Arrondissement | Chamber | Won by |
|---|---|---|---|
| Limburg | Hasselt | 3 | Catholic hold (unopposed re-election) |
| Maaseik | 1 | Catholic hold | |
| Tongeren | 2 | Catholic hold | |
| East Flanders | Aalst | 4 | Catholic hold |
| Oudenaarde | 3 | Catholic hold | |
| Gent | 9 | Catholic hold | |
| Eeklo | 1 | Catholic hold (unopposed re-election) | |
| Dendermonde | 3 | Catholic hold | |
| Sint-Niklaas | 4 | Catholic hold | |
| Hainaut | Tournai | 4 | Catholic hold |
| Ath | 2 | Liberal gain from Catholic | |
| Charleroi | 8 | Socialist hold | |
| Thuin | 3 | Socialist gain (from 1 Catholic, 1 liberal and 1 socialist) | |
| Mons | 6 | Socialist hold | |
| Soignies | 3 | Socialist hold | |
| Liège | Huy | 2 | 1 liberal hold, 1 socialist gain from liberal |
| Waremme | 2 | Catholic hold | |
| Liège | 11 | Socialist (6) and liberal (5) hold | |
| Verviers | 4 | Catholic gain from socialist |
Liberals gained two seats from Catholics in Ath, socialists gained a seat from Catholics and a seat from liberals in Thuin, socialists gained a seat from liberals in Huy and Catholics gained four seats from socialists in Verviers, resulting in a total of one seat changing from socialists to Catholics.
References
- Nohlen, Dieter; Stöver, Philip (31 May 2010). Elections in Europe: A data handbook. Nomos Verlagsgesellschaft. p. 289. ISBN 978-3-8329-5609-7.
- Nohlen & Stöver, p307
