Yield (engineering)
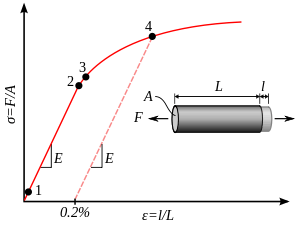
The yield point is the point on a stress–strain curve that indicates the limit of elastic behavior and the beginning of plastic behavior. Yielding means the start of breaking of fibers.
Yield strength or yield stress is the material property defined as the stress at which a material begins to deform plastically whereas yield point is the point where nonlinear (elastic + plastic) deformation begins. Prior to the yield point the material will deform elastically and will return to its original shape when the applied stress is removed. Once the yield point is passed, some fraction of the deformation will be permanent and non-reversible.
The yield point determines the limits of performance for mechanical components, since it represents the upper limit to forces that can be applied without permanent deformation. In structural engineering, this is a soft failure mode which does not normally cause catastrophic failure or ultimate failure unless it accelerates buckling.
Advances in measurement techniques allow higher precision mapping of the yield point which , as Marcus Reiner stated, showed "there was no yield point"[1]
Yield strength is the critical material property exploited by many fundamental techniques of material-working: to reshape material with pressure (such as forging, rolling, pressing, bending, extruding, or hydroforming), to separate material by cutting (such as machining) or shearing, and to join components rigidly with fasteners. Yield load can be taken as the load applied to the centre of a carriage spring to straighten its leaves.
The offset yield point (or proof stress) is the stress at which 0.2% plastic deformation occurs.
In the three-dimensional principal stresses ( ), an infinite number of yield points form together a yield surface.

Definition


It is often difficult to precisely define yielding due to the wide variety of stress–strain curves exhibited by real materials. In addition, there are several possible ways to define yielding:[2]
- True elastic limit
- The lowest stress at which dislocations move. This definition is rarely used, since dislocations move at very low stresses, and detecting such movement is very difficult.
- Proportionality limit
- Up to this amount of stress, stress is proportional to strain (Hooke's law), so the stress–strain graph is a straight line, and the gradient will be equal to the elastic modulus of the material.
- Elastic limit (yield strength)
- Beyond the elastic limit, permanent deformation will occur. The elastic limit is therefore the lowest stress point at which permanent deformation can be measured. This requires a manual load-unload procedure, and the accuracy is critically dependent on the equipment used and operator skill. For elastomers, such as rubber, the elastic limit is much larger than the proportionality limit. Also, precise strain measurements have shown that plastic strain begins at low stresses.[3][4]
- Yield point
- The point in the stress–strain curve at which the curve levels off and plastic deformation begins to occur.[5]
- Offset yield point (proof stress)
- When a yield point is not easily defined based on the shape of the stress–strain curve an offset yield point is arbitrarily defined. The value for this is commonly set at 0.1 or 0.2% plastic strain.[6] The offset value is given as a subscript, e.g., Rp0.2=310 MPa.[7] High strength steel and aluminum alloys do not exhibit a yield point, so this offset yield point is used on these materials.[6]
- Upper and lower yield points
- Some metals, such as mild steel, reach an upper yield point before dropping rapidly to a lower yield point. The material response is linear up until the upper yield point, but the lower yield point is used in structural engineering as a conservative value. If a metal is only stressed to the upper yield point, and beyond, Lüders bands can develop.[8]
Theoretical Yield Strength
The theoretical yield strength can be estimated by considering the process of yield at the atomic level. In a perfect crystal, shearing results in the displacement of an entire plane of atoms by one interatomic separation distance, b, relative to the plane below. In order for the atoms to move, considerable force must be applied to overcome the lattice energy and move the atoms in the top plane over the lower atoms and into a new lattice site. The applied stress to overcome the resistance of a perfect lattice to shear is the theoretical yield strength, τmax.
Derivation
The stress displacement curve of a plane of atoms varies sinusoidally as stress peaks when an atom is forced over the atom below and then falls as the atom slides into the next lattice point.[9]

where is the interatomic separation distance. Since γ = G τ and dτ/dγ = G at small strains (ie. Single atomic distance displacements), this equation becomes:


For small displacement of γ=x/a, where a is the spacing of atoms on the slip plane, this can be rewritten as:

Giving a value of τmax equal to:

The theoretical yield strength can be approximated as τmax = G/30.
Typical Values of Theoretical and Experimental Yield Stress
The theoretical yield strength of a perfect crystal is much higher than the observed stress at initiation of plastic flow. Theoretical and experimental yield stresses of common materials are shown in the table below.[10]
| Material | Theoretical Shear Strength (GPa) | Experimental Shear Strength (MPa) |
|---|---|---|
| Ag | 1.0 | 0.37 |
| Al | 0.9 | 0.78 |
| Cu | 1.4 | 0.49 |
| Ni | 2.6 | 3.2 |
| α-Fe | 2.6 | 27.5 |
That experimentally measured yield strength is significantly lower than the expected theoretical value can be explained by the presence of dislocations and defects in the materials. Indeed, whiskers with perfect single crystal structure and defect free surfaces have been shown to demonstrate yield stress approaching the theoretical value. For example, nanowhiskers of copper were shown to undergo brittle fracture at 1 GPa,[11] a value much higher than the strength of bulk copper and approaching the theoretical value.
Yield criterion
A yield criterion, often expressed as yield surface, or yield locus, is a hypothesis concerning the limit of elasticity under any combination of stresses. There are two interpretations of yield criterion: one is purely mathematical in taking a statistical approach while other models attempt to provide a justification based on established physical principles. Since stress and strain are tensor qualities they can be described on the basis of three principal directions, in the case of stress these are denoted by , , and .


The following represent the most common yield criterion as applied to an isotropic material (uniform properties in all directions). Other equations have been proposed or are used in specialist situations.
Isotropic yield criteria
Maximum Principal Stress Theory – by W.J.M Rankine(1850). Yield occurs when the largest principal stress exceeds the uniaxial tensile yield strength. Although this criterion allows for a quick and easy comparison with experimental data it is rarely suitable for design purposes. This theory gives good predictions for brittle materials.

Maximum Principal Strain Theory – by St.Venant. Yield occurs when the maximum principal strain reaches the strain corresponding to the yield point during a simple tensile test. In terms of the principal stresses this is determined by the equation:

Maximum Shear Stress Theory – Also known as the Tresca yield criterion, after the French scientist Henri Tresca. This assumes that yield occurs when the shear stress exceeds the shear yield strength :


Total Strain Energy Theory – This theory assumes that the stored energy associated with elastic deformation at the point of yield is independent of the specific stress tensor. Thus yield occurs when the strain energy per unit volume is greater than the strain energy at the elastic limit in simple tension. For a 3-dimensional stress state this is given by:

Maximum Distortion Energy Theory (von Mises yield criterion) – This theory proposes that the total strain energy can be separated into two components: the volumetric (hydrostatic) strain energy and the shape (distortion or shear) strain energy. It is proposed that yield occurs when the distortion component exceeds that at the yield point for a simple tensile test. This theory is also known as the von Mises yield criterion.
Based on a different theoretical underpinning this expression is also referred to as octahedral shear stress theory.
Other commonly used isotropic yield criteria are the
- von Mises yield criterion
- Mohr-Coulomb yield criterion
- Drucker-Prager yield criterion
- Bresler-Pister yield criterion
- Willam-Warnke yield criterion
The yield surfaces corresponding to these criteria have a range of forms. However, most isotropic yield criteria correspond to convex yield surfaces.
Anisotropic yield criteria
When a metal is subjected to large plastic deformations the grain sizes and orientations change in the direction of deformation. As a result, the plastic yield behavior of the material shows directional dependency. Under such circumstances, the isotropic yield criteria such as the von Mises yield criterion are unable to predict the yield behavior accurately. Several anisotropic yield criteria have been developed to deal with such situations. Some of the more popular anisotropic yield criteria are:
Factors influencing yield strength
The stress at which yield occurs is dependent on both the rate of deformation (strain rate) and, more significantly, the temperature at which the deformation occurs. In general, the yield strength increases with strain rate and decreases with temperature. When the latter is not the case, the material is said to exhibit yield strength anomaly, which is typical for superalloys and leads to their use in applications requiring high strength at high temperatures.
Early work by Alder and Philips[12] found that the relationship between yield strength and strain rate (at constant temperature) was best described by a power law relationship of the form

where C is a constant and m is the strain rate sensitivity. The latter generally increases with temperature, and materials where m reaches a value greater than ~0.5 tend to exhibit super plastic behavior. m can be found from a log-log plot of yield strength at a fixed plastic strain versus the strain rate.[13]

Later, more complex equations were proposed that simultaneously dealt with both temperature and strain rate:
![{\displaystyle \sigma _{y}={\frac {1}{\alpha }}\sinh ^{-1}\left[{\frac {Z}{A}}\right]^{\frac {1}{n}}\,\!}](../I/m/6013edeae595c80b003fd480390b40be86c2fd0e.svg)
where α and A are constants and Z is the temperature-compensated strain-rate – often described by the Zener-Hollomon parameter:

where QHW is the activation energy for hot deformation and T is the absolute temperature.
Strengthening mechanisms
There are several ways in which crystalline and amorphous materials can be engineered to increase their yield strength. By altering dislocation density, impurity levels, grain size (in crystalline materials), the yield strength of the material can be fine tuned. This occurs typically by introducing defects such as impurities dislocations in the material. To move this defect (plastically deforming or yielding the material), a larger stress must be applied. This thus causes a higher yield stress in the material. While many material properties depend only on the composition of the bulk material, yield strength is extremely sensitive to the materials processing as well.
These mechanisms for crystalline materials include
- Work hardening
- Solid solution strengthening
- Precipitation strengthening
- Grain boundary strengthening
Work hardening
Where deforming the material will introduce dislocations, which increases their density in the material. This increases the yield strength of the material, since now more stress must be applied to move these dislocations through a crystal lattice. Dislocations can also interact with each other, becoming entangled.
The governing formula for this mechanism is:

where is the yield stress, G is the shear elastic modulus, b is the magnitude of the Burgers vector, and is the dislocation density.


Solid solution strengthening
By alloying the material, impurity atoms in low concentrations will occupy a lattice position directly below a dislocation, such as directly below an extra half plane defect. This relieves a tensile strain directly below the dislocation by filling that empty lattice space with the impurity atom.
The relationship of this mechanism goes as:

where is the shear stress, related to the yield stress, and are the same as in the above example, is the concentration of solute and is the strain induced in the lattice due to adding the impurity.


Particle/precipitate strengthening
Where the presence of a secondary phase will increase yield strength by blocking the motion of dislocations within the crystal. A line defect that, while moving through the matrix, will be forced against a small particle or precipitate of the material. Dislocations can move through this particle either by shearing the particle, or by a process known as bowing or ringing, in which a new ring of dislocations is created around the particle.
The shearing formula goes as:

and the bowing/ringing formula:

In these formulas, is the particle radius, is the surface tension between the matrix and the particle, is the distance between the particles.


Grain boundary strengthening
Where a buildup of dislocations at a grain boundary causes a repulsive force between dislocations. As grain size decreases, the surface area to volume ratio of the grain increases, allowing more buildup of dislocations at the grain edge. Since it requires a lot of energy to move dislocations to another grain, these dislocations build up along the boundary, and increase the yield stress of the material. Also known as Hall-Petch strengthening, this type of strengthening is governed by the formula:

where
- is the stress required to move dislocations,
- k is a material constant, and
- d is the grain size.

Testing
Yield strength testing involves taking a small sample with a fixed cross-section area, and then pulling it with a controlled, gradually increasing force until the sample changes shape or breaks. This is called a Tensile Test. Longitudinal and/or transverse strain is recorded using mechanical or optical extensometers.
Yield behaviour can also be simulated using virtual tests (on computer models of materials), particularly where macroscopic yield is governed by the microstructural architecture of the material being studied.[14]
Indentation hardness correlates roughly linearly with tensile strength for most steels, but measurements on one material cannot be used as a scale to measure strengths on another.[15] Hardness testing can therefore be an economical substitute for tensile testing, as well as providing local variations in yield strength due to, e.g., welding or forming operations. However, for critical situations tension testing is done to eliminate ambiguity.
Implications for structural engineering
Yielded structures have a lower stiffness, leading to increased deflections and decreased buckling strength. The structure will be permanently deformed when the load is removed, and may have residual stresses. Engineering metals display strain hardening, which implies that the yield stress is increased after unloading from a yield state. Highly optimized structures, such as airplane beams and components, rely on yielding as a fail-safe failure mode. No safety factor is therefore needed when comparing limit loads (the highest loads expected during normal operation) to yield criteria.
Typical yield and ultimate strengths
Note: many of the values depend on manufacturing process and purity/composition.
| Material | Yield strength (MPa) |
Ultimate strength (MPa) |
Density (g/cm³) |
Free breaking length (km) |
|---|---|---|---|---|
| ASTM A36 steel | 250 | 400 | 7.87 | 3.2 |
| Steel, API 5L X65[16] | 448 | 531 | 7.85 | 5.8 |
| Steel, high strength alloy ASTM A514 | 690 | 760 | 7.85 | 9.0 |
| Steel, prestressing strands | 1650 | 1860 | 7.85 | 21.6 |
| Piano wire | 2200–2482[17] | 7.8 | 28.7 | |
| Carbon fiber (CF, CFK) | 5650[18] | 1.75 | 329 | |
| High-density polyethylene (HDPE) | 26–33 | 37 | 0.95 | 2.8 |
| Polypropylene | 12–43 | 19.7–80 | 0.91 | 1.3 |
| Stainless steel AISI 302 – cold-rolled | 520 | 860 | ||
| Cast iron 4.5% C, ASTM A-48[19] | [lower-alpha 1] | 172 | 7.20 | 2.4 |
| Titanium alloy (6% Al, 4% V) | 830 | 900 | 4.51 | 18.8 |
| Aluminium alloy 2014-T6 | 400 | 455 | 2.7 | 15.1 |
| Copper 99.9% Cu | 70 | 220 | 8.92 | 0.8 |
| Cupronickel 10% Ni, 1.6% Fe, 1% Mn, balance Cu | 130 | 350 | 8.94 | 1.4 |
| Brass | Approx. 200+ | 550 | 8.5 | 3.8 |
| Spider silk | 1150 (??) | 1400 | 1.31 | 109 |
| Silkworm silk | 500 | 25 | ||
| Aramid (Kevlar or Twaron) | 3620 | 3757 | 1.44 | 256.3 |
| UHMWPE[21][22] | 20 | 35[23] | 0.97 | 2.1 |
| Bone (limb) | 104–121 | 130 | 3 | |
| Nylon, type 6/6 | 45 | 75 | 2 |
| Element | Young's modulus (GPa) |
Proof or yield stress (MPa) |
Ultimate tensile Strength (MPa) |
|---|---|---|---|
| Aluminium | 70 | 15–20 | 40–50 |
| Copper | 130 | 33 | 210 |
| Iron | 211 | 80–100 | 350 |
| Nickel | 170 | 14–35 | 140–195 |
| Silicon | 107 | 5000–9000 | |
| Tantalum | 186 | 180 | 200 |
| Tin | 47 | 9–14 | 15–200 |
| Titanium | 120 | 100–225 | 240–370 |
| Tungsten | 411 | 550 | 550–620 |
See also
References
Notes
- ↑ Reiner, Markus (1943), Ten Lectures on Theoretical Rheology, Jerusalem: Rubin Mass, p. 137
- ↑ G. Dieter, Mechanical Metallurgy, McGraw-Hill, 1986
- ↑ Flinn, Richard A.; Trojan, Paul K. (1975). Engineering Materials and their Applications. Boston: Houghton Mifflin Company. p. 61. ISBN 0-395-18916-0.
- ↑ Kumagai, Naoichi; Sasajima, Sadao; Ito, Hidebumi (15 February 1978). "岩石の長年クリープ実験 : 巨大試片約20年間・小試片約3年間の結果" [Long-term Creep of Rocks: Results with Large Specimens Obtained in about 20 Years and Those with Small Specimens in about 3 Years]. Journal of the Society of Materials Science (Japan) (in Japanese). Japan Energy Society. 27 (293): 157–161. Retrieved 2008-06-16.
- ↑ Ross 1999, p. 56.
- 1 2 Ross 1999, p. 59.
- ↑ ISO 6892-1:2009
- ↑ Degarmo, p. 377.
- ↑ H., Courtney, Thomas (2005). Mechanical behavior of materials. Waveland Press. ISBN 1577664256. OCLC 894800884.
- ↑ H., Courtney, Thomas (2005). Mechanical behavior of materials. Waveland Press. ISBN 1577664256. OCLC 894800884.
- ↑ Richter, Gunther (2009). "Ultrahigh Strength Single Crystalline Nanowhiskers Grown by Physical Vapor Deposition". Nano Letters. 9: 3048–3052.
- ↑ Alder, J.F.; Phillips, V.A. (1954). "The effect of strain rate and temperature on the resistance of aluminium, copper, and steel to compression". J Inst Met. 83: 80–86.
- ↑ Dynamic Behavior of a Rare-Earth-Containing Mg Alloy, WE43B-T5, Plate with Comparison to Conventional Alloy, AM30-F , Sean Agnew, Wilburn Whittington, Andrew Oppedal, Haitham El Kadiri, Matthew Shaeffer, K. T. Ramesh, Jishnu Bhattacharyya, Rick Delorme, Bruce Davis , Volume 66, Issue 2 / February, 2014
- ↑ Levrero, F.; Margetts, L.; et al. (2016). "Evaluating the macroscopic yield behaviour of trabecular bone using a nonlinear homogenisation approach". Journal of the Mechanical Behavior of Biomedical Materials. 61: 384–396. doi:10.1016/j.jmbbm.2016.04.008.
- ↑ Correlation of Yield Strength and Tensile Strength with Hardness for Steels , E.J. Pavlina and C.J. Van Tyne, Journal of Materials Engineering and Performance, Volume 17, Number 6 / December, 2008
- ↑ ussteel.com
- ↑ Don Stackhouse @ DJ Aerotech
- ↑ complore.com
- ↑ Beer, Johnston & Dewolf 2001, p. 746.
- ↑ Avallone et al. 2006, p. 6‐35.
- ↑ Technical Product Data Sheets UHMWPE
- ↑ unitex-deutschland.eu
- ↑ matweb.com
- ↑ A.M. Howatson, P.G. Lund and J.D. Todd, "Engineering Tables and Data", p. 41.
Bibliography
- Avallone, Eugene A. & Baumeister III, Theodore (1996). Mark's Standard Handbook for Mechanical Engineers (8th ed.). New York: McGraw-Hill. ISBN 0-07-004997-1.
- Avallone, Eugene A.; Baumeister, Theodore; Sadegh, Ali; Marks, Lionel Simeon (2006). Mark's Standard Handbook for Mechanical Engineers (11th, Illustrated ed.). McGraw-Hill Professional. ISBN 978-0-07-142867-5. .
- Beer, Ferdinand P.; Johnston, E. Russell; Dewolf, John T. (2001). Mechanics of Materials (3rd ed.). McGraw-Hill. ISBN 978-0-07-365935-0. .
- Boresi, A. P., Schmidt, R. J., and Sidebottom, O. M. (1993). Advanced Mechanics of Materials, 5th edition John Wiley & Sons. ISBN 0-471-55157-0
- Degarmo, E. Paul; Black, J T.; Kohser, Ronald A. (2003). Materials and Processes in Manufacturing (9th ed.). Wiley. ISBN 0-471-65653-4. .
- Oberg, E., Jones, F. D., and Horton, H. L. (1984). Machinery's Handbook, 22nd edition. Industrial Press. ISBN 0-8311-1155-0
- Ross, C. (1999). Mechanics of Solids. City: Albion/Horwood Pub. ISBN 978-1-898563-67-9.
- Shigley, J. E., and Mischke, C. R. (1989). Mechanical Engineering Design, 5th edition. McGraw Hill. ISBN 0-07-056899-5
- Young, Warren C. & Budynas, Richard G. (2002). Roark's Formulas for Stress and Strain, 7th edition. New York: McGraw-Hill. ISBN 0-07-072542-X.
- Engineer's Handbook