Woking Borough Council elections
One third of Woking Borough Council in Surrey, England is elected each year, followed by one year without election. Since the last boundary changes in 2016, 30 councillors have been elected from 10 wards.[1]
Political control
A borough called Woking had existed since 1965 and was controlled by the Conservative Party until the local elections in 1986. The partisan control of the borough has been as follows, with each poll electing one third of the seats, except where noted.[2][3]
| Election | Party in control | Contested | Refs | |
|---|---|---|---|---|
| 1973BF | Conservative | 34 of 34 | [4] | |
| 1976FW | 35 of 35 | [4][5] | ||
| 1978 | 12 of 35 | [4] | ||
| 1979B | 12 of 35 | [4][6] | ||
| 1980 | 12 of 35 | [4] | ||
| 1982 | 11 of 35 | [4] | ||
| 1983 | 13 of 35 | [4] | ||
| 1984 | 12 of 35 | [4] | ||
| 1986B | No overall control | 12 of 35 | [4][7] | |
| 1987 | 12 of 35 | [4] | ||
| 1988 | 15 of 35 | [4] | ||
| 1990 | 12 of 35 | [4] | ||
| 1991 | 12 of 35 | [4] | ||
| 1992 | Conservative | 12 of 35 | [4] | |
| 1994 | No overall control | 11 of 35 | [4] | |
| 1995 | 12 of 35 | [4] | ||
| 1996 | Liberal Democrats | 12 of 35 | [4] | |
| 1998 | No overall control | 11 of 35 | [4] | |
| 1999 | 12 of 35 | [4] | ||
| 2000FW | 36 of 36 | [4][8][9] | ||
| 2002 | 13 of 36 | [4] | ||
| 2003 | 13 of 36 | [4] | ||
| 2004 | 13 of 36 | [4] | ||
| 2006 | 13 of 36 | [4] | ||
| 2007 | Conservative | 12 of 36 | [4] | |
| 2008 | 12 of 36 | [4] | ||
| 2009* | No overall control | — | [2] | |
| 2010 | 13 of 36 | [4] | ||
| 2011 | Conservative | 13 of 36 | [4] | |
| 2012 | 12 of 36 | [4] | ||
| 2014 | 12 of 36 | [10] | ||
| 2015 | 12 of 36 | [11] | ||
| 2016FW | 30 of 30 | [12][13] | ||
| 2018 | 10 of 30 | [14][15] | ||
| B: New borough boundaries F: Full borough election W: New ward boundaries *: Change in control without election | ||||
Structure of the council
| Political party | Council members | ||
|---|---|---|---|
| 2018[14][15] | |||
| Conservative | 16 | 16 / 30 | |
| Liberal Democrat | 8 | 8 / 30 | |
| Labour | 3 | 3 / 30 | |
| Independent | 3 | 3 / 30 | |
Borough result maps
 2000 results map
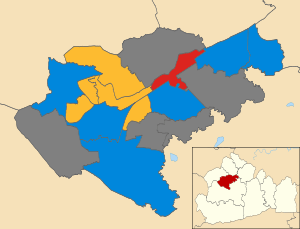 2002 results map
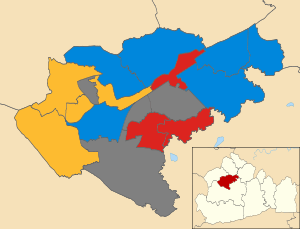 2003 results map
 2004 results map
 2006 results map
 2007 results map
 2008 results map
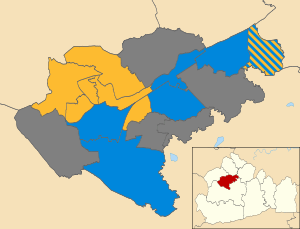 2010 results map
By-election results
1990s
| Party | Candidate | Votes | % | ± | |
|---|---|---|---|---|---|
| Liberal Democrat | 927 | 60.6 | |||
| Conservative | 318 | 20.8 | |||
| Labour | 228 | 14.9 | |||
| UKIP | 58 | 3.8 | |||
| Majority | 609 | 39.8 | |||
| Turnout | 1,531 | ||||
| Liberal Democrat hold | Swing | ||||
| Party | Candidate | Votes | % | ± | |
|---|---|---|---|---|---|
| Liberal Democrat | 626 | 52.2 | +2.4 | ||
| Conservative | 357 | 29.8 | +3.6 | ||
| Labour | 217 | 18.1 | -5.9 | ||
| Majority | 269 | 22.4 | |||
| Turnout | 1,200 | 21.0 | |||
| Liberal Democrat hold | Swing | ||||
| Party | Candidate | Votes | % | ± | |
|---|---|---|---|---|---|
| Independent | 652 | 34.5 | +34.5 | ||
| Conservative | 545 | 28.9 | -9.0 | ||
| Liberal Democrat | 442 | 23.4 | -16.9 | ||
| Labour | 249 | 13.2 | -8.6 | ||
| Majority | 107 | 5.6 | |||
| Turnout | 1,888 | 24.0 | |||
| Independent gain from Liberal Democrat | Swing | ||||
| Party | Candidate | Votes | % | ± | |
|---|---|---|---|---|---|
| Conservative | 1,426 | 56.3 | -0.1 | ||
| Liberal Democrat | 942 | 37.2 | +1.3 | ||
| Labour | 164 | 6.5 | -1.3 | ||
| Majority | 484 | 19.1 | |||
| Turnout | 2,532 | 39.9 | |||
| Conservative hold | Swing | ||||
2000s
| Party | Candidate | Votes | % | ± | |
|---|---|---|---|---|---|
| Conservative | Beryl Marlow | 809 | 53.6 | +15.6 | |
| Liberal Democrat | Anne Roberts | 557 | 36.9 | -14.8 | |
| Labour | Raymond Holroyde | 144 | 9.5 | -0.8 | |
| Majority | 252 | 16.7 | |||
| Turnout | 1,510 | 27.5 | |||
| Conservative gain from Liberal Democrat | Swing | ||||
References
- ↑ "About the Council". Woking Borough Council. Retrieved 4 May 2018.
- 1 2 Woodger, Beth (16 July 2009). "Tory councillor quits party in council debt protest". Get Surrey. Retrieved 12 February 2011.
- ↑ "England council elections". BBC News Online. Retrieved 7 September 2011.
- 1 2 3 4 5 6 7 8 9 10 11 12 13 14 15 16 17 18 19 20 21 22 23 24 25 26 27 28 29 Colin Rallings; Michael Thrasher (2012). "Woking Borough Council Election Results, 1973–2012" (PDF). The Elections Centre, University of Plymouth. Retrieved 5 May 2018.
- ↑ UK Parliament. The Borough of Woking (Electoral Arrangements) Order 1976 as made, from legislation.gov.uk. Retrieved on 19 November 2015.
- ↑ The Runnymede and Woking (Areas) Order 1977
- ↑ UK Parliament. The Surrey (District Boundaries) Order 1986 as made, from legislation.gov.uk. Retrieved on 6 November 2015.
- ↑ UK Parliament. The Borough of Woking (Electoral Changes) Order 1999 as made, from legislation.gov.uk. Retrieved on 4 October 2015.
- ↑ "Woking". BBC News Online. Retrieved 19 January 2010.
- ↑ "Election of Borough Councillors for the Wards of Woking Borough Council Summary of Results" (PDF). Woking Borough Council. 23 May 2014. Retrieved 5 May 2018.
- ↑ "Election of Borough Councillors for the Wards of Woking Borough Council Summary of Results" (PDF). Woking Borough Council. 8 May 2015. Retrieved 5 May 2018.
- ↑ UK Parliament. The Woking (Electoral Changes) Order 2015 as made, from legislation.gov.uk. Retrieved on 3 November 2015.
- ↑ "Past election results". Woking Borough Council. Retrieved 8 May 2016. Cited in Woking Borough Council election, 2016, English Wikipedia, retrieved 5 May 2018.
- 1 2 "Borough election results, 4 May 2018". Woking Borough Council. 4 May 2018. Retrieved 4 May 2018.
- 1 2 "Woking Borough Council". BBC News Online. 4 May 2018. Retrieved 4 May 2018.
- ↑ "Byfleet By-Election Results". Woking Borough Council. 16 July 2001. Retrieved 19 January 2010.
External links
| Surrey CC | |
|---|---|
| Elmbridge BC | |
| Epsom and Ewell BC | |
| Guildford BC | |
| Mole Valley DC | |
| Reigate and Banstead BC | |
| Runnymede BC | |
| Spelthorne BC |
|
| Surrey Heath BC | |
| Tandridge DC | |
| Waverley BC |
|
| Woking BC | |
| |
This article is issued from
Wikipedia.
The text is licensed under Creative Commons - Attribution - Sharealike.
Additional terms may apply for the media files.