Virginia's 10th congressional district
| Virginia's 10th congressional district | |
|---|---|
.tif.png) Virginia's 10th congressional district - since January 3, 2013. | |
| Current Representative | Barbara Comstock (R–McLean) |
| Distribution |
|
| Population (2016) | 827,279[2] |
| Median income | $120,384 |
| Ethnicity |
|
| Cook PVI | D+1[3] |
Virginia's Tenth Congressional District is a U.S. congressional district in the Commonwealth of Virginia. The 10th District is represented by Republican Congresswoman Barbara Comstock, first elected to the 10th's seat in the U.S. House of Representatives in 2014.
The district includes all of Clarke, Frederick, and Loudoun and the Independent Cities of Manassas, Manassas Park, Winchester, along with portions of Fairfax, and Prince William counties. The district closely matches Virginia's voting patterns in statewide races with nearly identical margins as the final statewide results.
Since it was created in 1952, the 10th District has been in Republican hands for 60 of 66 years, including long stints in office by Reps. Joel Broyhill (1953-74) and Frank Wolf (1981-2014). Comstock, a former aide to Wolf, succeeded him after the 2014 election.[4]
According to Larry Sabato's Crystal Ball, this district has many "wealthy and highly-educated voters" as of 14 April 2016.[5] Specifically, whites represent only about 61% of the population in the 10th, and immigrants (largely Hispanic and Asian) represent over 20% of the population. Just over half of the adults in the 10th District hold at least a four-year college degree. The median income in the 10th is $120,384.[6]
The 10th district has 35,500 federal workers. By comparison, the 1st district has 46,900; the 11th has 51,900; and the 8th has 81,100.[7] The eastern part of the district is home to Dulles Airport and technology, telecom and aerospace companies including Verizon Business Global LLC, WorldCom Inc. and Aeronautical Systems Inc.[8]
History
The modern 10th congressional district was formed in 1952. In the 1960s it consisted of Arlington, Alexandria and most of Fairfax County.
Voting
Virginia's 10th Congressional District used to be a Republican-stronghold, having once voted by double-digit margins for Republican candidates. In 2000, incumbent Congressman Frank Wolf (R) won over 80% of the vote, although no Democrats filed to win. Two years later, Wolf defeated his Democratic challenger, John Stevens, by 43 points. In 2004, President George W. Bush won the district by 11 points. Overtime, due to population growth in the Washington, D.C. suburbs, the margin, whether it be in Congressional or statewide races, has begun to narrow. In 2012, Mitt Romney narrowly carried the district by a point, while in 2016, Hillary Clinton won the district by nearly 10 points.
| Election results from statewide races | ||
|---|---|---|
| Year | Office | Results |
| 1992 | President | Bush 49.7–33.1%[9] |
| 1996 | President | Dole 54–38% |
| Senator | Warner 60–40% | |
| 1997 | Governor | Gilmore 62–37% |
| Lieutenant Governor | Hager 59–37% | |
| Attorney General | Earley 62–38% | |
| 2000 | President | Bush 56–41%[10] |
| Senator | Allen 59–41% | |
| 2001 | Governor | Earley 54–45% |
| Lieutenant Governor | Katzen 57–41% | |
| Attorney General | Kilgore 65–35% | |
| 2004 | President | Bush 55–44%[10] |
| 2008 | President | Obama 51–48.2%[11] |
| 2012 | President | Romney 49.9–48.8%[12] |
| 2013 | Governor | Cuccinelli 47.9-47.0%[13] |
| 2016 | President | Clinton 52.2–42.2%[14] |
| 2017 | Governor | Northam 56.6–43.3%[15] |
| Lieutenant Governor | Fairfax 54.2–45.8% | |
| Attorney General | Herring | |
Recent election results
1970 election
| Party | Candidate | Votes | % | |
|---|---|---|---|---|
| Republican | Joel T. Broyhill (inc.) | 67,468 | 54.53 | |
| Democratic | Harold O. Miller | 56,255 | 45.47 | |
| Total votes | 123,723 | 100.00 | ||
| Republican hold | ||||
Source:[16]
1972 election
| Party | Candidate | Votes | % | |
|---|---|---|---|---|
| Republican | Joel T. Broyhill (inc.) | 101,138 | 56.26 | |
| Democratic | Harold O. Miller | 78,638 | 43.74 | |
| Write-ins | 2 | <0.01 | ||
| Total votes | 179,778 | 100.00 | ||
| Republican hold | ||||
Source:[17]
1974 election
| Party | Candidate | Votes | % | |||
|---|---|---|---|---|---|---|
| Democratic | Joseph L. Fisher | 67,184 | 53.62 | |||
| Republican | Joel T. Broyhill (inc.) | 56,649 | 45.21 | |||
| Independent | Francis J. Speh | 1,465 | 1.17 | |||
| Write-ins | 6 | <0.01 | ||||
| Total votes | 125,304 | 100.00 | ||||
| Democratic gain from Republican | ||||||
Source:[18]
1976 election
| Party | Candidate | Votes | % | |
|---|---|---|---|---|
| Democratic | Joseph L. Fisher (inc.) | 103,689 | 54.72 | |
| Republican | Vincent F. Callahan, Jr. | 73,616 | 38.85 | |
| Independent | E. Stanley Rittenhouse | 12,124 | 6.40 | |
| Write-ins | 60 | 0.03 | ||
| Total votes | 189,489 | 100.00 | ||
| Democratic hold | ||||
Source:[19]
1978 election
| Party | Candidate | Votes | % | |
|---|---|---|---|---|
| Democratic | Joseph L. Fisher (inc.) | 70,892 | 53.35 | |
| Republican | Frank Wolf | 61,981 | 46.64 | |
| Write-ins | 9 | 0.01 | ||
| Total votes | 132,882 | 100.00 | ||
| Democratic hold | ||||
Source:[20]
1980 election
| Party | Candidate | Votes | % | |||
|---|---|---|---|---|---|---|
| Republican | Frank Wolf | 110,840 | 51.14 | |||
| Democratic | Joseph L. Fisher (inc.) | 105,883 | 48.85 | |||
| Write-ins | 21 | 0.01 | ||||
| Total votes | 216,744 | 100.00 | ||||
| Republican gain from Democratic | ||||||
Source:[21]
1982 election
| Party | Candidate | Votes | % | |
|---|---|---|---|---|
| Republican | Frank Wolf (inc.) | 86,506 | 52.74 | |
| Democratic | Ira M. Lechner | 75,361 | 45.94 | |
| Independent | Scott R. Bowden | 2,162 | 1.32 | |
| Write-ins | 6 | <0.01 | ||
| Total votes | 164,035 | 100.00 | ||
| Republican hold | ||||
Source:[22]
1984 election
| Party | Candidate | Votes | % | |
|---|---|---|---|---|
| Republican | Frank Wolf (inc.) | 158,528 | 62.50 | |
| Democratic | John P. Flannery II | 95,074 | 37.49 | |
| Write-ins | 23 | <0.01 | ||
| Total votes | 253,625 | 100.00 | ||
| Republican hold | ||||
Source:[23]
1986 election
| Party | Candidate | Votes | % | |
|---|---|---|---|---|
| Republican | Frank Wolf (inc.) | 95,724 | 60.20 | |
| Democratic | John G. Milliken | 63,292 | 39.80 | |
| Write-ins | 7 | <0.01 | ||
| Total votes | 159,023 | 100.00 | ||
| Republican hold | ||||
Source:[24]
1988 election
| Party | Candidate | Votes | % | |
|---|---|---|---|---|
| Republican | Frank Wolf (inc.) | 188,550 | 68.09 | |
| Democratic | Bob L. Weinberg | 88,284 | 31.88 | |
| Write-ins | 74 | 0.03 | ||
| Total votes | 276,908 | 100.00 | ||
| Republican hold | ||||
Source:[25]
1990 election
| Party | Candidate | Votes | % | |
|---|---|---|---|---|
| Republican | Frank Wolf (inc.) | 103,761 | 61.46 | |
| Democratic | N. MacKenzie Canter III | 57,249 | 33.91 | |
| Independent | Barbara S. Minnich | 5,273 | 3.12 | |
| Independent | Lyndon LaRouche | 2,293 | 1.36 | |
| Write-ins | 249 | 0.15 | ||
| Total votes | 168,825 | 100.00 | ||
| Republican hold | ||||
Source:[26]
1992 election
| Party | Candidate | Votes | % | |
|---|---|---|---|---|
| Republican | Frank Wolf (inc.) | 144,471 | 63.59 | |
| Democratic | Raymond E. Vickery, Jr. | 75,775 | 33.35 | |
| Independent | Alan R. Ogden | 6,874 | 3.03 | |
| Write-ins | 71 | 0.03 | ||
| Total votes | 227,191 | 100.00 | ||
| Republican hold | ||||
Source:[27]
1994 election
| Party | Candidate | Votes | % | |
|---|---|---|---|---|
| Republican | Frank Wolf (inc.) | 153,311 | 87.34 | |
| Independent | Alan R. Ogden | 13,687 | 7.80 | |
| Independent | Robert L. Rilee | 8,267 | 4.71 | |
| Write-ins | 266 | 0.15 | ||
| Total votes | 175,531 | 100.00 | ||
| Republican hold | ||||
Source:[28]
1996 election
| Party | Candidate | Votes | % | |
|---|---|---|---|---|
| Republican | Frank Wolf (inc.) | 169,266 | 72.02 | |
| Democratic | Bob L. Weinberg | 59,145 | 25.17 | |
| Independent | Gary A. Reams | 6,500 | 2.77 | |
| Write-ins | 102 | 0.04 | ||
| Total votes | 235,013 | 100.00 | ||
| Republican hold | ||||
Source:[29]
1998 election
| Party | Candidate | Votes | % | |
|---|---|---|---|---|
| Republican | Frank Wolf (inc.) | 103,648 | 71.60 | |
| Democratic | Cornell W. Brooks | 36,476 | 25.20 | |
| Independent | Robert A. Buchanan | 4,506 | 3.11 | |
| Write-ins | 125 | 0.09 | ||
| Total votes | 144,755 | 100.00 | ||
| Republican hold | ||||
Source:[30]
2000 election
| Party | Candidate | Votes | % | |
|---|---|---|---|---|
| Republican | Frank Wolf (inc.) | 238,817 | 84.20 | |
| Independent | Brian M. Brown | 28,107 | 9.91 | |
| Independent | Marc A. Rossi | 16,031 | 5.65 | |
| Write-ins | 682 | 0.24 | ||
| Total votes | 283,637 | 100.00 | ||
| Republican hold | ||||
Source:[31]
2002 election
| Party | Candidate | Votes | % | |
|---|---|---|---|---|
| Republican | Frank Wolf (inc.) | 115,917 | 71.72 | |
| Democratic | John B. Stevens, Jr. | 45,464 | 28.13 | |
| Write-ins | 234 | 0.14 | ||
| Total votes | 161,615 | 100.00 | ||
| Republican hold | ||||
Source:[32]
2004 election
| Party | Candidate | Votes | % | |
|---|---|---|---|---|
| Republican | Frank Wolf (inc.) | 205,982 | 63.77 | |
| Democratic | James R. Socas | 116,654 | 36.11 | |
| Write-ins | 375 | 0.12 | ||
| Total votes | 323,011 | 100.00 | ||
| Republican hold | ||||
Source:[33]
2006 election
| Party | Candidate | Votes | % | |
|---|---|---|---|---|
| Republican | Frank Wolf (inc.) | 138,213 | 57.32 | |
| Democratic | Judy Feder | 98,769 | 40.96 | |
| Libertarian | Wilbur N. Wood III | 2,107 | 0.87 | |
| Independent | Neeraj C. Nigam | 1,851 | 0.77 | |
| Write-ins | 194 | 0.08 | ||
| Total votes | 241,134 | 100.00 | ||
| Republican hold | ||||
Source:[34]
2008 election
| Party | Candidate | Votes | % | |
|---|---|---|---|---|
| Republican | Frank Wolf (inc.) | 223,140 | 58.80 | |
| Democratic | Judy Feder | 147,357 | 38.83 | |
| Independent | Neeraj C. Nigam | 8,457 | 2.23 | |
| Write-ins | 526 | 0.14 | ||
| Total votes | 379,480 | 100.00 | ||
| Republican hold | ||||
Source:[35]
2010 election
| Party | Candidate | Votes | % | |
|---|---|---|---|---|
| Republican | Frank Wolf (inc.) | 131,116 | 62.87 | |
| Democratic | Jeff Barnett | 72,604 | 34.81 | |
| Libertarian | Bill Redpath | 4,607 | 2.21 | |
| Write-ins | 229 | 0.11 | ||
| Total votes | 208,556 | 100.00 | ||
| Republican hold | ||||
Source:[36]
2012 election
| Party | Candidate | Votes | % | |
|---|---|---|---|---|
| Republican | Frank Wolf (inc.) | 214,038 | 58.41 | |
| Democratic | Kristin Cabral | 142,024 | 38.76 | |
| Independent | Kevin Chisholm | 9,855 | 2.69 | |
| Write-in | 527 | 0.14 | ||
| Total votes | 366,444 | 100 | ||
| Republican hold | ||||
2014 election
| Party | Candidate | Votes | % | |
|---|---|---|---|---|
| Republican | Barbara Comstock | 125,914 | 56.49 | |
| Democratic | John Foust | 89,957 | 40.36 | |
| Libertarian | Bill Redpath | 3,393 | 1.52 | |
| Independent | Brad Eickholt | 2,442 | 1.10 | |
| Independent Greens | Dianne Blais | 946 | 0.42 | |
| Write-in | 258 | 0.12 | ||
| Total votes | 222,910 | 100 | ||
| Republican hold | ||||
2016 election
| Party | Candidate | Votes | % | ± | |
|---|---|---|---|---|---|
| Republican | Barbara Jean Comstock (inc.) | 210,791 | 52.69% | -3.8% | |
| Democratic | LuAnn L. Bennett | 187,712 | 46.92% | +6.56% | |
| Write-in | 1,580 | 0.39% | +0.27% | ||
| Total votes | 400,083 | 100% | +177,173 | ||
| Republican hold | |||||
List of representatives
| Representative | Party | Years | Electoral history |
|---|---|---|---|
| District created: March 4, 1789 | |||
 |
Pro-Administration | March 4, 1789 – March 3, 1791 |
[Data unknown/missing.] |
| Anti-Administration | March 4, 1791 – March 3, 1793 |
Redistricted to the 13th district | |
| Carter B. Harrison | Anti-Administration | March 4, 1793 – March 3, 1795 |
[Data unknown/missing.] |
| Democratic-Republican | March 4, 1795 – March 3, 1799 |
Retired | |
| Edwin Gray | Democratic-Republican | March 4, 1799 – March 3, 1803 |
Redistricted to the 19th district |
| John Dawson | Democratic-Republican | March 4, 1803 – March 3, 1813 |
Redistricted to the 11th district |
| Aylett Hawes | Democratic-Republican | March 4, 1813 – March 3, 1817 |
Retired |
| George F. Strother | Democratic-Republican | March 4, 1817 – February 10, 1820 |
Resigned |
| Vacant | February 11, 1820 – November 12, 1820 | ||
| Thomas L. Moore | Democratic-Republican | November 13, 1820 – March 3, 1823 |
Retired |
 |
Crawford D-R | March 4, 1823 – March 3, 1825 |
[Data unknown/missing.] |
| Jacksonian | March 4, 1825 – April 17, 1829 |
Appointed U.S. Minister to France | |
| Vacant | April 18, 1829 – January 24, 1830 | ||
| William F. Gordon | Jacksonian | January 25, 1830 – March 3, 1833 |
Redistricted to the 12th district |
| Joseph W. Chinn | Jacksonian | March 4, 1833 – March 3, 1835 |
Lost re-election |
| John Taliaferro | Anti-Jacksonian | March 4, 1835 – March 3, 1837 |
[Data unknown/missing.] |
| Whig | March 4, 1837 – March 3, 1843 |
Retired | |
 |
Democratic | March 4, 1843 – March 3, 1845 |
Lost re-election |
| Henry Bedinger III | Democratic | March 4, 1845 – March 3, 1849 |
Lost re-election |
 |
Democratic | March 4, 1849 – March 3, 1851 |
Elected Virginia Circuit Court judge |
 |
Whig | March 4, 1851 – March 3, 1853 |
Redistricted to the 8th district |
 |
Democratic | March 4, 1853 – March 3, 1857 |
Retired |
 |
Democratic | March 4, 1857 – March 3, 1861 |
Retired |
 |
Unionist | March 4, 1861 – March 3, 1863 |
Retired |
| Vacant | March 4, 1863 – June 19, 1863 |
Civil War | |
| District eliminated June 20, 1863 | |||
| District recreated March 4, 1885 | |||
 |
Democratic | March 4, 1885 – March 3, 1887 |
Retired |
| Jacob Yost | Republican | March 4, 1887 – March 3, 1889 |
Lost re-election |
 |
Democratic | March 4, 1889 – March 3, 1897 |
Retired |
| Jacob Yost | Republican | March 4, 1897 – March 3, 1899 |
Retired |
 |
Democratic | March 4, 1899 – March 3, 1901 |
Retired |
 |
Democratic | March 4, 1901 – December 8, 1921 |
Died |
| Vacant | December 9, 1921 – March 20, 1922 | ||
|
Democratic | March 21, 1922 – July 23, 1932 |
Died |
| Vacant | July 24, 1932 – November 7, 1932 | ||
| Joel W. Flood | Democratic | November 8, 1932 – March 3, 1933 |
Retired |
| District eliminated March 4, 1933 | |||
| District re-created: January 3, 1953 | |||
 |
Republican | January 3, 1953 – December 31, 1974 |
Lost re-election |
| Vacant | December 31, 1974 – January 3, 1975 | ||
 |
Democratic | January 3, 1975 – January 3, 1981 |
Lost re-election |
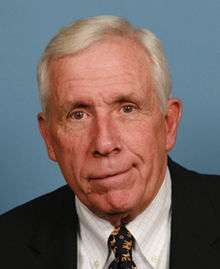 |
Republican | January 3, 1981 – January 3, 2015 |
Retired |
.jpg) |
Republican | January 3, 2015 – |
|
Historical district boundaries
Election results from recent presidential races
| Year | Results |
|---|---|
| 2000 | Bush 56–41% |
| 2004 | Bush 55–44% |
| 2008 | Obama 53–46% |
| 2012 | Romney 50.8–49.2% |
| 2016 | Clinton 52.2–42.2% |
See also
References
- ↑ https://www.census.gov/geo/maps-data/data/cd_state.html
- ↑ https://www.census.gov/mycd/?st=51&cd=10
- ↑ "Partisan Voting Index – Districts of the 115th Congress" (PDF). The Cook Political Report. April 7, 2017. Retrieved April 7, 2017.
- ↑ McCaffrey, Scott (20 July 2018). "Ex-Del. Brink: Wexton has edge, but count Comstock out at your peril". Inside Nova.
- ↑ Kondik, Kyle; Skelley, Geoffrey. "House 2016: How a Democratic Wave Could Happen". University of Virginia Center for Politics. Retrieved 20 April 2016.
- ↑ Brownstein, Ronald (20 July 2018). "There are absolutely two Americas. Sometimes in the same state". NBC.
- ↑ Portnoy, Jenna (1 August 2018). "Rep. Comstock, running for reelection, won't vote for a government shutdown no matter how much Trump wants one". Washington Post.
- ↑ Edgerton, Anna (9 August 2018). "A 'Killer Campaigner' for the GOP Swims Against a Blue Tide in Virginia". Bloomberg.
- ↑ Virginia Department of Elections. Official election results. The Library of Virginia.
- 1 2 "Presidential Results by Congressional District, 2000-2008".
- ↑ Virginia State Board of Elections: Results by District, 2008 Presidential election. Accessed February 11, 2015.
- ↑ Virginia State Board of Elections: Results by District, 2012 Presidential election. Accessed February 11, 2015.
- ↑ Daily Kos Virginia 2013 gubernatorial results by Congressional District . Accessed October 27, 2016.
- ↑ "Daily Kos Elections' presidential results by congressional district for the 2016 and 2012 elections". Daily Kos. Retrieved 2017-01-13.
- ↑ "2017 Governor's Election Results by US Congressional District". VPAP. Retrieved 2017-12-03.
- ↑ http://clerk.house.gov/member_info/electionInfo/1970election.pdf
- ↑ http://clerk.house.gov/member_info/electionInfo/1972election.pdf
- ↑ http://clerk.house.gov/member_info/electionInfo/1974election.pdf
- ↑ http://clerk.house.gov/member_info/electionInfo/1976election.pdf
- ↑ http://clerk.house.gov/member_info/electionInfo/1978election.pdf
- ↑ http://clerk.house.gov/member_info/electionInfo/1980election.pdf
- ↑ http://clerk.house.gov/member_info/electionInfo/1982election.pdf
- ↑ http://clerk.house.gov/member_info/electionInfo/1984election.pdf
- ↑ http://clerk.house.gov/member_info/electionInfo/1986election.pdf
- ↑ http://clerk.house.gov/member_info/electionInfo/1988election.pdf
- ↑ http://clerk.house.gov/member_info/electionInfo/1990election.pdf
- ↑ http://clerk.house.gov/member_info/electionInfo/1992election.pdf
- ↑ http://clerk.house.gov/member_info/electionInfo/1994election.pdf
- ↑ http://clerk.house.gov/member_info/electionInfo/1996election.pdf
- ↑ http://clerk.house.gov/member_info/electionInfo/1998election.pdf
- ↑ "2000 ELECTION STATISTICS".
- ↑ "2002 ELECTION STATISTICS".
- ↑ "2004 ELECTION STATISTICS".
- ↑ "2006 Election Statistics".
- ↑ "Archived copy". Archived from the original on April 1, 2012. Retrieved July 21, 2012.
- ↑ "Archived copy". Archived from the original on July 21, 2011. Retrieved January 7, 2011.
- ↑ "November 6, 2012 General Election Official Results". Virginia State Board of Elections. Archived from the original on May 12, 2013. Retrieved December 14, 2012.
- ↑ "Archived copy". Archived from the original on November 7, 2014. Retrieved December 22, 2014.
- ↑ "2016 November General". Results.elections.virginia.gov. Retrieved 2017-03-23.
- Martis, Kenneth C. (1989). The Historical Atlas of Political Parties in the United States Congress. New York: Macmillan Publishing Company.
- Martis, Kenneth C. (1982). The Historical Atlas of United States Congressional Districts. New York: Macmillan Publishing Company.
- Congressional Biographical Directory of the United States 1774–present
External links
Coordinates: 39°04′33″N 77°51′24″W / 39.07583°N 77.85667°W