Utah's 3rd congressional district
| Utah's 3rd congressional district | |
|---|---|
.tif.png) Utah's 3rd congressional district – | |
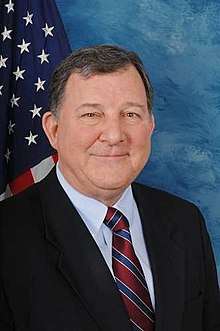
| Current Representative | John Curtis (R–Provo) |
| Ethnicity |
|
| Cook PVI | R+25[1] |
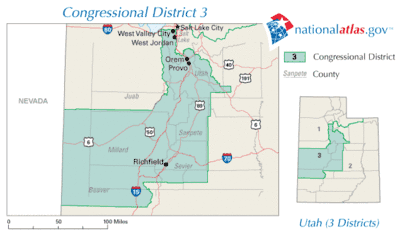
Utah's 3rd congressional district is a congressional district in the United States House of Representatives. It is located in southern and eastern Utah and includes the cities of Orem and Provo.
The district was created when Utah was awarded an extra congressional seat following the 1980 U.S. Census. Four of its five Representatives have been Republicans; Bill Orton, a Democrat, represented the district from 1991 to 1997. The current Representative is Republican John Curtis, elected in a special election November 7, 2017.
Recent election results from statewide races
Source: "Presidential Election Results, by district" – via swingstateproject.com.
| Year | Office | Result |
|---|---|---|
| 2000 | President | Bush 75 – 24% |
| 2004 | President | Bush 77 – 20% |
| 2008 | President | McCain 67 – 29% |
| 2012 | President | Romney 78 – 20% |
| 2016 | President | Trump 47 – 23% |
List of representatives
| Representative | Party | Years | Congress | Electoral history | |
|---|---|---|---|---|---|
| District created January 3, 1983 | |||||
 |
Republican | January 3, 1983 – January 3, 1991 |
98th 99th 100th 101st |
First elected in 1982. Re-elected in 1984. Re-elected in 1986. Re-elected in 1988. Retired. | |
 |
Democratic | January 3, 1991 – January 3, 1997 |
102nd 103rd 104th |
First elected in 1990. Re-elected in 1992. Re-elected in 1994. Lost re-election. | |
 |
Republican | January 3, 1997 – January 3, 2009 |
105th 106th 107th 108th 109th 110th |
First elected in 1996. Re-elected in 1998. Re-elected in 2000. Re-elected in 2002. Re-elected in 2004. Re-elected in 2006. Lost renomination. | |
 |
Republican | January 3, 2009 – June 30, 2017 |
111th 112th 113th 114th 115th |
First elected in 2008. Re-elected in 2010. Re-elected in 2012. Re-elected in 2014. Re-elected in 2016. Resigned.[2] | |
| Vacant | June 30, 2017 – November 7, 2017 |
115th | |||
.png) |
Republican | November 7, 2017 – present |
115th | Elected to finish Chaffetz's term. | |
Election results
|
1982 • 1984 • 1986 • 1988 • 1990 • 1992 • 1994 • 1996 • 1998 • 2000 • 2002 • 2004 • 2006 • 2008 • 2010 • 2012 • 2014 • 2016 • 2017 (Special) |
1982
| Party | Candidate | Votes | % | ||
|---|---|---|---|---|---|
| Republican | Howard C. Nielson | 108,478 | 76.86 | ||
| Independent | Henry A. Huish | 32,661 | 23.14 | ||
| Total votes | 141,139 | 100.0 | |||
| Republican win (new seat) | |||||
1984
| Party | Candidate | Votes | % | |
|---|---|---|---|---|
| Republican | Howard C. Nielson (incumbent) | 138,918 | 74.46 | |
| Democratic | Bruce R. Baird | 46,560 | 24.95 | |
| Libertarian | D.W. Crosby | 1,094 | 0.59 | |
| Total votes | 186,572 | 100.0 | ||
| Republican hold | ||||
1986
| Party | Candidate | Votes | % | |
|---|---|---|---|---|
| Republican | Howard C. Nielson (incumbent) | 86,599 | 66.58 | |
| Democratic | Dale F. Gardiner | 42,582 | 32.74 | |
| Socialist Workers | David P. Hurst | 893 | 0.68 | |
| Total votes | 130,074 | 100.0 | ||
| Republican hold | ||||
1988
| Party | Candidate | Votes | % | |
|---|---|---|---|---|
| Republican | Howard C. Nielson (incumbent) | 129,951 | 66.83 | |
| Democratic | Robert W. Stringham | 60,018 | 30.86 | |
| American | E. Dean Christensen | 3,285 | 1.69 | |
| Socialist Workers | Judy Stranahan | 1,207 | 0.62 | |
| Total votes | 194,461 | 100.0 | ||
| Republican hold | ||||
1990
| Party | Candidate | Votes | % | |||
|---|---|---|---|---|---|---|
| Democratic | Bill Orton | 79,163 | 58.35 | |||
| Republican | Karl Snow | 49,452 | 36.45 | |||
| American | Robert J. Smith | 6,542 | 4.82 | |||
| Socialist Workers | Anthony Melvin Dutrow | 519 | 0.38 | |||
| Total votes | 135,676 | 100.0 | ||||
| Democratic gain from Republican | ||||||
1992
| Party | Candidate | Votes | % | |
|---|---|---|---|---|
| Democratic | Bill Orton (incumbent) | 135,029 | 58.95 | |
| Republican | Richard R. Harrington | 84,019 | 36.68 | |
| Independent | Wayne L. Hill | 5,764 | 2.52 | |
| Independent | Charles M. Wilson | 2,068 | 0.90 | |
| Libertarian | Doug Jones | 1,797 | 0.78 | |
| Socialist Workers | Nels J'Anthony | 384 | 0.17 | |
| Total votes | 229,061 | 100.0 | ||
| Democratic hold | ||||
1994
| Party | Candidate | Votes | % | |
|---|---|---|---|---|
| Democratic | Bill Orton (incumbent) | 91,505 | 58.98 | |
| Republican | Dixie Thompson | 61,839 | 39.86 | |
| Socialist Workers | Barbara Greenway | 1,802 | 1.16 | |
| Total votes | 155,146 | 100.0 | ||
| Democratic hold | ||||
1996
| Party | Candidate | Votes | % | |||
|---|---|---|---|---|---|---|
| Republican | Chris Cannon | 106,220 | 51.14 | |||
| Democratic | Bill Orton (incumbent) | 98,178 | 47.27 | |||
| Libertarian | Amy L. Lassen | 2,341 | 1.13 | |||
| Independent | Gerald "Bear" Slothower | 706 | 0.34 | |||
| Socialist Workers | John Phillip Langford | 270 | 0.13 | |||
| Total votes | 207,715 | 100.0 | ||||
| Republican gain from Democratic | ||||||
1998
| Party | Candidate | Votes | % | |
|---|---|---|---|---|
| Republican | Chris Cannon (incumbent) | 100,830 | 76.90 | |
| Independent American | Will Christensen | 20,720 | 15.80 | |
| Libertarian | Kitty K. Burton | 9,553 | 7.29 | |
| Write-in | 20 | 0.01 | ||
| Total votes | 131,123 | 100.0 | ||
| Republican hold | ||||
2000
| Party | Candidate | Votes | % | |
|---|---|---|---|---|
| Republican | Chris Cannon (incumbent) | 138,943 | 58.54 | |
| Democratic | Donald Dunn | 88,547 | 37.31 | |
| Independent American | Michael J. Lehman | 5,436 | 2.29 | |
| Libertarian | Kitty K. Burton | 3,570 | 1.50 | |
| Natural Law | Randall Tolpinrud | 852 | 0.36 | |
| Total votes | 237,348 | 100.0 | ||
| Republican hold | ||||
2002
| Party | Candidate | Votes | % | |
|---|---|---|---|---|
| Republican | Chris Cannon (incumbent) | 103,598 | 67.43 | |
| Democratic | Nancy Jane Woodside | 44,533 | 28.98 | |
| Libertarian | Kitty K. Burton | 5,511 | 3.59 | |
| Write-in | John William Maurin | 1 | 0.00 | |
| Total votes | 153,643 | 100.0 | ||
| Republican hold | ||||
2004
| Party | Candidate | Votes | % | |
|---|---|---|---|---|
| Republican | Chris Cannon (incumbent) | 173,010 | 63.39 | |
| Democratic | Beau Babka | 88,748 | 32.52 | |
| Constitution | Ronald Winfield | 5,089 | 1.86 | |
| Libertarian | Jim Dexter | 3,691 | 1.35 | |
| Personal Choice | Curtis Darrell James | 2,390 | 0.88 | |
| Total votes | 272,928 | 100.0 | ||
| Republican hold | ||||
2006
| Party | Candidate | Votes | % | |
|---|---|---|---|---|
| Republican | Chris Cannon (incumbent) | 95,455 | 57.71 | |
| Democratic | Christian Burridge | 53,330 | 32.24 | |
| Constitution | Jim Noorlander | 14,533 | 8.79 | |
| Libertarian | Philip Lear Hallman | 2,080 | 1.26 | |
| Total votes | 165,398 | 100.0 | ||
| Republican hold | ||||
2008
| Party | Candidate | Votes | % | |
|---|---|---|---|---|
| Republican | Jason Chaffetz | 187,035 | 65.61 | |
| Democratic | Bennion Spencer | 80,626 | 28.28 | |
| Constitution | Jim Noorlander | 17,408 | 6.11 | |
| Total votes | 285,069 | 100.0 | ||
| Republican hold | ||||
2010
| Party | Candidate | Votes | % | |
|---|---|---|---|---|
| Republican | Jason Chaffetz (incumbent) | 139,721 | 72.32 | |
| Democratic | Karen Hyer | 44,320 | 22.94 | |
| Constitution | Douglas Sligting | 4,596 | 2.38 | |
| Libertarian | Jake Shannon | 2,945 | 1.52 | |
| Independent | Joseph L. Puente | 1,604 | 0.83 | |
| Total votes | 193,186 | 100.0 | ||
| Republican hold | ||||
2012
| Party | Candidate | Votes | % | |
|---|---|---|---|---|
| Republican | Jason Chaffetz (incumbent) | 198,828 | 76.61 | |
| Democratic | Soren Simonsen | 60,719 | 23.39 | |
| Total votes | 259,547 | 100.0 | ||
| Republican hold | ||||
2014
| Party | Candidate | Votes | % | |
|---|---|---|---|---|
| Republican | Jason Chaffetz (incumbent) | 102,952 | 72.21 | |
| Democratic | Brian Wonnacott | 32,059 | 22.48 | |
| Independent American | Zack Strong | 3,192 | 2.24 | |
| Unaffiliated | Stephen P. Tryon | 2,584 | 1.81 | |
| Unaffiliated | Ben J. Mates | 1,513 | 1.06 | |
| Write-in | David A. Else | 280 | 0.20 | |
| Total votes | 142,580 | 100.0 | ||
| Republican hold | ||||
2016
| Party | Candidate | Votes | % | |
|---|---|---|---|---|
| Republican | Jason Chaffetz (incumbent) | 209,589 | 73.46 | |
| Democratic | Stephen P. Tryon | 75,716 | 26.54 | |
| Total votes | 285,305 | 100.0 | ||
| Republican hold | ||||
2017 (Special)
| Party | Candidate | Votes | % | |
|---|---|---|---|---|
| Republican | John Curtis | 85,739 | 58.03% | |
| Democratic | Kathie Allen | 37,778 | 25.57% | |
| United Utah | Jim Bennett | 13,745 | 9.30% | |
| Independent | Sean Whalen | 4,550 | 3.08% | |
| Libertarian | Joe Buchman | 3,643 | 2.47% | |
| Independent American | Jason Christensen | 2,286 | 1.55% | |
| Write-in | Brendan Phillips | — | — | |
| Write-in | Russell Paul Roesler | — | — | |
| Total votes | 147,741 | 100.00% | ||
| Republican hold | ||||
Historical district boundaries
See also
References
- ↑ "Partisan Voting Index – Districts of the 115th Congress" (PDF). The Cook Political Report. April 7, 2017. Retrieved April 7, 2017.
- ↑ Tribune, Courtney Tanner And Lee Davidson The Salt Lake. "Utah sets condensed special election calendar – and it's already started". The Salt Lake Tribune. Retrieved May 22, 2017.
- ↑ Clerk of the House of Representatives (May 5, 1983). "Statistics of the Congressional Election of November 2, 1982" (PDF). U.S. Government Printing Office.
- ↑ 1984 Election Results
- ↑ 1986 Election Results
- ↑ 1988 Election Results
- ↑ 1990 Election Results
- ↑ 1992 Election Results
- ↑ 1994 Election Results
- ↑ 1996 Election Results
- ↑ 1998 Election Results
- ↑ 2000 Election Results
- ↑ 2002 Election Results
- ↑ 2004 Election Results
- ↑ 2006 Election Results
- ↑ 2008 Election Results
- ↑ 2010 Election Results
- ↑ 2012 Election Results
- ↑ 2014 Election Results
- ↑ 2016 Election Results
- ↑ "Utah Election Preliminary Results". State of Utah. Retrieved December 23, 2017.
External links
- "U.S. House, Utah – 3rd District". CQ Politics. Congressional Quarterly, Inc. Retrieved July 9, 2008.
Coordinates: 38°41′48″N 110°12′59″W / 38.69667°N 110.21639°W