Demography
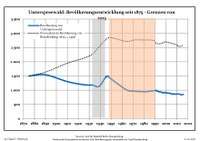
Development of population since 1875 within the current boundaries (Blue line: Population; Dotted line: Comparison to population development of Brandenburg state; Grey background: Time of Nazi rule; Red background: Time of communist rule)
Unterspreewald:
Population development within the current boundaries (2013)[2]
| Year |
Population |
|---|
| 1875 | 1 498 |
| 1890 | 1 542 |
| 1910 | 1 301 |
| 1925 | 1 191 |
| 1933 | 1 178 |
| 1939 | 1 136 |
| 1946 | 1 490 |
| 1950 | 1 393 |
| 1964 | 1 010 |
| 1971 | 964 |
|
|
| Year |
Population |
|---|
| 1981 | 945 |
| 1985 | 959 |
| 1989 | 982 |
| 1990 | 982 |
| 1991 | 995 |
| 1992 | 966 |
| 1993 | 955 |
| 1994 | 944 |
| 1995 | 939 |
| 1996 | 930 |
|
|
| Year |
Population |
|---|
| 1997 | 906 |
| 1998 | 913 |
| 1999 | 922 |
| 2000 | 893 |
| 2001 | 906 |
| 2002 | 898 |
| 2003 | 892 |
| 2004 | 889 |
| 2005 | 869 |
| 2006 | 857 |
|
|
| Year |
Population |
|---|
| 2007 | 871 |
| 2008 | 863 |
| 2009 | 860 |
| 2010 | 862 |
| 2011 | 860 |
| 2012 | 868 |
| 2013 | 855 |
| 2014 | 830 |
| 2015 | 851 |
| 2016 | 845 |
|
|
References
Authority control  | |
|---|