Spreewaldheide
| Spreewaldheide | |
|---|---|
 Spreewaldheide Location of Spreewaldheide within Dahme-Spreewald district  | |
| Coordinates: 51°57′00″N 14°07′59″E / 51.95000°N 14.13306°ECoordinates: 51°57′00″N 14°07′59″E / 51.95000°N 14.13306°E | |
| Country | Germany |
| State | Brandenburg |
| District | Dahme-Spreewald |
| Municipal assoc. | Lieberose/Oberspreewald |
| Government | |
| • Mayor | Manfred Meehs |
| Area | |
| • Total | 35.99 km2 (13.90 sq mi) |
| Elevation | 54 m (177 ft) |
| Population (2017-12-31)[1] | |
| • Total | 480 |
| • Density | 13/km2 (35/sq mi) |
| Time zone | CET/CEST (UTC+1/+2) |
| Postal codes | 15913 |
| Dialling codes | 035475 |
| Vehicle registration | LDS |
Spreewaldheide is a municipality in the district of Dahme-Spreewald in Brandenburg in Germany.
Demography
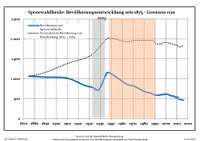
Development of population since 1875 within the current boundaries (Blue line: Population; Dotted line: Comparison to population development of Brandenburg state; Grey background: Time of Nazi rule; Red background: Time of communist rule)
|
|
|
|
References
- ↑ "Bevölkerung im Land Brandenburg nach amtsfreien Gemeinden, Ämtern und Gemeinden 31. Dezember 2017 (Fortgeschriebene amtliche Einwohnerzahlen auf Grundlage des Zensus 2011)". Amt für Statistik Berlin-Brandenburg (in German). 2018.
- ↑ Detailed data sources are to be found in the Wikimedia Commons.Population Projection Brandenburg at Wikimedia Commons
This article is issued from
Wikipedia.
The text is licensed under Creative Commons - Attribution - Sharealike.
Additional terms may apply for the media files.