1815 eruption of Mount Tambora
| 1815 eruption of Mount Tambora | |
|---|---|
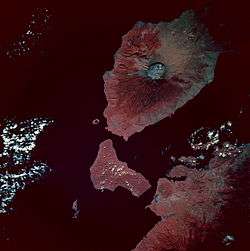 False color image of Mount Tambora, taken from the Space Shuttle Endeavour on 13 May 1992 (for orientation, the top of the image is towards the East). | |
| Volcano | Mount Tambora |
| Date | 1815 |
| Type | Vesuvian |
| Location |
Sumbawa, Lesser Sunda Islands, Dutch East Indies 8°15′S 118°00′E / 8.25°S 118°ECoordinates: 8°15′S 118°00′E / 8.25°S 118°E |
| VEI | 7 |
| Impact | Reduced global temperatures, with the following year, 1816, called the Year Without a Summer. |
The 1815 eruption of Mount Tambora was one of the most powerful in recorded history, with a Volcanic Explosivity Index (VEI) of 7. It is the most recently known VEI-7 event and the only unambiguously confirmed VEI-7 eruption since the Lake Taupo eruption in about 180 AD.[1]
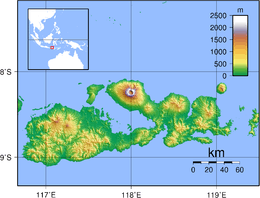
Mount Tambora is on the island of Sumbawa in present-day Indonesia, then part of the Dutch East Indies. Although its eruption reached a violent climax on 10 April 1815,[2] increased steaming and small phreatic eruptions occurred during the next six months to three years. The ash from the eruption column dispersed around the world and lowered global temperatures, in an event sometimes known as the Year Without a Summer in 1816.[3] This brief period of significant climate change triggered extreme weather and harvest failures in many areas around the world. Several climate forcings coincided and interacted in a systematic manner that has not been observed after any other large volcanic eruption since the early Stone Age. Although scientists have proven that the post-eruption climate changes and the Tambora eruption are linked, they have only an incomplete understanding of the processes involved.[4]
Chronology of the eruption
Mount Tambora experienced several centuries of dormancy before 1815, caused by the gradual cooling of hydrous magma in its closed magma chamber.[5] Inside the chamber at depths between 1.5 and 4.5 kilometres (0.93 and 2.80 mi), the exsolution of a high-pressure fluid magma formed during cooling and crystallisation of the magma. An over-pressurization of the chamber of about 4,000–5,000 bar (400–500 MPa; 58,000–73,000 psi) was generated, with the temperature ranging from 700–850 °C (1,292–1,562 °F).[5] In 1812, the volcano began to rumble and generated a dark cloud.[6]
On 5 April 1815, a very large eruption occurred, followed by thunderous detonation sounds heard in Makassar on Sulawesi 380 kilometres (240 mi) away, Batavia (now Jakarta) on Java 1,260 kilometres (780 mi) away, and Ternate on the Molucca Islands 1,400 kilometres (870 mi) away. On the morning of 6 April, volcanic ash began to fall in East Java with faint detonation sounds lasting until 10 April. What was first thought to be the sound of firing guns was heard on 10 April on Sumatra, more than 2,600 kilometres (1,600 mi) away.[7]
At about 7 pm on 10 April, the eruptions intensified.[6] Three columns of flame rose up and merged.[7]:249 The whole mountain was turned into a flowing mass of "liquid fire".[7]:249 Pumice stones of up to 20 centimetres (7.9 in) in diameter started to rain down around 8 pm, followed by ash at around 9–10 pm. Pyroclastic flows cascaded down the mountain to the sea on all sides of the peninsula, wiping out the village of Tambora. Loud explosions were heard until the next evening, 11 April. The ash veil spread as far as West Java and South Sulawesi. A nitrous odour was noticeable in Batavia, and heavy tephra-tinged rain fell, finally receding between 11 and 17 April.[6]
—Sir Stamford Raffles' memoir.[7]:241
The explosion had an estimated VEI of 7.[8] An estimated 41 cubic kilometres (9.8 cu mi) of pyroclastic trachyandesite were ejected, weighing about 10 billion tonnes. This has left a caldera measuring 6–7 kilometres (3.7–4.3 mi) across and 600–700 metres (2,000–2,300 ft) deep.[6] The density of fallen ash in Makassar was 636 kilograms per cubic metre (1,072 lb/cu yd).[9] Before the explosion, Mount Tambora's peak elevation was about 4,300 metres (14,100 ft),[6] making it one of the tallest peaks in the Indonesian archipelago. After the explosion, its peak elevation had dropped to only 2,851 metres (9,354 ft), about two-thirds of its previous height.[10]
The 1815 Tambora eruption is the largest observed eruption in recorded history, as shown in Table 1.[6][1] The explosion was heard 2,600 kilometres (1,600 mi) away, and ash fell at least 1,300 kilometres (810 mi) away.[6]
Aftermath
—Lt. Philips, ordered by Sir Stamford Raffles to go to Sumbawa.[7]:248–249
All vegetation on the island was destroyed. Uprooted trees, mixed with pumice ash, washed into the sea and formed rafts up to 5 kilometres (3.1 mi) across.[6] Between 1 and 3 October the British ships Fairlie and James Sibbald encountered extensive pumice rafts about 3,600 kilometres (2,200 mi) west of Tambora.[11] Clouds of thick ash still covered the summit on 23 April. Explosions ceased on 15 July, although smoke emissions were observed as late as 23 August. Flames and rumbling aftershocks were reported in August 1819, four years after the event.
A moderate-sized tsunami struck the shores of various islands in the Indonesian archipelago on 10 April, with a height of up to 4 metres (13 ft) in Sanggar around 10 pm.[6] A tsunami of 1–2 metres (3 ft 3 in–6 ft 7 in) in height was reported in Besuki, East Java, before midnight, and one of 2 metres (6 ft 7 in) in height in the Molucca Islands. The total death toll has been estimated to be around 4,600.[12]
The eruption column reached the stratosphere at an altitude of more than 43 kilometres (141,000 ft).[1] The coarser ash particles settled out one to two weeks after the eruptions, but the finer ash particles stayed in the atmosphere from a few months to a few years at altitudes of 10–30 kilometres (33,000–98,000 ft).[6] Longitudinal winds spread these fine particles around the globe, creating optical phenomena. Prolonged and brilliantly coloured sunsets and twilights were seen frequently in London between 28 June and 2 July 1815 and 3 September and 7 October 1815.[6] The glow of the twilight sky typically appeared orange or red near the horizon and purple or pink above.
The estimated number of deaths varies depending on the source. Zollinger (1855) puts the number of direct deaths at 10,000, probably caused by pyroclastic flows. On Sumbawa, 38,000 starved to death. About 10,000 people on Lombok died from disease and hunger.[13] Petroeschevsky (1949) estimated that about 48,000 people were killed on Sumbawa and 44,000 on Lombok.[14] Stothers in 1984 and several other authors have accepted Petroeschevsky's claim of 88,000 deaths in total.[6] However, a 1998 journal article authored by J. Tanguy and others claimed that Petroeschevsky's figures were unfounded and based on untraceable references.[15] Tanguy's revision of the death toll was based on Zollinger's work on Sumbawa for several months after the eruption and on Thomas Raffles's notes.[7] Tanguy pointed out that there may have been additional victims on Bali and East Java because of famine and disease. Their estimate was 11,000 deaths from direct volcanic effects and 49,000 by post-eruption famine and epidemic diseases.[15] Oppenheimer wrote that there were at least 71,000 deaths in total.[1] Reid has estimated that 100,000 people on Sumbawa, Bali, and other locations died from the direct and indirect effects of the eruption.[16]
Disruption of global temperatures
During the northern hemisphere summer of 1816, global temperatures cooled by 0.53 °C (0.95 °F). This very significant cooling directly or indirectly caused 90,000 deaths. The eruption of Mount Tambora was the most significant cause of this climate anomaly.[17] While there were other eruptions in 1815, Tambora is classified as a VEI-7 eruption with a column 45 kilometres (28 mi) tall, eclipsing all others by at least one order of magnitude.
The VEI is used to quantify the amount of ejected material, with a VEI-7 being 100 cubic kilometres (24 cu mi). Every index value below that is one order of magnitude (meaning, ten times) less. Furthermore, the 1815 eruption occurred during a Dalton Minimum, a period of unusually low solar radiation.[18] Volcanism plays a large role in climate shifts, both locally and globally. This was not always understood and did not enter scientific circles as fact until Krakatoa erupted in 1883 and tinted the skies orange.[17]
The scale of the volcanic eruption will determine the significance of the impact on climate and other chemical processes, but a change will be measured even in the most local of environments. When volcanoes erupt, they eject carbon dioxide (CO2), water, hydrogen, sulfur dioxide (SO2), hydrogen chloride, hydrogen fluoride, and many other gases.(Meronen et al. 2012) CO2 and water are greenhouse gases, comprising 0.0394 percent and 0.4 percent of the atmosphere, respectively. Their small ratio disguises their significant role in trapping solar insolation and reradiating it back to Earth.
Global effects
The 1815 eruption released SO2 into the stratosphere, causing a global climate anomaly. Different methods have estimated the ejected sulphur mass during the eruption: the petrological method; an optical depth measurement based on anatomical observations; and the polar ice core sulfate concentration method, using cores from Greenland and Antarctica. The figures vary depending on the method, ranging from 10 to 120 million tonnes.[1]
In the spring and summer of 1815, a persistent "dry fog" was observed in the northeastern United States. The fog reddened and dimmed the sunlight, such that sunspots were visible to the naked eye. Neither wind nor rainfall dispersed the "fog". It was identified as a stratospheric sulfate aerosol veil.[1] In summer 1816, countries in the Northern Hemisphere suffered extreme weather conditions, dubbed the "Year Without a Summer". Average global temperatures decreased by about 0.4 to 0.7 °C (0.7 to 1.3 °F),[6] enough to cause significant agricultural problems around the globe. On 4 June 1816, frosts were reported in the upper elevations of New Hampshire, Maine, Vermont, and northern New York. On 6 June 1816, snow fell in Albany, New York, and Dennysville, Maine.[1] Such conditions occurred for at least three months and ruined most agricultural crops in North America. Canada experienced extreme cold during that summer. Snow 30 cm (12 in) deep accumulated near Quebec City from 6 to 10 June 1816.
The second-coldest year in the Northern Hemisphere since around 1400 was 1816, and the 1810s are the coldest decade on record. That was the consequence of Tambora's 1815 eruption and possibly another VEI-6 eruption in late 1808. The surface temperature anomalies during the summer of 1816, 1817, and 1818 were −0.51 °C (−0.92 °F), −0.44 °C (−0.79 °F), and −0.29 °C (−0.52 °F), respectively.[8] Parts of Europe also experienced a stormier winter.
This climate anomaly has been blamed for the severity of typhus epidemics in southeast Europe and along the eastern Mediterranean Sea between 1816 and 1819.[1] The climate changes disrupted the Indian monsoons, caused three failed harvests and famine, and contributed to the spread of a new strain of cholera that originated in Bengal in 1816.[20] Many livestock died in New England during the winter of 1816–1817. Cool temperatures and heavy rains resulted in failed harvests in Britain and Ireland. Families in Wales travelled long distances as refugees, begging for food. Famine was prevalent in north and southwest Ireland, following the failure of wheat, oat, and potato harvests. The crisis was severe in Germany, where food prices rose sharply, and demonstrations in front of grain markets and bakeries, followed by riots, arson, and looting, took place in many European cities. It was the worst famine of the 19th century.[1]
Effects of volcanism
Volcanism affects the atmosphere in two distinct ways: short-term cooling caused by reflected insolation and long-term warming from increased CO2 levels. Most of the water vapor and CO2 is collected in clouds within a few weeks to months because both are already present in large quantities, so the effects are limited (Bodenmann et al. 2011). SO2, other aerosols, and particulates cause global cooling, thereby reducing or nullifying the global warming effects of a volcano's greenhouse gas emissions. SO2 can be found higher in the atmosphere and bonds efficiently there with water vapor to form sulfuric acid, which blocks solar radiation exceptionally well. It usually takes months to years for it to acquire enough water vapor to fall back to Earth. It has been suggested that a volcanic eruption in 1809 may also have contributed to a reduction in global temperatures.[19]
Impact of the eruption
By most calculations, the eruption of Tambora was at least a full order of magnitude larger than that of Mount Pinatubo in 1991.(Graft et al. 1993) An estimated 1,220 metres (4,000 ft) of the top of the mountain was reduced to rubble ash, reducing the height of the summit by a third. Around 100 cubic kilometres (24 cu mi) of rock was blasted into the air.(Williams 2012). Toxic gases also were pumped into the atmosphere, including sulfur that caused lung infections.(Cole-Dai et al. 2009) Volcanic ash was over 100 centimetres (39 in) deep within 75 kilometres (47 mi) of the eruption, while areas within a 500 kilometres (310 mi) radius saw a 5 centimetres (2.0 in) ash fall, and ash could be found as far away as 1,300 kilometres (810 mi).[1] The ash burned and smothered crops, creating an immediate shortage of food in Indonesia. (Cole-Dai et al. 2009) The ejection of these gases, especially hydrogen chloride, caused the precipitation to be extremely acidic, killing much of the crops that survived or were rebudding during the spring. The food shortages were compounded by the Napoleonic wars, floods, and cholera.[1]
The ash in the atmosphere for several months after the eruption reflected significant amounts of solar radiation, causing unseasonably cool summers that contributed to food shortages.[1] China, Europe, and North America had well-documented below normal temperatures, which devastated their harvests. The monsoon season in China and India was altered, causing flooding in the Yangtze Valley and forcing thousands of Chinese to flee coastal areas. (Granados et al. 2012) The gases also reflected some of the already-decreased incoming solar radiation, causing a 0.4 to 0.7 °C (0.7 to 1.3 °F) decrease in global temperatures throughout the decade. An ice dam formed in Switzerland during the summers of 1816 and 1817, earning 1816 the title "Year without a Summer".(Bodenmann et al. 2011) The winter months of 1816 were not much different from previous years, but the spring and summer maintained the cool-to-freezing temperatures. The winter of 1817, however, was radically different, with temperatures below −30 °F (−34 °C) in central and northern New York, which were cold enough to freeze lakes and rivers that were normally used to transport supplies. Both Europe and North America suffered from freezes lasting well into June, with snow accumulating to 32 centimetres (13 in) in August, which killed recently planted crops and crippled the food industry. The length of the growing seasons in parts of Massachusetts and New Hampshire were less than 80 days in 1816, resulting in harvest failures.(Oppenheimer 2003) Visually unique sunsets were observed in western Europe, and red fog was observed along the eastern coast of the U.S. These unique atmospheric conditions persisted for the better part of 2.5 years. (Robock 2000)
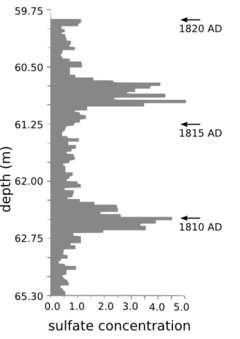
Scientists have used ice cores to monitor atmospheric gases during the cold decade (1810–1819), and the results have been puzzling. The sulfate concentrations found in both Siple Station, Antarctica and central Greenland bounced from 5.0 in January 1816 to 1.1 in August 1818.[19] This means that 25–30 teragrams of sulfur were ejected into the atmosphere, most of which came from Tambora, followed by a rapid decrease through natural processes. Tambora caused the largest shift in sulfur concentrations in ice cores for the past 5,000 years. Estimates of the sulfur yield vary from 10 teragrams (Black et al. 2012) to 120 teragrams (Stothers 2000), with the average of the estimates being 25–30 teragrams. The high concentrations of sulfur could have caused a four-year stratospheric warming of around 15 °C (27 °F), resulting in a delayed cooling of surface temperatures that lasted for nine years. (Cole-Dai et al. 2009) This has been dubbed a "volcanic winter", similar to a nuclear winter because of the overall decrease in temperatures and abysmal farming conditions.[1]
Climate data have shown that the variance between daily lows and highs may have played a role in the lower average temperature because the fluctuations were much more subdued. Generally, the mornings were warmer because of nightly cloud cover and the evenings were cooler because the clouds had dissipated. There were documented fluctuations of cloud cover for various locations that suggested it was a nightly occurrence and the sun killed them off, much like a fog.[1] The class boundaries between 1810–1830 without volcanically perturbed years was around 7.9 °C (14.2 °F). In contrast, the volcanically perturbed years (1815–1817) had a change of only around 2.3 °C (4.1 °F). This meant that the mean annual cycle in 1816 was more linear than bell shaped and 1817 endured cooling across the board. Southeastern England, northern France, and the Netherlands experienced the greatest amount of cooling in Europe, accompanied by New York, New Hampshire, Delaware, and Rhode Island in North America. (Bodenmann et al. 2011)
The documented rainfall was as much as 80 percent more than the calculated normal with regards to 1816, with unusually high amounts of snow in Switzerland, France, Germany, and Poland. This is again contrasted by the unusually low precipitations in 1818, which caused droughts throughout most of Europe and Asia. (Auchmann et al. 2012) Russia had already experienced unseasonably warm and dry summers since 1815 and this continued for the next three years. There are also documented reductions in ocean temperature near the Baltic Sea, the North Sea, and the Mediterranean Sea. This seems to have been an indicator of shifted oceanic circulation patterns and possibly changed wind direction and speed. (Meronen et al. 2012) This is further supported by the a British fleet sent to explore the Arctic Circle. They found large ice sheets miles off the coast of Greenland, where two years prior they had been limited to the near-shore waters of eastern Greenland. Contemporary scientists have attributed the "Year Without a Summer" to the drifting polar ice sheets rather than the eruption of Tambora because of their proximity to England.[1]
Taking into account the Dalton Minimum and the presence of famine and droughts predating the eruption, the Tambora eruption accelerated or exacerbated the extreme climate conditions of 1815. While other eruptions and other climatological events would have led to a global cooling of about 0.2 °C (0.4 °F), Tambora increased that number substantially.[19]
Comparison of selected volcanic eruptions
| Eruptions | Country | Location | Year | Column height (km) | Volcanic Explosivity Index | N. Hemisphere summer anomaly (°C) | Fatalities |
|---|---|---|---|---|---|---|---|
| Mount Vesuvius | Italy | Mediterranean Sea | 79 | 30 | 5 | ? | >2,000 |
| Hatepe (Taupo) | New Zealand | Ring of Fire | 126 | 37 | 7 | ? | ? |
| Baekdu | China / North Korea | Ring of Fire | 969 | 36 | 6–7 | ? | ? |
| 1257 Samalas eruption | Indonesia | Ring of Fire | 1257 | 40 | 7 | −2.0 | ? |
| Huaynaputina | Peru | Ring of Fire | 1600 | 46 | 6 | −0.8 | ≈1,400 |
| Tambora | Dutch East-Indies | Ring of Fire | 1815 | 43 | 7 | −0.5 | >71,000 |
| Krakatoa | Dutch East-Indies | Ring of Fire | 1883 | 36 | 6 | −0.3 | 36,600 |
| Santa María | Guatemala | Ring of Fire | 1902 | 34 | 6 | no anomaly | 7,000–13,000 |
| Novarupta | USA, Alaska | Ring of Fire | 1912 | 32 | 6 | −0.4 | 2 |
| Mount St Helens | USA, Washington | Ring of Fire | 1980 | 19 | 5 | no anomaly | 57 |
| El Chichón | Mexico | Ring of Fire | 1982 | 32 | 4–5 | >2,000 | |
| Nevado del Ruiz | Colombia | Ring of Fire | 1985 | 27 | 3 | no anomaly | 23,000 |
| Mount Pinatubo | Philippines | Ring of Fire | 1991 | 49 | 6 | −0.5 | 1,202 |
Source: Oppenheimer (2003),[1] and Smithsonian Global Volcanism Program for VEI.[21]
See also
References
![]()
- 1 2 3 4 5 6 7 8 9 10 11 12 13 14 15 16 Clive Oppenheimer (2003). "Climatic, environmental and human consequences of the largest known historic eruption: Tambora volcano (Indonesia) 1815". Progress in Physical Geography. 27 (2): 230–259. doi:10.1191/0309133303pp379ra.
- ↑ Earth Observatory
- ↑ "Tambora Volcano, Indonesia". United States Geological Survey. 3 June 2002. Archived from the original on 2 June 2010. Retrieved 8 September 2010.
- ↑ Climate Forcing
- 1 2 J. Foden (1986). "The petrology of Tambora volcano, Indonesia: A model for the 1815 eruption". Journal of Volcanology and Geothermal Research. 27 (1–2): 1–41. Bibcode:1986JVGR...27....1F. doi:10.1016/0377-0273(86)90079-X.
- 1 2 3 4 5 6 7 8 9 10 11 12 13 Richard B. Stothers (1984). "The Great Tambora Eruption in 1815 and Its Aftermath". Science. 224 (4654): 1191–1198. Bibcode:1984Sci...224.1191S. doi:10.1126/science.224.4654.1191. PMID 17819476.
- 1 2 3 4 5 6 Raffles, Sophia (1830). Memoir of the life and public services of Sir Thomas Stamford Raffles, F.R.S. &c., particularly in the government of Java 1811–1816, and of Bencoolen and its dependencies 1817–1824: with details of the commerce and resources of the eastern archipelago, and selections from his correspondence. London, England: John Murray. , cited by Oppenheimer (2003).
- 1 2 Briffa, K. R.; Jones, P. D.; Schweingruber, F. H.; Osborn, T. J. (1998). "Influence of volcanic eruptions on Northern Hemisphere summer temperature over 600 years". Nature. 393 (6684): 450–455. Bibcode:1998Natur.393..450B. doi:10.1038/30943.
- ↑ Richard B. Stothers (2004). "Density of fallen ash after the eruption of Tambora in 1815". Journal of Volcanology and Geothermal Research. 134 (4): 343–345. Bibcode:2004JVGR..134..343S. doi:10.1016/j.jvolgeores.2004.03.010.
- ↑ Monk, K. A.; Fretes, Y.; Reksodiharjo-Lilley, G. (1996). The Ecology of Nusa Tenggara and Maluku. Hong Kong: Periplus Editions Ltd. p. 60. ISBN 962-593-076-0.
- ↑ (Anon.) (August 1816). "Volcanic phenomenon". The Asiatic Journal. 2: 161.
- ↑ "Lest we forget (USGS account of historical volcanic induced tsunamis)". Volcano Watch. Archived from the original on 26 January 2012. Retrieved 26 April 2012.
- ↑ Zollinger (1855): Besteigung des Vulkans Tamboro auf der Insel Sumbawa und Schilderung der Eruption desselben im Jahre 1815, Winterthur: Zurcher and Fürber, Wurster and Co., cited by Oppenheimer (2003).
- ↑ Petroeschevsky (1949): A contribution to the knowledge of the Gunung Tambora (Sumbawa). Tijdschrift van het K. Nederlandsch Aardrijkskundig Genootschap, Amsterdam Series 2 66, 688–703, cited by Oppenheimer (2003).
- 1 2 Tanguy, J. C.; Scarth, A.; Ribière, C.; Tjetjep, W. S. (1998). "Victims from volcanic eruptions: a revised database". Bulletin of Volcanology. 60 (2): 137–144. Bibcode:1998BVol...60..137T. doi:10.1007/s004450050222.
- ↑ Anthony Reid, 'Lessons of Tambora ignored, 200 years on', 25 April 2015, East Asia Forum, Australian National University, accessed 27 April 2015.
- 1 2 Alan Robock. "Volcanic eruptions and climate" (PDF). Retrieved 11 March 2016.
- ↑ "Extreme climate, not extreme weather: the summer of 1816 in Geneva, Switzerland". Retrieved 11 March 2016.
- 1 2 3 4 Dai, Jihong; Mosley-Thompson, Ellen; Thompson, Lonnie G. (1991). "Ice core evidence for an explosive tropical volcanic eruption six years preceding Tambora". Journal of Geophysical Research: Atmospheres. 96: 17, 361–17, 366. Bibcode:1991JGR....9617361D. doi:10.1029/91jd01634.
- ↑ Peterson, Doug LAS News (Spring 2010) University of Illinois at Urbana-Champaign p. 11.
- ↑ "Large Holocene Eruptions". Global Volcanism Program. Smithsonian Institution. Retrieved 7 November 2006.