South African National Census of 1996
| 1996 National Census | |
|---|---|
|
| |
| General information | |
| Country | Republic of South Africa |
| Date taken | 9 October 1996 |
| Total population | 40,583,573 |
| Percent change |
|
| Most populous region | KwaZulu-Natal |
| Least populous region | Northern Cape |
The National Census of 1996 was the 1st comprehensive national census of the Republic of South Africa, after the fall of apartheid. It undertook to enumerate every person present in South Africa on the census night at a cost of R419,000,000.[1]
Pre-enumeration
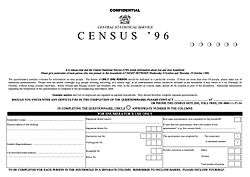
Personal questionnaire
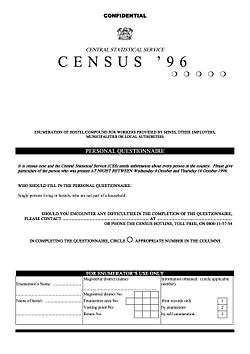
Institution questionnaire
Results
Demographics
| Rank | Race | 1991 Census | 1996 Census | Difference | Percent difference |
|---|---|---|---|---|---|
| 1 | Black African | 21,646,000 | 31,127,631 | ||
| 2 | White | 5,068,000 | 4,434,697 | ||
| 3 | Coloured | 3,286,000 | 3,600,446 | ||
| 4 | Asian or Indian | 987,000 | 1,045,596 | ||
| Total population | 30,987,000 | 40,583,573 | |||
| Rank | First language | 1991 Census | 1996 Census | Difference | Percent Difference |
|---|---|---|---|---|---|
| 1 | IsiZulu | 9,200,144 | % | ||
| 2 | IsiXhosa | 7,196,118 | % | ||
| 3 | Afrikaans | 5,811,547 | % | ||
| 4 | Sepedi | 3,695,846 | % | ||
| 5 | Setswana | 3,301,774 | % | ||
| 6 | English | 3,457,467 | % | ||
| 7 | Sesotho | 3,104,197 | % | ||
| 8 | Xitsonga | 1,756,105 | % | ||
| 9 | SiSwati | 1,013,193 | % | ||
| 10 | Tshivenda | 876,409 | % | ||
| 11 | IsiNdebele | 586,961 | % | ||
| 12 | Other | 228,275 | % |
| Rank | Gender | 1991 Census | 1996 Census | Difference | Percent difference |
|---|---|---|---|---|---|
| 1 | Female | 15,507,000 | 21,062,685 | ||
| 2 | Male | 15,480,000 | 19,520,887 |
| Rank | Province | 1991 Census | 1996 Census | Difference | Percent difference |
|---|---|---|---|---|---|
| 1 | KwaZulu-Natal | 8,417,021 | % | ||
| 2 | Gauteng | 7,348,423 | % | ||
| 3 | Eastern Cape | 6,302,525 | % | ||
| 4 | Limpopo | 4,929,368 | % | ||
| 5 | Western Cape | 3,956,875 | % | ||
| 6 | North West | 3,354,825 | % | ||
| 7 | Mpumalanga | 2,800,711 | % | ||
| 8 | Free State | 2,633,504 | % | ||
| 9 | Northern Cape | 840,321 | % | ||
| Total population | 40,583,573 | % | |||
See also
- Official 1996 Census Website
- Census in South Africa
- South African National Census of 2001
- Demographics of South Africa
References
- ↑ Using the 2001 Census: Approaches to analysing data (PDF). Statistics South Africa and the Human Sciences Research Council. 2007. ISBN 978-0-621-37259-5. Retrieved 24 November 2015.
- ↑ Primary tables South Africa: Census '96 and 2001 compared (PDF). Statistics South Africa. 2004. pp. 4–5. ISBN 0-621-34320-X. Retrieved 24 November 2015.
- ↑ Primary tables South Africa: Census '96 and 2001 compared (PDF). Statistics South Africa. 2004. pp. 9–12. ISBN 0-621-34320-X. Retrieved 24 November 2015.
- ↑ Primary tables South Africa: Census '96 and 2001 compared (PDF). Statistics South Africa. 2004. pp. 20–23. ISBN 0-621-34320-X. Retrieved 24 November 2015.
- ↑ Primary tables South Africa: Census '96 and 2001 compared (PDF). Statistics South Africa. 2004. pp. 4–5. ISBN 0-621-34320-X. Retrieved 24 November 2015.
This article is issued from
Wikipedia.
The text is licensed under Creative Commons - Attribution - Sharealike.
Additional terms may apply for the media files.