Sheffield City Council election, 2007
|
| |||||||||||||||||||||||||||||
| |||||||||||||||||||||||||||||
One third of seats (28 of 84) to Sheffield City Council 43 seats needed for a majority | |||||||||||||||||||||||||||||
|---|---|---|---|---|---|---|---|---|---|---|---|---|---|---|---|---|---|---|---|---|---|---|---|---|---|---|---|---|---|
| |||||||||||||||||||||||||||||
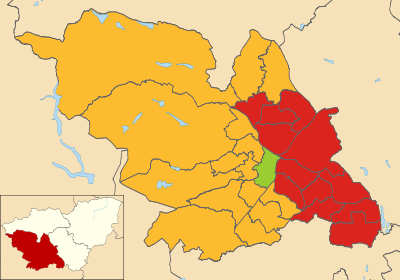 Map showing the results of the 2007 Sheffield City Council elections. | |||||||||||||||||||||||||||||
| |||||||||||||||||||||||||||||
Sheffield City Council elections took place on Thursday 3 May 2007 with one third of council seats up for election; one in each ward. Since the previous election, Liberal Democrat Martin Davis (representing Stocksbridge & Upper Don) defected, sitting as an independent.
The election seen several gains for the Liberal Democrats, returning the council to no overall control. Overall turnout was 36.0%, up slightly from last year's 34.5%.[1]
Councillors before and after the election
| Ward | Incumbent Elected | Incumbent | Re-elected |
|---|---|---|---|
| Arbourthorne | 2004 | John Robson | John Robson |
| Beauchief & Greenhill | 2004 | Simon Clement-Jones | Simon Clement-Jones |
| Beighton | 2004 | Christopher Rosling-Josephs | Christopher Rosling-Josephs |
| Birley | 2005 (by-election) | Denise Fox | Denise Fox |
| Broomhill | 2004 | Alan Whitehouse | Alan Whitehouse |
| Burngreave | 2004 | Ibrar Hussain | Ibrar Hussain |
| Central | 2004 | Jillian Creasy | Jillian Creasy |
| Crookes | 2004 | John Hesketh | John Hesketh |
| Darnall | 2004 | Harry Harpham | Harry Harpham |
| Dore and Totley | 2004 | Michael Waters | Michael Davis |
| East Ecclesfield | 2004 | Victoria Bowden | Victoria Bowden |
| Ecclesall | 2006 (two vacancies) | Michael Reynolds | Michael Reynolds |
| Firth Park | 2004 | Christopher Weldon | Christopher Weldon |
| Fulwood | 2004 | Andrew Sangar | Andrew Sangar |
| Gleadless Valley | 2004 | Rosemary Telfer | Denise Reaney |
| Graves Park | 2004 | Ian Auckland | Ian Auckland |
| Hillsborough | 2004 | Alfred Meade | Stephen Ayris |
| Manor Castle | 2004 | Janet Fiore | Jenny Armstrong |
| Mosborough | 2004 | David Barker | David Barker |
| Nether Edge | Vacancy | Colin France | |
| Richmond | 2004 | John Campbell | John Campbell |
| Shiregreen and Brightside | 2004 | Peter Price | Peter Price |
| Southey | 2004 | Leigh Bramall | Leigh Bramall |
| Stannington | 2004 | Vickie Priestley | Vickie Priestley |
| Stocksbridge and Upper Don | 2004 | Martin Brelsford | Martin Brelsford |
| Walkley | 2004 | Veronica Hardstaff | Penny Baker |
| West Ecclesfield | 2004 | Alan Hooper | Alan Hooper |
| Woodhouse | 2004 | Michael Rooney | Michael Rooney |
Election result
| Party | Seats | Gains | Losses | Net gain/loss | Seats % | Votes % | Votes | +/− | |
|---|---|---|---|---|---|---|---|---|---|
| Liberal Democrat | 15 | 4 | 0 | +4 | 53.6 | 33.9 | 45,449 | -0.1% | |
| Labour | 12 | 0 | 3 | -3 | 42.8 | 34.8 | 46,643 | +1.1% | |
| Green | 1 | 0 | 0 | 0 | 3.6 | 9.6 | 12,836 | -1.3% | |
| Conservative | 0 | 0 | 1 | -1 | 0.0 | 14.5 | 19,391 | -0.5% | |
| BNP | 0 | 0 | 0 | 0 | 0.0 | 3.3 | 4,474 | +1.0% | |
| Respect | 0 | 0 | 0 | 0 | 0.0 | 1.9 | 2,488 | +0.9% | |
| UKIP | 0 | 0 | 0 | 0 | 0.0 | 1.8 | 2,446 | -0.5% | |
| Independent Labour | 0 | 0 | 0 | 0 | 0.0 | 0.2 | 234 | +0.2% | |
| Socialist Alternative | 0 | 0 | 0 | 0 | 0.0 | 0.1 | 194 | -0.1% | |
This result has the following consequences for the total number of seats on the Council after the elections:
| Party | Previous council | New council | |||
|---|---|---|---|---|---|
| Labour | 44 | 41 | |||
| Liberal Democrats | 35 | 39 | |||
| Green | 2 | 2 | |||
| Conservatives | 2 | 1 | |||
| Independent Liberal Democrat | 1 | 1 | |||
| BNP | 0 | 0 | |||
| Respect | 0 | 0 | |||
| UKIP | 0 | 0 | |||
| Independent Labour | 0 | 0 | |||
| Socialist Alternative | 0 | 0 | |||
| Total | 84 | 84 | |||
| Working majority | 4 | 0 | |||
Ward results
| Party | Candidate | Votes | % | ± | |
|---|---|---|---|---|---|
| Labour | John Robson | 2,099 | 55.8 | +6.3 | |
| Liberal Democrat | Tony Bennett | 830 | 22.1 | -3.3 | |
| Conservative | Peter Smith | 527 | 14.0 | +0.8 | |
| Green | Krystyna Haywood | 304 | 8.1 | -3.0 | |
| Majority | 1,269 | 33.8 | +9.9 | ||
| Turnout | 3,760 | 29.6 | +1.4 | ||
| Labour hold | Swing | +4.8 | |||
| Party | Candidate | Votes | % | ± | |
|---|---|---|---|---|---|
| Liberal Democrat | Simon Clement-Jones | 2,072 | 38.3 | -0.4 | |
| Labour | Neil Cleeveley | 1,709 | 31.6 | -2.0 | |
| Conservative | Michelle Grant | 812 | 15.0 | +3.6 | |
| BNP | John Beatson | 508 | 9.4 | -0.9 | |
| Green | David Hayes | 304 | 5.6 | -0.3 | |
| Majority | 363 | 6.7 | +1.6 | ||
| Turnout | 5,405 | 39.5 | +1.8 | ||
| Liberal Democrat hold | Swing | +0.8 | |||
| Party | Candidate | Votes | % | ± | |
|---|---|---|---|---|---|
| Labour | Chris Rosling-Josephs | 2,018 | 48.9 | +6.2 | |
| Conservative | Shirley Clayton | 1,068 | 25.9 | +6.7 | |
| Liberal Democrat | Tracey Williams | 695 | 16.8 | +2.3 | |
| Green | Julian Brandram | 384 | 9.3 | +2.7 | |
| Majority | 950 | 23.0 | -0.5 | ||
| Turnout | 4,131 | 31.5 | +1.3 | ||
| Labour hold | Swing | -0.2 | |||
| Party | Candidate | Votes | % | ± | |
|---|---|---|---|---|---|
| Labour | Denise Fox | 2,352 | 53.6 | +4.0 | |
| Liberal Democrat | Ben Curran | 715 | 16.3 | -2.5 | |
| Conservative | Gordon Millward | 669 | 15.2 | +1.9 | |
| Green | Frank Plunkett | 375 | 8.5 | 0.0 | |
| UKIP | Jenny Ruchat | 279 | 6.4 | -3.3 | |
| Majority | 1,637 | 37.3 | +6.5 | ||
| Turnout | 4,390 | 34.3 | +2.7 | ||
| Labour hold | Swing | +3.2 | |||
| Party | Candidate | Votes | % | ± | |
|---|---|---|---|---|---|
| Liberal Democrat | Alan Whitehouse | 1,390 | 45.4 | +3.8 | |
| Green | Rob Cole | 832 | 27.2 | +2.7 | |
| Labour | Colin Roth | 516 | 16.8 | -2.7 | |
| Conservative | Michael Ginn | 326 | 10.6 | -3.7 | |
| Majority | 558 | 18.2 | +1.1 | ||
| Turnout | 3,064 | 26.1 | +0.7 | ||
| Liberal Democrat hold | Swing | +0.5 | |||
| Party | Candidate | Votes | % | ± | |
|---|---|---|---|---|---|
| Labour | Ibrar Hussein | 2,774 | 51.6 | +2.7 | |
| Respect | Maxine Bowler | 1,290 | 24.0 | -1.9 | |
| Conservative | Russell Cutts | 518 | 9.6 | +0.5 | |
| Green | Chris Sissons | 438 | 8.2 | -0.4 | |
| Liberal Democrat | Mohamed Hersi | 351 | 6.5 | -1.0 | |
| Majority | 1,484 | 27.6 | +4.6 | ||
| Turnout | 5,371 | 36.7 | +2.8 | ||
| Labour hold | Swing | +2.3 | |||
| Party | Candidate | Votes | % | ± | |
|---|---|---|---|---|---|
| Green | Jillian Creasy | 1,451 | 35.6 | +3.0 | |
| Labour | Mohammed Maroof | 1,264 | 31.0 | -0.5 | |
| Liberal Democrat | Mohammed Azim | 928 | 22.8 | -6.4 | |
| Conservative | June Ledbury | 276 | 6.8 | +0.1 | |
| Respect | Anwar Ali | 157 | 3.9 | +3.9 | |
| Majority | 187 | 4.6 | +3.4 | ||
| Turnout | 4,076 | 31.0 | +0.6 | ||
| Green hold | Swing | +1.7 | |||
| Party | Candidate | Votes | % | ± | |
|---|---|---|---|---|---|
| Liberal Democrat | John Hesketh | 2,856 | 53.8 | +5.2 | |
| Conservative | Robert McIleven | 917 | 17.3 | -1.2 | |
| Labour | Felicity Matthews | 874 | 16.5 | +0.3 | |
| Green | Gemma Lock | 657 | 12.4 | -2.0 | |
| Majority | 1,939 | 36.6 | +6.5 | ||
| Turnout | 5,304 | 39.0 | +0.7 | ||
| Liberal Democrat hold | Swing | +3.2 | |||
| Party | Candidate | Votes | % | ± | |
|---|---|---|---|---|---|
| Labour | Harry Harpham | 2,152 | 45.2 | -9.6 | |
| Respect | Miron Rahman | 1,041 | 21.9 | +21.9 | |
| Liberal Democrat | Frank Taylor | 532 | 11.2 | -5.9 | |
| Conservative | Anne Corke | 407 | 8.6 | -0.4 | |
| UKIP | Charlotte Arnott | 370 | 7.8 | -3.5 | |
| Green | Julie White | 256 | 5.4 | -2.4 | |
| Majority | 1,111 | 23.4 | -14.2 | ||
| Turnout | 4,758 | 34.2 | +2.8 | ||
| Labour hold | Swing | -15.7 | |||
| Party | Candidate | Votes | % | ± | |
|---|---|---|---|---|---|
| Liberal Democrat | Mike Davis | 3,660 | 52.2 | -0.6 | |
| Conservative | Caroline Cooper | 2,488 | 35.5 | -1.2 | |
| Labour | Albert Smith | 419 | 6.0 | +1.8 | |
| Green | Dawn Biram | 278 | 4.0 | +0.2 | |
| UKIP | Jim Laurie | 173 | 2.5 | +0.1 | |
| Majority | 7,018 | 16.7 | +0.6 | ||
| Turnout | 1,172 | 53.1 | -1.2 | ||
| Liberal Democrat gain from Conservative | Swing | +0.3 | |||
| Party | Candidate | Votes | % | ± | |
|---|---|---|---|---|---|
| Liberal Democrat | Victoria Bowden | 1,563 | 37.1 | -9.0 | |
| Labour | Angela Wetherall | 1,489 | 35.4 | 0.0 | |
| BNP | Matthew Baxter | 553 | 13.1 | +13.1 | |
| Conservative | George Needham | 389 | 9.2 | -0.8 | |
| Green | Jennyfer Barnard | 215 | 5.1 | -3.4 | |
| Majority | 74 | 1.8 | -8.9 | ||
| Turnout | 4,209 | 29.9 | -2.4 | ||
| Liberal Democrat hold | Swing | -4.5 | |||
| Party | Candidate | Votes | % | ± | |
|---|---|---|---|---|---|
| Liberal Democrat | Mike Reynolds | 3,496 | 53.5 | +0.4 | |
| Conservative | Michael Young | 1,673 | 25.6 | +0.3 | |
| Green | Arun Mathur | 720 | 11.0 | +0.3 | |
| Labour | David Walton | 649 | 9.9 | +1.5 | |
| Majority | 1,823 | 27.9 | +0.1 | ||
| Turnout | 6,538 | 45.5 | -0.3 | ||
| Liberal Democrat hold | Swing | +0.0 | |||
| Party | Candidate | Votes | % | ± | |
|---|---|---|---|---|---|
| Labour | Chris Weldon | 2,067 | 53.5 | -1.5 | |
| BNP | Mike Smith | 660 | 17.1 | +17.1 | |
| Liberal Democrat | John Tomlinson | 459 | 11.9 | -7.1 | |
| Conservative | Paul Rymill | 397 | 10.3 | -2.7 | |
| Green | Jonathon Cook | 283 | 7.3 | -5.8 | |
| Majority | 1,407 | 36.4 | +0.4 | ||
| Turnout | 3,866 | 30.0 | +3.2 | ||
| Labour hold | Swing | -9.3 | |||
| Party | Candidate | Votes | % | ± | |
|---|---|---|---|---|---|
| Liberal Democrat | Andy Sangar | 3,155 | 56.1 | +8.9 | |
| Conservative | Ian Pritchard | 1,546 | 27.5 | -6.3 | |
| Labour | Jack Scott | 411 | 7.3 | -0.8 | |
| Green | Stephen Hitchens | 404 | 7.2 | -1.2 | |
| UKIP | Maurice Patterson | 107 | 1.9 | -0.6 | |
| Majority | 1,609 | 28.6 | +15.2 | ||
| Turnout | 5,623 | 46.2 | +4.2 | ||
| Liberal Democrat hold | Swing | +7.6 | |||
| Party | Candidate | Votes | % | ± | |
|---|---|---|---|---|---|
| Liberal Democrat | Denise Reaney | 2,114 | 39.0 | +3.7 | |
| Labour | Rosemary Telfer | 2,063 | 38.1 | +1.8 | |
| Green | Rob Unwin | 856 | 15.8 | -5.2 | |
| Conservative | Amy Taylor | 381 | 7.0 | -0.4 | |
| Majority | 51 | 0.9 | -0.1 | ||
| Turnout | 5,414 | 39.8 | +4.7 | ||
| Liberal Democrat gain from Labour | Swing | +0.9 | |||
| Party | Candidate | Votes | % | ± | |
|---|---|---|---|---|---|
| Liberal Democrat | Ian Auckland | 2,321 | 43.7 | +5.6 | |
| Labour | Bob Pemberton | 1,384 | 26.1 | -1.3 | |
| Conservative | Trevor Grant | 784 | 14.8 | -0.5 | |
| Green | Robert Murphy | 424 | 8.0 | -1.8 | |
| UKIP | Pauline Arnott | 204 | 3.8 | -1.6 | |
| Socialist Alternative | Celvin Payne | 194 | 3.7 | -0.4 | |
| Majority | 937 | 17.6 | +6.8 | ||
| Turnout | 5,311 | 40.2 | +1.0 | ||
| Liberal Democrat hold | Swing | -3.4 | |||
| Party | Candidate | Votes | % | ± | |
|---|---|---|---|---|---|
| Liberal Democrat | Steve Ayris | 2,425 | 44.4 | +7.8 | |
| Labour | Alf Meade | 1,934 | 35.4 | -6.0 | |
| BNP | John Sheldon | 475 | 8.7 | +8.7 | |
| Green | Chris McMahon | 354 | 6.5 | -6.0 | |
| Conservative | Peter Smith | 271 | 5.0 | -4.5 | |
| Majority | 491 | 9.0 | +4.3 | ||
| Turnout | 5,459 | 41.2 | +6.4 | ||
| Liberal Democrat gain from Labour | Swing | +6.9 | |||
| Party | Candidate | Votes | % | ± | |
|---|---|---|---|---|---|
| Labour | Jenny Armstrong | 1,932 | 60.6 | +2.4 | |
| Liberal Democrat | Dave Croft | 542 | 17.0 | +3.8 | |
| Green | Graham Wroe | 399 | 12.5 | -4.7 | |
| Conservative | Christina Stark | 314 | 9.9 | -1.6 | |
| Majority | 1,390 | 43.6 | +2.6 | ||
| Turnout | 3,187 | 27.7 | +3.8 | ||
| Labour hold | Swing | -0.7 | |||
| Party | Candidate | Votes | % | ± | |
|---|---|---|---|---|---|
| Labour | David Barker | 1,859 | 41.7 | -0.9 | |
| Liberal Democrat | Gail Smith | 1,510 | 33.8 | +5.5 | |
| Conservative | Eve Millward | 685 | 15.3 | -2.2 | |
| UKIP | Mark Suter | 248 | 5.6 | -2.1 | |
| Green | Heather Hunt | 161 | 3.6 | -2.0 | |
| Majority | 349 | 7.8 | -4.7 | ||
| Turnout | 4,463 | 33.7 | +3.1 | ||
| Labour hold | Swing | -3.2 | |||
| Party | Candidate | Votes | % | ± | |
|---|---|---|---|---|---|
| Liberal Democrat | Colin France | 2,061 | 39.0 | -1.4 | |
| Labour | Jim Lafferty | 1,626 | 30.8 | -1.7 | |
| Green | Mervyn Smith | 1,045 | 19.8 | +1.4 | |
| Conservative | Roy Ledbury | 549 | 10.4 | +1.7 | |
| Majority | 435 | 8.2 | +0.4 | ||
| Turnout | 5,281 | 39.8 | -3.2 | ||
| Liberal Democrat hold | Swing | +0.1 | |||
| Party | Candidate | Votes | % | ± | |
|---|---|---|---|---|---|
| Labour | John Campbell | 2,118 | 51.8 | +3.7 | |
| Liberal Democrat | Chris Tutt | 648 | 15.8 | -3.7 | |
| Conservative | Ian Fey | 470 | 11.5 | 0.0 | |
| UKIP | Les Arnott | 384 | 9.4 | -3.9 | |
| Green | Eamonn Ward | 236 | 5.8 | -1.8 | |
| Independent | Elsie Smith | 234 | 5.7 | +5.7 | |
| Majority | 1,470 | 35.9 | +7.2 | ||
| Turnout | 4,090 | 31.6 | +1.8 | ||
| Labour hold | Swing | +3.7 | |||
| Party | Candidate | Votes | % | ± | |
|---|---|---|---|---|---|
| Labour | Peter Price | 2,200 | 51.7 | +3.2 | |
| BNP | Chris Hartigan | 1,013 | 23.8 | -2.3 | |
| Liberal Democrat | Joe Taylor | 472 | 11.1 | 0.0 | |
| Conservative | Mohammed Tariq | 323 | 7.6 | -0.6 | |
| Green | Steve Brady | 245 | 5.8 | -0.4 | |
| Majority | 1,187 | 27.9 | +5.6 | ||
| Turnout | 4,253 | 30.7 | +2.3 | ||
| Labour hold | Swing | +2.7 | |||
| Party | Candidate | Votes | % | ± | |
|---|---|---|---|---|---|
| Labour | Leigh Bramall | 2,099 | 53.8 | +7.7 | |
| BNP | Tracey Smith | 731 | 18.7 | -0.4 | |
| Liberal Democrat | John Bowden | 537 | 13.8 | -3.0 | |
| Conservative | Eric Kirby | 357 | 9.2 | -0.9 | |
| Green | Steve Barnard | 177 | 4.5 | +0.4 | |
| Majority | 1,368 | 35.1 | +8.1 | ||
| Turnout | 3,901 | 29.3 | +2.3 | ||
| Labour hold | Swing | +4.0 | |||
| Party | Candidate | Votes | % | ± | |
|---|---|---|---|---|---|
| Liberal Democrat | Vickie Priestley | 2,792 | 49.4 | +2.5 | |
| Labour | Max Telfer | 1,446 | 25.6 | -2.1 | |
| Conservative | John Walsh | 926 | 16.4 | +0.9 | |
| Green | Martin Bradshaw | 489 | 8.7 | -1.2 | |
| Majority | 1,346 | 23.8 | +4.6 | ||
| Turnout | 5,653 | 40.4 | +2.5 | ||
| Liberal Democrat hold | Swing | +2.3 | |||
| Party | Candidate | Votes | % | ± | |
|---|---|---|---|---|---|
| Liberal Democrat | Martin Brelsford | 2,067 | 39.3 | -8.8 | |
| Labour | Phil Wood | 1,273 | 24.2 | +0.3 | |
| Conservative | Matthew Dixon | 924 | 17.6 | +1.5 | |
| BNP | David Wright | 534 | 10.2 | +10.2 | |
| Green | Angela Roberts | 463 | 8.8 | -3.2 | |
| Majority | 794 | 15.1 | -9.1 | ||
| Turnout | 5,261 | 36.5 | +4.3 | ||
| Liberal Democrat hold | Swing | -4.5 | |||
| Party | Candidate | Votes | % | ± | |
|---|---|---|---|---|---|
| Liberal Democrat | Penny Baker | 2,112 | 41.4 | +0.8 | |
| Labour | Veronica Hardstaff | 2,076 | 40.7 | +1.8 | |
| Green | Barry New | 594 | 11.6 | -2.0 | |
| Conservative | Benedict Hazel | 323 | 6.3 | -0.5 | |
| Majority | 36 | 0.7 | -1.0 | ||
| Turnout | 5,105 | 38.6 | +3.1 | ||
| Liberal Democrat gain from Labour | Swing | -0.5 | |||
| Party | Candidate | Votes | % | ± | |
|---|---|---|---|---|---|
| Liberal Democrat | Alan Hooper | 2,593 | 52.3 | +2.7 | |
| Labour | Matthew Peck | 1,533 | 30.9 | -1.5 | |
| Conservative | Paula Mayfield | 557 | 11.2 | +0.6 | |
| Green | Kathryn Aston | 275 | 5.5 | -1.8 | |
| Majority | 1,060 | 21.4 | +4.2 | ||
| Turnout | 4,958 | 35.2 | +0.5 | ||
| Liberal Democrat hold | Swing | +2.1 | |||
| Party | Candidate | Votes | % | ± | |
|---|---|---|---|---|---|
| Labour | Mick Rooney | 2,307 | 53.4 | +3.8 | |
| UKIP | Jonathan Arnott | 681 | 15.8 | +1.3 | |
| Liberal Democrat | Chris Bingham | 553 | 12.8 | -2.4 | |
| Conservative | Laurence Hayward | 514 | 11.9 | -1.9 | |
| Green | John Gant | 267 | 6.2 | -0.8 | |
| Majority | 1,626 | 37.6 | +3.2 | ||
| Turnout | 4,322 | 32.9 | +2.2 | ||
| Labour hold | Swing | +1.2 | |||
References
| Barnsley Metropolitan Borough Council | |
|---|---|
| Doncaster Metropolitan Borough Council | |
| Rotherham Metropolitan Borough Council | |
| Sheffield City Council |
|
| South Yorkshire County Council |
|
| West Riding County Council | |
| Sheffield City Region | |
| |
This article is issued from
Wikipedia.
The text is licensed under Creative Commons - Attribution - Sharealike.
Additional terms may apply for the media files.