Barnsley Metropolitan Borough Council election, 1983
|
| |||||||||||||||||
| |||||||||||||||||
One third of seats (22 of 66) to Barnsley Metropolitan Borough Council 34 seats needed for a majority | |||||||||||||||||
|---|---|---|---|---|---|---|---|---|---|---|---|---|---|---|---|---|---|
| |||||||||||||||||
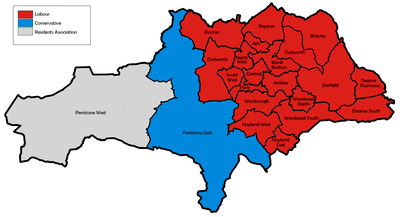 Map showing the results of the 1983 Barnsley council elections. | |||||||||||||||||
| |||||||||||||||||
Elections to Barnsley Metropolitan Borough Council were held on 5 May 1983. One third of the council was up for election. Prior to the election the defending councillor in Darton had defected to Independent Labour from Residents. The election resulted in Labour retaining control of the council.[1][2]
Election result
| Party | Seats | Gains | Losses | Net gain/loss | Seats % | Votes % | Votes | +/− | |
|---|---|---|---|---|---|---|---|---|---|
| Labour | 20 | 5 | 0 | +5 | 90.9 | 62.3 | 42,652 | +7.1 | |
| Conservative | 1 | 1 | 0 | 0 | 4.5 | 9.7 | 6,621 | +0.8 | |
| Residents | 1 | 0 | 3 | -3 | 4.5 | 5.7 | 3,907 | -0.8 | |
| SDP–Liberal Alliance | 0 | 0 | 2 | -2 | 0.0 | 18.7 | 12,835 | -8.8 | |
| Independent | 0 | 0 | 0 | 0 | 0.0 | 2.3 | 1,563 | +2.3 | |
| Independent Labour | 0 | 0 | 1 | -1 | 0.0 | 1.3 | 919 | -0.8 | |
This resulted in the following composition of the council:[1][2]
| Party | Previous council | New council | |||
|---|---|---|---|---|---|
| Labour | 53 | 58 | |||
| Conservatives | 2 | 3 | |||
| Residents | 6 | 3 | |||
| SDP–Liberal Alliance | 4 | 2 | |||
| Independent Labour | 1 | 0 | |||
| Total | 66 | 66 | |||
| Working majority | 40 | 50 | |||
Ward results
+/- figures represent changes from the last time these wards were contested.
| Party | Candidate | Votes | % | ± | |
|---|---|---|---|---|---|
| Labour | Galvin E.* | 1,603 | 76.3 | +11.4 | |
| Conservative | Dobbin J. | 499 | 23.7 | +9.3 | |
| Majority | 1,104 | 52.5 | +8.4 | ||
| Turnout | 2,102 | 27.7 | +0.7 | ||
| Labour hold | Swing | +1.0 | |||
| Party | Candidate | Votes | % | ± | |
|---|---|---|---|---|---|
| Labour | Kyte G. | 1,820 | 84.4 | +4.9 | |
| SDP–Liberal Alliance | Linstead M. Ms. | 336 | 15.6 | +2.9 | |
| Majority | 1,484 | 68.8 | +2.0 | ||
| Turnout | 2,156 | 30.0 | +5.2 | ||
| Labour hold | Swing | +1.0 | |||
| Party | Candidate | Votes | % | ± | |
|---|---|---|---|---|---|
| Labour | Baines D.* | 2,119 | 83.5 | +10.9 | |
| Conservative | Schofield D. Ms. | 420 | 16.5 | +6.5 | |
| Majority | 1,699 | 66.9 | +11.8 | ||
| Turnout | 2,539 | 34.2 | +3.8 | ||
| Labour hold | Swing | +2.2 | |||
| Party | Candidate | Votes | % | ± | |
|---|---|---|---|---|---|
| Labour | Fisher R.* | 2,109 | 59.5 | +4.4 | |
| SDP–Liberal Alliance | Taylor M. Ms. | 1,160 | 32.7 | -0.5 | |
| Conservative | Gibson L. | 273 | 7.7 | -3.9 | |
| Majority | 26.8 | +4.9 | |||
| Turnout | 3,542 | 42.5 | +3.5 | ||
| Labour hold | Swing | +2.4 | |||
| Party | Candidate | Votes | % | ± | |
|---|---|---|---|---|---|
| Labour | Salt H.* | 2,027 | 67.0 | +22.2 | |
| Residents | Dempsey F. | 999 | 33.0 | -15.0 | |
| Majority | 1,028 | 34.0 | +30.8 | ||
| Turnout | 3,026 | 38.9 | +2.9 | ||
| Labour hold | Swing | +18.6 | |||
| Party | Candidate | Votes | % | ± | |
|---|---|---|---|---|---|
| Labour | Goddard B.* | 2,290 | 77.4 | -2.5 | |
| SDP–Liberal Alliance | Smailes M. Ms. | 667 | 22.6 | +2.5 | |
| Majority | 1,623 | 54.9 | -5.0 | ||
| Turnout | 2,957 | 37.0 | +4.7 | ||
| Labour hold | Swing | -2.5 | |||
| Party | Candidate | Votes | % | ± | |
|---|---|---|---|---|---|
| Labour | Norbury W. | 1,815 | 44.8 | -1.3 | |
| SDP–Liberal Alliance | Evans J. | 1,497 | 36.9 | -2.4 | |
| Conservative | Slater A. | 469 | 11.6 | -3.0 | |
| Independent Labour | Hutchinson M.* | 273 | 6.7 | +.7 | |
| Majority | 318 | 7.8 | +1.1 | ||
| Turnout | 4,054 | 44.5 | +7.6 | ||
| Labour gain from Independent Labour | Swing | +0.5 | |||
| Party | Candidate | Votes | % | ± | |
|---|---|---|---|---|---|
| Labour | Stanley J.* | 2,381 | 78.7 | +29.8 | |
| Independent Labour | Gregory J. | 646 | 21.3 | -20.5 | |
| Majority | 1,735 | 57.3 | +50.3 | ||
| Turnout | 3,027 | 33.5 | +6.1 | ||
| Labour hold | Swing | +25.1 | |||
| Party | Candidate | Votes | % | ± | |
|---|---|---|---|---|---|
| Labour | Lowe J. | 2,247 | 86.1 | +13.5 | |
| SDP–Liberal Alliance | Gaunt W. | 363 | 13.9 | -13.5 | |
| Majority | 1,884 | 72.2 | +27.0 | ||
| Turnout | 2,610 | 30.5 | -0.2 | ||
| Labour hold | Swing | +13.5 | |||
| Party | Candidate | Votes | % | ± | |
|---|---|---|---|---|---|
| Labour | Cawthrow C. | 2,424 | 62.2 | +12.6 | |
| SDP–Liberal Alliance | Chamberlain D. | 997 | 25.6 | -5.2 | |
| Conservative | Colquhoun G. | 477 | 12.2 | +12.2 | |
| Majority | 1,427 | 36.6 | +17.8 | ||
| Turnout | 3,898 | 46.7 | +3.8 | ||
| Labour hold | Swing | +8.9 | |||
| Party | Candidate | Votes | % | ± | |
|---|---|---|---|---|---|
| Labour | Levitt L. | 1,628 | 53.6 | +12.9 | |
| SDP–Liberal Alliance | Eaden D.* | 1,408 | 46.4 | -12.9 | |
| Majority | 220 | 7.2 | -11.3 | ||
| Turnout | 3,036 | 38.1 | +2.2 | ||
| Labour gain from SDP–Liberal Alliance | Swing | +12.9 | |||
| Party | Candidate | Votes | % | ± | |
|---|---|---|---|---|---|
| Labour | Schofield A.* | 2,201 | 71.9 | +6.7 | |
| SDP–Liberal Alliance | Chantry J. | 862 | 28.1 | -6.7 | |
| Majority | 1,339 | 43.7 | +13.5 | ||
| Turnout | 3,063 | 44.5 | +5.9 | ||
| Labour hold | Swing | +6.7 | |||
| Party | Candidate | Votes | % | ± | |
|---|---|---|---|---|---|
| Labour | Barron R.* | 2,384 | 77.6 | +7.5 | |
| Conservative | White J. | 425 | 13.8 | +1.0 | |
| SDP–Liberal Alliance | Major C. | 265 | 8.6 | -8.5 | |
| Majority | 1,959 | 63.7 | +10.8 | ||
| Turnout | 3,074 | 34.2 | +3.3 | ||
| Labour hold | Swing | +3.2 | |||
| Party | Candidate | Votes | % | ± | |
|---|---|---|---|---|---|
| Labour | Hadfield P. | 1,783 | 55.9 | +7.5 | |
| Residents | Harris J.* | 587 | 18.4 | +6.8 | |
| Conservative | Jubb M. | 497 | 15.6 | +1.1 | |
| SDP–Liberal Alliance | Appleyard J. Ms. | 325 | 10.2 | -15.5 | |
| Majority | 1,196 | 37.5 | +14.8 | ||
| Turnout | 3,192 | 41.1 | +0.8 | ||
| Labour gain from Residents | Swing | +0.3 | |||
| Party | Candidate | Votes | % | ± | |
|---|---|---|---|---|---|
| Labour | Lunn F.* | 1,963 | 73.4 | +6.2 | |
| Conservative | Sykes P. | 444 | 16.6 | +4.1 | |
| SDP–Liberal Alliance | Smailes J. | 268 | 10.0 | -10.4 | |
| Majority | 1,519 | 56.8 | +10.0 | ||
| Turnout | 2,675 | 44.4 | +6.9 | ||
| Labour hold | Swing | +1.0 | |||
| Party | Candidate | Votes | % | ± | |
|---|---|---|---|---|---|
| Conservative | Wade J. | 1,506 | 44.6 | +13.5 | |
| Labour | Hunter D. | 1,215 | 36.0 | +6.4 | |
| SDP–Liberal Alliance | Hanstock O. | 656 | 19.4 | -12.8 | |
| Majority | 291 | 8.6 | +7.5 | ||
| Turnout | 3,377 | 50.1 | +6.0 | ||
| Conservative gain from SDP–Liberal Alliance | Swing | +3.5 | |||
| Party | Candidate | Votes | % | ± | |
|---|---|---|---|---|---|
| Residents | Harrison M. Ms.* | 2,001 | 50.3 | +22.6 | |
| Labour | Collett N. Ms. | 838 | 21.1 | +1.5 | |
| Conservative | Mitchell K. Ms. | 779 | 19.6 | -15.2 | |
| SDP–Liberal Alliance | Hallam D. | 360 | 9.0 | -8.9 | |
| Majority | 1,163 | 29.2 | +22.1 | ||
| Turnout | 3,978 | 49.9 | +8.4 | ||
| Residents hold | Swing | +10.5 | |||
| Party | Candidate | Votes | % | ± | |
|---|---|---|---|---|---|
| Labour | Lavender H. | 2,118 | 77.4 | +6.6 | |
| SDP–Liberal Alliance | Wilson N. | 618 | 22.6 | -0.3 | |
| Majority | 1,500 | 54.8 | +6.9 | ||
| Turnout | 2,736 | 32.9 | -6.2 | ||
| Labour hold | Swing | +3.4 | |||
| Party | Candidate | Votes | % | ± | |
|---|---|---|---|---|---|
| Labour | Hall M. | 1,707 | 43.1 | +4.9 | |
| SDP–Liberal Alliance | Bickley K. Ms. | 1,554 | 39.3 | +3.5 | |
| Conservative | England G. | 377 | 9.5 | -2.2 | |
| Residents | Addison M. Ms.* | 320 | 8.1 | -6.2 | |
| Majority | 153 | 3.9 | +1.5 | ||
| Turnout | 3,958 | 52.2 | +10.9 | ||
| Labour gain from Residents | Swing | +0.7 | |||
| Party | Candidate | Votes | % | ± | |
|---|---|---|---|---|---|
| Labour | Wraith R.* | 1,474 | 68.2 | +15.6 | |
| SDP–Liberal Alliance | Calton W. | 687 | 31.8 | -15.6 | |
| Majority | 787 | 36.4 | +31.2 | ||
| Turnout | 2,161 | 39.5 | +8.4 | ||
| Labour hold | Swing | +15.6 | |||
| Party | Candidate | Votes | % | ± | |
|---|---|---|---|---|---|
| Labour | Wake J.* | 1,820 | 50.3 | -13.0 | |
| Independent | Mahatme S. | 1,563 | 43.2 | +43.2 | |
| SDP–Liberal Alliance | Young S. Ms. | 236 | 6.5 | -30.2 | |
| Majority | 257 | 7.1 | -19.4 | ||
| Turnout | 3,619 | 45.3 | +12.5 | ||
| Labour hold | Swing | -28.1 | |||
| Party | Candidate | Votes | % | ± | |
|---|---|---|---|---|---|
| Labour | Ingram W. | 2,686 | 72.3 | +9.7 | |
| SDP–Liberal Alliance | Price A. Ms. | 576 | 15.5 | -12.5 | |
| Conservative | Pappworth R. | 455 | 12.2 | +2.8 | |
| Majority | 2,110 | 56.8 | +22.3 | ||
| Turnout | 3,717 | 44.5 | -1.4 | ||
| Labour gain from Residents | Swing | +11.1 | |||
References
- 1 2 3 4 5 6 7 8 9 10 11 12 13 14 15 16 17 18 19 20 21 22 23 24 25 "Elections Centre: Barnsley 1973-2012" (PDF). electionscentre.co.uk/plymouth.ac.uk. Archived from the original (PDF) on 2017-07-25. Retrieved 2017-07-25.
- 1 2 3 4 5 6 7 8 9 10 11 12 13 14 15 16 17 18 19 20 21 22 23 24 25 "Election results 1979 to 2003" (PDF). barnsley.gov.uk. Archived from the original (PDF) on 2017-07-28. Retrieved 2017-07-28.
| Barnsley Metropolitan Borough Council | |
|---|---|
| Doncaster Metropolitan Borough Council | |
| Rotherham Metropolitan Borough Council | |
| Sheffield City Council |
|
| South Yorkshire County Council |
|
| West Riding County Council | |
| Sheffield City Region | |
| |
| Metropolitan boroughs |
|
|---|---|
| District councils (England) |
|
| District councils (Wales) |
|
| |
This article is issued from
Wikipedia.
The text is licensed under Creative Commons - Attribution - Sharealike.
Additional terms may apply for the media files.