Barnsley Metropolitan Borough Council election, 1982
|
| |||||||||||||||||
| |||||||||||||||||
One third of seats (23 of 66) to Barnsley Metropolitan Borough Council 34 seats needed for a majority | |||||||||||||||||
|---|---|---|---|---|---|---|---|---|---|---|---|---|---|---|---|---|---|
| |||||||||||||||||
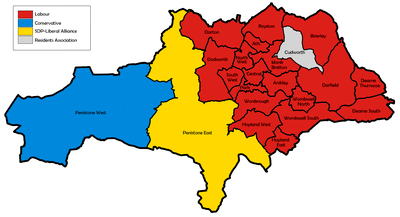 Map showing the results of the 1982 Barnsley council elections. | |||||||||||||||||
| |||||||||||||||||
Elections to Barnsley Metropolitan Borough Council were held on 6 May 1982, with one third of the council up for election with an additional vacancy in Royston. Prior to the election, Labour had gained a seat from Residents in a Dodsworth by-election, with another Residents councillor in Wombwell North defecting to the Labour grouping, offsetting a by-election loss in Penistone East to the recently formed SDP-Liberal Alliance. Alliance had also seen defections to them from the Independent Labour councillor in Hoyland East and the defending (formerly Residents) councillor in Darton.[1][2]
Election result
| Party | Seats | Gains | Losses | Net gain/loss | Seats % | Votes % | Votes | +/− | |
|---|---|---|---|---|---|---|---|---|---|
| Labour | 19 | 6 | 0 | +6 | 82.6 | 55.2 | 33,610 | -3.8 | |
| SDP–Liberal Alliance | 2 | 1 | 1 | 0 | 8.7 | 27.5 | 16,738 | +24.9 | |
| Conservative | 1 | 0 | 1 | -1 | 4.3 | 8.9 | 5,392 | +2.8 | |
| Residents | 1 | 0 | 3 | -3 | 4.3 | 6.5 | 3,941 | -25.1 | |
| Independent Labour | 0 | 0 | 2 | -2 | 0.0 | 2.1 | 1,247 | +1.6 | |
This resulted in the following composition of the council:[1][2]
| Party | Previous council | New council | |||
|---|---|---|---|---|---|
| Labour | 47 | 53 | |||
| Residents | 10 | 7 | |||
| SDP–Liberal Alliance | 4 | 4 | |||
| Conservatives | 3 | 2 | |||
| Independent Labour | 2 | 0 | |||
| Total | 66 | 66 | |||
| Working majority | 28 | 40 | |||
Ward results
+/- figures represent changes from the last time these wards were contested.
| Party | Candidate | Votes | % | ± | |
|---|---|---|---|---|---|
| Labour | Shirt R. | 1,330 | 64.8 | +9.4 | |
| SDP–Liberal Alliance | French W. | 426 | 20.8 | +20.8 | |
| Conservative | Oldfield H. | 296 | 14.4 | +5.2 | |
| Majority | 904 | 44.1 | +24.0 | ||
| Turnout | 2,052 | 27.0 | -3.7 | ||
| Labour hold | Swing | -5.7 | |||
| Party | Candidate | Votes | % | ± | |
|---|---|---|---|---|---|
| Labour | Langford L. | 1,420 | 79.6 | -4.9 | |
| SDP–Liberal Alliance | Linstead M. Ms. | 227 | 12.7 | +12.7 | |
| Conservative | Sykes A. | 138 | 7.7 | +7.7 | |
| Majority | 1,193 | 66.8 | -2.1 | ||
| Turnout | 1,785 | 24.7 | +0.2 | ||
| Labour hold | Swing | -8.8 | |||
| Party | Candidate | Votes | % | ± | |
|---|---|---|---|---|---|
| Labour | Ennis J. | 1,632 | 72.6 | -11.1 | |
| SDP–Liberal Alliance | Mayes M. | 392 | 17.4 | +17.4 | |
| Conservative | Schofield D. Ms. | 225 | 10.0 | -6.4 | |
| Majority | 1,240 | 55.1 | -12.2 | ||
| Turnout | 2,249 | 30.4 | +1.5 | ||
| Labour hold | Swing | -14.2 | |||
| Party | Candidate | Votes | % | ± | |
|---|---|---|---|---|---|
| Labour | Wood J. | 1,803 | 55.1 | -1.1 | |
| SDP–Liberal Alliance | Taylor M. Ms. | 1,087 | 33.2 | +33.2 | |
| Conservative | Booth D. | 380 | 11.6 | +4.5 | |
| Majority | 716 | 21.9 | +2.3 | ||
| Turnout | 3,270 | 38.9 | +4.2 | ||
| Labour hold | Swing | -17.1 | |||
| Party | Candidate | Votes | % | ± | |
|---|---|---|---|---|---|
| Residents | Wraith C. | 1,331 | 48.0 | +12.7 | |
| Labour | Welsh J. | 1,243 | 44.8 | -14.1 | |
| SDP–Liberal Alliance | Burton M. Ms. | 200 | 7.2 | +7.2 | |
| Majority | 88 | 3.2 | -20.5 | ||
| Turnout | 2,774 | 35.9 | -2.7 | ||
| Residents hold | Swing | +13.4 | |||
| Party | Candidate | Votes | % | ± | |
|---|---|---|---|---|---|
| Labour | Dixon T. | 2,063 | 80.0 | +15.4 | |
| SDP–Liberal Alliance | Birkbeck J. | 517 | 20.0 | +20.0 | |
| Majority | 1,546 | 59.9 | +30.8 | ||
| Turnout | 2,580 | 32.3 | -2.1 | ||
| Labour hold | Swing | -2.3 | |||
| Party | Candidate | Votes | % | ± | |
|---|---|---|---|---|---|
| Labour | Driver J. | 1,524 | 46.1 | +0.5 | |
| SDP–Liberal Alliance | Evans J. | 1,301 | 39.3 | +37.0 | |
| Conservative | Slater A. | 482 | 14.6 | +7.2 | |
| Majority | 223 | 6.7 | -1.7 | ||
| Turnout | 3,307 | 36.8 | -5.9 | ||
| Labour gain from SDP–Liberal Alliance | Swing | -18.2 | |||
| Party | Candidate | Votes | % | ± | |
|---|---|---|---|---|---|
| Labour | Ramsden D. | 1,222 | 48.9 | -41.4 | |
| Independent Labour | Gregory J. | 1,046 | 41.9 | +41.9 | |
| SDP–Liberal Alliance | Mulvany M. | 231 | 9.2 | +9.2 | |
| Majority | 176 | 7.0 | -73.6 | ||
| Turnout | 2,499 | 27.4 | -2.4 | ||
| Labour gain from Independent Labour | Swing | -41.6 | |||
| Party | Candidate | Votes | % | ± | |
|---|---|---|---|---|---|
| Labour | Lloyd D. | 1,915 | 72.6 | N/A | |
| SDP–Liberal Alliance | Hallam D. | 722 | 27.4 | N/A | |
| Majority | 1,193 | 45.2 | N/A | ||
| Turnout | 2,637 | 30.7 | N/A | ||
| Labour hold | Swing | N/A | |||
| Party | Candidate | Votes | % | ± | |
|---|---|---|---|---|---|
| Labour | Herring J. | 1,730 | 49.5 | -4.1 | |
| SDP–Liberal Alliance | Chamberlain D. | 1,074 | 30.8 | +21.4 | |
| Residents | Whitmey C. | 688 | 19.7 | -13.8 | |
| Majority | 656 | 18.8 | -1.4 | ||
| Turnout | 3,492 | 42.9 | -1.8 | ||
| Labour gain from Residents | Swing | -12.7 | |||
| Party | Candidate | Votes | % | ± | |
|---|---|---|---|---|---|
| SDP–Liberal Alliance | Steer G. | 1,696 | 59.2 | +35.3 | |
| Labour | Levitt L. | 1,167 | 40.8 | -19.4 | |
| Majority | 529 | 18.5 | -17.8 | ||
| Turnout | 2,863 | 35.9 | +1.5 | ||
| SDP–Liberal Alliance hold | Swing | +27.3 | |||
| Party | Candidate | Votes | % | ± | |
|---|---|---|---|---|---|
| Labour | Hague D. | 1,731 | 65.1 | -2.2 | |
| SDP–Liberal Alliance | Lockwood C. | 927 | 34.9 | +34.9 | |
| Majority | 804 | 30.2 | -4.5 | ||
| Turnout | 2,658 | 38.6 | -3.6 | ||
| Labour hold | Swing | -18.5 | |||
| Party | Candidate | Votes | % | ± | |
|---|---|---|---|---|---|
| Labour | Robinson R. | 1,931 | 70.0 | -0.6 | |
| SDP–Liberal Alliance | Major C. | 473 | 17.2 | +17.2 | |
| Conservative | White J. | 354 | 12.8 | +6.6 | |
| Majority | 1,458 | 52.9 | +5.4 | ||
| Turnout | 2,758 | 30.9 | -2.5 | ||
| Labour hold | Swing | -8.9 | |||
| Party | Candidate | Votes | % | ± | |
|---|---|---|---|---|---|
| Labour | Williams A. | 1,505 | 48.3 | -9.0 | |
| SDP–Liberal Alliance | Appleyard J. Ms. | 799 | 25.7 | +25.7 | |
| Conservative | Jubb M. | 450 | 14.5 | +14.5 | |
| Residents | Harris M. Ms. | 360 | 11.6 | -31.1 | |
| Majority | 706 | 22.7 | +8.1 | ||
| Turnout | 3,114 | 40.2 | -2.3 | ||
| Labour hold | Swing | -17.3 | |||
| Party | Candidate | Votes | % | ± | |
|---|---|---|---|---|---|
| Labour | Warden R. | 1,506 | 67.1 | -6.7 | |
| SDP–Liberal Alliance | Smailes J. | 457 | 20.4 | +12.8 | |
| Conservative | Rawson N. | 280 | 12.5 | +6.2 | |
| Majority | 1,049 | 46.8 | -14.7 | ||
| Turnout | 2,243 | 37.5 | +7.8 | ||
| Labour hold | Swing | -9.7 | |||
| Party | Candidate | Votes | % | ± | |
|---|---|---|---|---|---|
| SDP–Liberal Alliance | Peach E. Ms. | 949 | 32.2 | +32.2 | |
| Conservative | Dews R. | 916 | 31.1 | -23.6 | |
| Labour | Banner K. | 872 | 29.6 | -15.7 | |
| Residents | Ryalls G. | 208 | 7.1 | +7.1 | |
| Majority | 33 | 1.1 | -8.4 | ||
| Turnout | 2,945 | 44.1 | -1.6 | ||
| SDP–Liberal Alliance gain from Conservative | Swing | +27.9 | |||
| Party | Candidate | Votes | % | ± | |
|---|---|---|---|---|---|
| Conservative | Neville F. Ms. | 1,147 | 34.8 | +34.8 | |
| Residents | Harrison D. | 913 | 27.7 | -40.5 | |
| Labour | Morris A. | 646 | 19.6 | -3.4 | |
| SDP–Liberal Alliance | Stein W. | 591 | 17.9 | +9.4 | |
| Majority | 234 | 7.1 | -37.9 | ||
| Turnout | 3,297 | 41.5 | -12.1 | ||
| Conservative hold | Swing | +37.6 | |||
| Party | Candidate | Votes | % | ± | |
|---|---|---|---|---|---|
| Labour | Rispin C. | 2,258 | 70.8 | +13.2 | |
| Labour | Lavender H. | 1,865 | |||
| SDP–Liberal Alliance | Williamson J. | 731 | 22.9 | +22.9 | |
| SDP–Liberal Alliance | Smith A. | 715 | |||
| Independent Labour | Jones H. | 201 | 6.3 | +6.3 | |
| Majority | 1,527 | 47.9 | +32.7 | ||
| Turnout | 3,190 | 39.0 | +0.9 | ||
| Labour hold | Swing | ||||
| Labour gain from Independent Labour | Swing | -4.8 | |||
| Party | Candidate | Votes | % | ± | |
|---|---|---|---|---|---|
| Labour | O'Rourke J. | 1,179 | 38.2 | -8.8 | |
| SDP–Liberal Alliance | Bickley K. Ms. | 1,104 | 35.8 | +35.8 | |
| Residents | Kent J. | 441 | 14.3 | -29.0 | |
| Conservative | England G. | 363 | 11.8 | +2.1 | |
| Majority | 75 | 2.4 | -1.3 | ||
| Turnout | 3,087 | 41.3 | -1.8 | ||
| Labour gain from Residents | Swing | -22.3 | |||
| Party | Candidate | Votes | % | ± | |
|---|---|---|---|---|---|
| Labour | Fellows B. | 895 | 52.6 | -9.2 | |
| SDP–Liberal Alliance | Calton W. | 807 | 47.4 | +47.4 | |
| Majority | 88 | 5.2 | -18.4 | ||
| Turnout | 1,702 | 31.1 | +0.0 | ||
| Labour hold | Swing | -28.3 | |||
| Party | Candidate | Votes | % | ± | |
|---|---|---|---|---|---|
| Labour | Naylor T. | 1,645 | 63.3 | -13.0 | |
| SDP–Liberal Alliance | Young S. Ms. | 955 | 36.7 | +36.7 | |
| Majority | 690 | 26.5 | -26.1 | ||
| Turnout | 2,600 | 32.8 | +3.2 | ||
| Labour hold | Swing | -24.8 | |||
| Party | Candidate | Votes | % | ± | |
|---|---|---|---|---|---|
| Labour | Bristowe T. | 2,393 | 62.5 | +3.9 | |
| SDP–Liberal Alliance | Ramsay R. | 1,072 | 28.0 | +28.0 | |
| Conservative | Pappworth R. | 361 | 9.4 | +5.3 | |
| Majority | 1,321 | 34.5 | +13.0 | ||
| Turnout | 3,826 | 46.0 | -5.0 | ||
| Labour gain from Residents | Swing | -12.0 | |||
References
- 1 2 3 4 5 6 7 8 9 10 11 12 13 14 15 16 17 18 19 20 21 22 23 24 25 "Elections Centre: Barnsley 1973-2012" (PDF). electionscentre.co.uk/plymouth.ac.uk. Archived from the original (PDF) on 2017-07-25. Retrieved 2017-07-25.
- 1 2 3 4 5 6 7 8 9 10 11 12 13 14 15 16 17 18 19 20 21 22 23 24 25 "Election results 1979 to 2003" (PDF). barnsley.gov.uk. Archived from the original (PDF) on 2017-07-28. Retrieved 2017-07-28.
| Barnsley Metropolitan Borough Council | |
|---|---|
| Doncaster Metropolitan Borough Council | |
| Rotherham Metropolitan Borough Council | |
| Sheffield City Council |
|
| South Yorkshire County Council |
|
| West Riding County Council | |
| Sheffield City Region | |
| |
| London boroughs |
|
|---|---|
| Metropolitan boroughs |
|
| District councils (England) |
|
| Regional councils (Scotland) |
|
This article is issued from
Wikipedia.
The text is licensed under Creative Commons - Attribution - Sharealike.
Additional terms may apply for the media files.